VantagePoint: Third Quarter 2019

Advice in Brief
US equity performance relative to other major equity markets has been unusually strong for the extended period since 2009. As is typically the case, investors have developed a battery of reasons why the lofty valuations of US equities are justified and why they will continue to outperform other markets for the long run. In this edition of VantagePoint, we will uncover four of the most common inaccuracies we hear about US equities:
- US companies’ high quality bias justifies current valuations.
- Exceptionally strong US profit margins are sustainable for the indefinite future.
- US equities will not suffer much in a trade war.
- US companies focus on buybacks, foregoing investing for the future.
We expect that stretched valuation premiums for US versus global ex US equities will converge back toward average historical levels over time as the truth unfolds about these fallacies and half-truths, reinforcing the lesson that trees don’t grow to the sky. Of course, timing of any such reckoning is unpredictable and may not come to fruition until the next recession, particularly as US equities tend to be defensive in times of stress. Given the stage of the economic cycle, we continue to recommend modest underweights to US equities relative to global ex US developed and emerging markets equities. We would look to increase underweights in a recession-related bear market.
HALF-TRUTHS AND FALSITIES. US equity performance has been unusually strong relative to other major equity markets for the extended period since 2009. Indeed, as we go to press, the S&P 500 Index has topped 3,000 for the first time, while other major markets remain below their January 2018 highs. As is typically the case, investors have developed a battery of reasons why the lofty valuations of US equities are justified and why they will continue to outperform other markets for the long run. In this edition of VantagePoint, we will uncover four of the most common inaccuracies we hear about US equities:
- US companies’ high quality bias justifies current valuations.
- Exceptionally strong US profit margins are sustainable for the indefinite future.
- US equities will not suffer much in a trade war.
- US companies focus on buybacks, foregoing investing for the future.
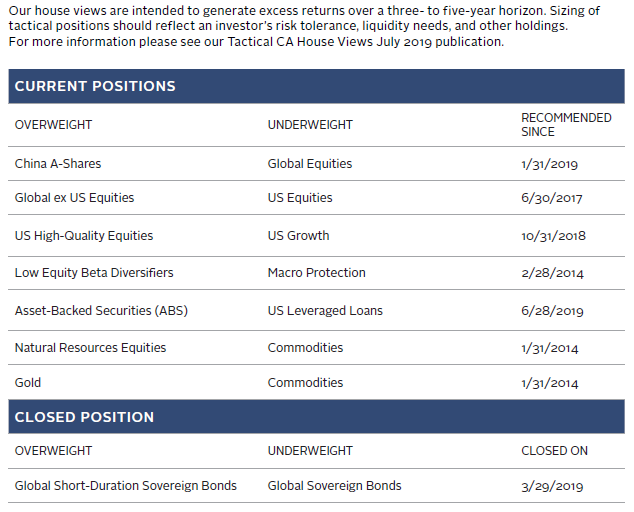
OVERVIEW OF TACTICAL CA HOUSE VIEWS
June 28, 2019
US Companies’ High Quality Bias Justifies Current Valuations
HALF-TRUTH. It’s true that US indexes skew high quality, and that justifies a valuation premium; the quality bias is nothing new, yet today’s premium is considerably higher than it has been historically. In the aggregate, US-listed companies offer higher returns on equity (ROE) and returns on invested capital (ROIC)—both proxies for overall business quality—than their counterparts around the globe. However, the quality of US companies has not increased relative to that of non-US companies over the last several decades, so why should such companies command a higher valuation premium today? One possible reason is that in a lower global growth environment, especially one threatened by prospects of disruption from escalating geopolitical rivalries and populist economic policies, growth and stability are more valued by investors. High-growth companies are hard to come by and steadily profitable growers can compound their wealth significantly over time. Such stability is particularly valuable in an environment where return prospects for high-quality government bonds are paltry. Yet, this support for US equities will ultimately prove to be ephemeral.
The median profitability premium for US equities relative to developed ex US and emerging markets equities has been significant. Over the last 20 years, the ROE and ROIC of US equities relative to global ex US equities has had a median premium of 38% and 50%, respectively. As of year-end 2018, relative profitability metrics were sitting right on their 20-year averages, but have increased (in favor of US equities) in 2019 as US profitability metrics continued to reach all-time highs, while outside the United States, both metrics remain anemic. These profitability premiums for US equities are not merely a reflection of sector composition differences, as higher ROEs and ROICs persist across most economic sectors relative to both developed markets and emerging markets outside the United States. Rather, the differences appear to be structural.
US EQUITY PROFITABILITY METRICS ARE SUPERIOR TO THOSE OF GLOBAL EX US EQUITIES
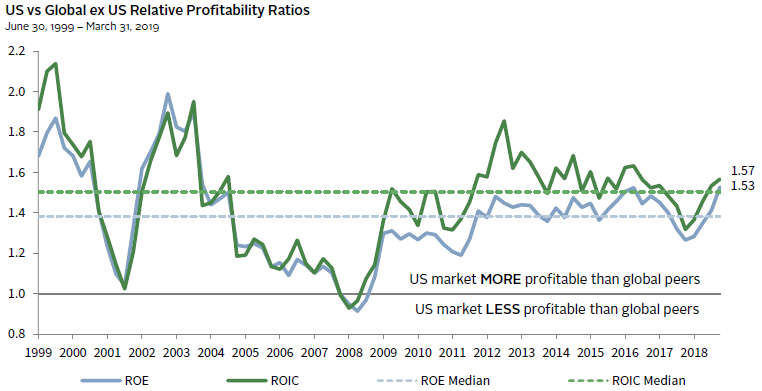
Sources: FactSet Research Systems and MSCI Inc. MSCI data provided “as is” without any express or implied warranties.
Note: US is represented by the MSCI US Index and Global ex US is represented by the MSCI All Country World ex US Index.
A longer-term historical perspective based on ROE data 1 reveals that the United States has generally maintained premium relative profitability since 1974. Over the full period, the median US ROE premium was roughly 40% relative to the MSCI World ex US Index, and the median premium was 30% after adjusting for distortions caused by Japan’s outsized index impact in the 1990s. In both cases, the median over the last 20 years was roughly equivalent to that over the full history (5 percentage points [ppts] higher for World ex US versus 3 ppts lower for EAFE ex Japan).
RELATIVE US RETURN ON EQUITY DOES NOT SUPPORT PEAK RELATIVE VALUATIONS
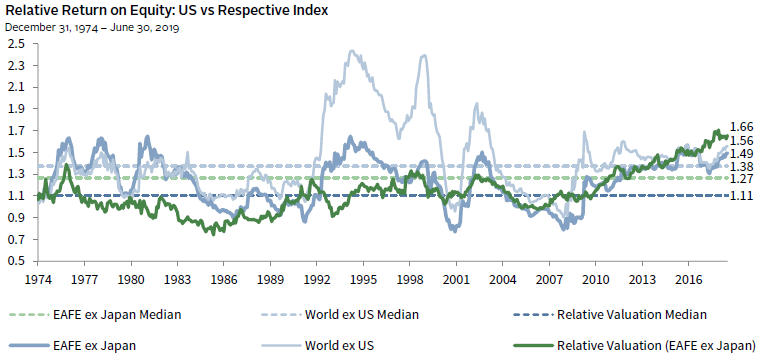
Sources: MSCI Inc. and Thomson Reuters Datastream. MSCI data provided “as is” without any express or implied warranties.
Notes: ROE data for the MSCI EAFE ex Japan Index begin on January 31, 1975. The “Relative Valuation” is based on the composite normalized price-earnings (P/E). The composite normalized P/E ratio is calculated by dividing the inflation-adjusted index price by the simple average of three normalized earnings metrics: ten-year average real earnings (i.e., Shiller earnings), trend-line earnings, and return on equity–adjusted earnings. All data are monthly.
While US relative ROEs are elevated today, they were comparably elevated in the mid-1990s, the late 1970s, and the early 1980s, yet relative valuations were much lower in those prior periods than they are now. If there is not a structural boost in relative profitability metrics today in comparison to history, then there is no reason US equities should maintain a heightened valuation premium today. Based on our composite normalized P/E ratio, the US valuation premium relative to developed ex US markets is roughly 40 ppts higher today compared to the historical 20-year median of 21 ppts and is 50 ppts above the long-term median. Other valuation metrics, like price-to–cash earnings and enterprise value-to-EBITDA produce similar, but less extreme results. 2
US equities deserve a valuation premium relative to global ex US equities, but fundamentals do not suggest that they should command today’s excessive valuation premium compared to history. The incremental premium above the historical average will eventually prove to be ephemeral.
Exceptionally Strong US Profit Margins Are Sustainable for the Indefinite Future
HALF-TRUTH. While the United States appears to have some defensible advantages in maintaining superior net profit margins, today’s elevated margin levels may be poised for a reversal of fortune. Six key factors have supported high US profit margins: increased globalization, cost-reducing technological advances, broad declines in labor’s negotiating power, less restrictive anti-trust enforcement, lower corporate taxes, and cheaper credit costs. Some of these key forces are starting to fade, while others still have some momentum behind them. On balance, the evidence suggests we are at or very near peak margins and should be prepared for margin compression over time.
High net profit margins have been driven by the tech sector. In 2007, net profit margins for the broad US market and the US tech sector were quite similar, with a gap of just 85 basis points (bps). Currently, US tech sector net profit margins are a whopping 5 ppts higher than those for the broad market.
US COMPANIES MAINTAIN HIGH PROFIT MARGINS DOMINATED BY TECH SECTOR
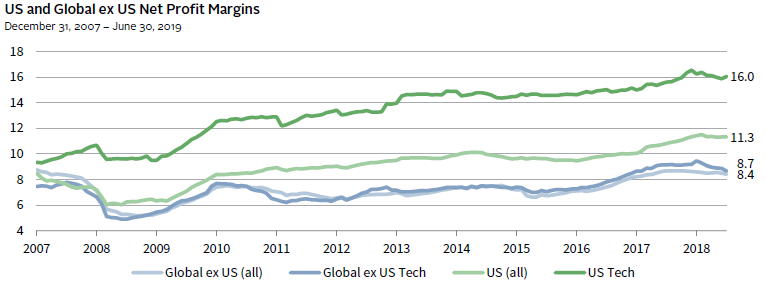
Sources: FactSet Research Systems and MSCI Inc. MSCI data provided “as is” without any express or implied warranties.
Notes: US is represented by the MSCI US Index and Global ex US is represented by the MSCI All Country World ex US Index. “Tech” includes the Communication Services and Information Technology GICS sectors, as well as the Consumer Discretionary > Retail > Internet and Direct Marketing GICS Industry.
According to analysis by investment research firm, Empirical Research Partners, manufacturers in the S&P 500 (30% of which are in the tech sector) are responsible for half the index’s earnings and generate profit margins 9 ppts higher than the rest of the market. Their research revealed that manufacturers’ margin expansion was driven by three roughly equivalent factors: (1) wage savings from offshoring and robotics, (2) global tax arbitrage, and (3) falling interest rates.
GLOBALIZATION HAS LED US MANUFACTURERS’ PROFIT MARGIN EXPANSION
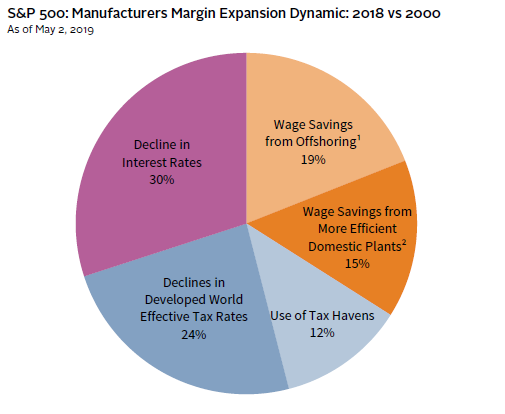
Sources: Empirical Research Partners, US Census Bureau, and US Department of Labor – Bureau of Labor Statistics.
1 Assumes that lost US jobs were replaced by jobs in China at lower rates of compensation.
2 Assumes the decline in the labor intensity of these plants matches that for the entire US manufacturing system.
The trade war directly threatens the part of the market that has generated most of the margin expansion—the tech sector and other global manufacturers. Even without added tariffs and supply chain restructuring, future wage savings from offshoring may be limited. Chinese hourly manufacturing compensation costs have increased from 2 cents to 14 cents on-the-dollar relative to US costs since China joined the WTO in 2001, with all-in manufacturing costs coming close to parity with the United States. With other Asian competitors offering lower production costs, production began shifting to countries, such as Vietnam and Bangladesh, well before the trade conflicts heated up. However, there are limits on the ability of such countries to handle the same types of manufacturing done in China without meaningful investment and time to improve. In particular, logistics capabilities are severe bottlenecks and labor skills are lacking.
Robotics appears to have plenty of room for continued penetration into manufacturing. The global operational stock of industrial robots has grown at a 10% annual growth rate since 2009, and the International Federation of Robotics projects 16% growth over the next several years. US robotics use lags Asian countries, leaving more room for further robot adoption to cut costs. US manufacturers employ 50 human workers for every robot, compared to 30-to-1 in Japan and just 14-to-1 in Korea. But even as automation reduces costs, improving margins of individual companies, such productivity enhancements could eventually reduce overall employee compensation enough to limit a country’s consumption and ultimately the aggregate profit margins of its companies.
Globalization and reduced employee bargaining power have contained wage growth. A sharp decline in organized labor and increased concentration in US industries have limited workers’ bargaining power, while concentration has also supported companies’ pricing power. According to the US Department of Labor, the percentage of US employees in a labor union has halved since the 1980s to just 10.5% in 2018. At the same time, increased mergers & acquisitions (M&A) activity, amid decreased antitrust enforcement, has boosted industry concentration in the United States. Researchers Gustavo Grullon, Yelena Larkin, and Roni Michaely 3 found that a commonly used measure of index concentration, the Herfindahl-Hirschman index (HHI), 4 has increased more than 70% since 1997, reflecting significantly higher market concentration among US publicly traded firms in the Center for Research in Security Prices database. This metric understates industry concentration, to the degree that market concentration exists at the state or regional level. For example, many industries have divided up markets, creating local oligopolies. Health insurance provides a classic example, as regulations prevent insurers from selling policies across state lines; in many states the top two insurers have an 80% to 90% market share. 5
Finally, while it is possible for tax rates and interest expenses to decline further, this is not a reasonable base-case assumption, given the considerable decline in tax rates, the increase in government debt, and the very low level of interest rates. The effective tax rate of US publicly listed companies has fallen from about 45% in the 1970s to about 20% today. These forces may not reverse course in the near term, but they are unlikely to provide a means for further margin expansion.
Profit margins have remained elevated for an unusually long period as numerous forces converged to expand margins to new peaks. However, the tide appears to be turning on some of these secular trends. Even as companies see diminishing marginal gains from offshoring, falling rates, and lower taxes, negative sentiment toward globalization and large companies in general has been mounting in the current populist environment. A growing number of Republicans and Democrats are aligned against the increasing power of ultra-large tech companies, and the House Judiciary Committee in June announced a bipartisan antitrust investigation of large technology companies. European regulators are also seeking taxation (e.g., a digital service tax on revenue) and legal fines (e.g., for hate speech and copyright violations) on tech firms. Profit margins are likely to compress over time, as globalization trends become less favorable and as large companies come under pressure from politicians seeking improved income equality and increased market competition.
US Equities Will Not Suffer Much in a Trade War
FALSE. As discussed above, a key reason that net profit margins will compress is backlash against globalization, of which the trade war is an important manifestation. US equities have held up better than most other markets since trade tensions began to escalate in 2018, but it is far from certain that US corporations will face minimal repercussions as the latest trade maneuvers work their way through the economy and as any new tariffs or sanctions are introduced. The trade-related risks to US equities stem from the following:
- US-listed equities have far more exposure to global trade than the US economy has;
- Corporations are unlikely to continue to maintain margins by offsetting tariffs through price increases; and
- China has plenty of tools at its disposal to pressure the United States, which may result in a long trade war with implications for global trade market share and supply chains.
China is viewed as the country with more to risk in the trade war than the United States, given exports to the United States are 4% of Chinese GDP, while US exports to China are less than 1%. Implications for US equities are much more significant than for the US economy, however. For example, Goldman Sachs estimates that currently implemented tariffs would reduce US GDP by about 20 bps, while across the board 25% tariffs on all Chinese imports would reduce GDP by 50 bps over the course of three years. In terms of price increases, tariffs imposed thus far (including on washing machines and steel) have boosted PCE inflation by 0.2 ppts and would increase it by 0.6 ppt with all US/Chinese trade facing tariffs of 25% (although these increases would be transitory, reflecting a one-time step up in inflation if tariffs remain stable). While estimates vary, Goldman Sachs’ expectations are representative.
Though estimates for the economy are minor, implications for corporate earnings are more significant. The consensus is that if tariffs of 25% were levied on all US and Chinese exports, the effect on earnings would be about 5% or $9/share for the S&P 500. The error around these estimates is significant. Supply chain effects are meaningful and difficult to estimate. For example, analysis from the Peterson Institute reveals that the vast majority of Chinese exports to the United States originate from foreign-invested enterprises operating in China, including foreign subsidiaries of US multinational corporations. In other words, US equities are not immune from tariff risks, including direct effects from the United States’ own tariffs.
Thus far, the evidence suggests that US companies have been able to pass along most of the initial round of tariff-related price increases to consumers, maintaining profit margins. Further increases (from 10% to 25%) will be more difficult to pass through, particularly if related to consumer goods. The bulk of China exports to the United States are tech products, industrial capital goods, and inputs to the supply chains of those industries. Only around 25% are in traditional consumer product categories like apparel, furniture, and textiles. More complex products are less likely to see decreased demand from changes in price.
TARIFFS THUS FAR HAVE BEEN PASSED ON TO US CONSUMERS
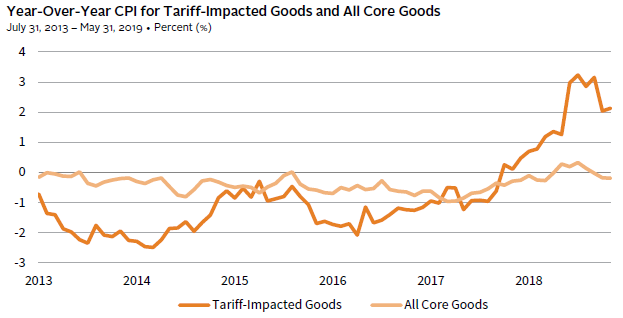
Sources: Thomson Reuters Datastream and US Department of Commerce – Bureau of Labor Statistics.
Notes: “Tariff-Impacted Goods” include: motor vehicle parts & equipment, furniture & bedding, household appliances, sports vehicles, household cleaning products, and sewing machines & supplies. “All Core Goods” are the Commodities less food and energy index, which includes apparel, new vehicles, used cars & trucks, medical care commodities, and alcohol & tobacco.
In addition, US companies appear to be shifting production to other jurisdictions, mostly in East Asia, to avoid tariffs. We see this through US tariff revenues coming in at about half of expected levels, while US consumers have not significantly cut their consumption of tariffed goods. Decisions regarding relocating production from China to other countries will likely take time, as these moves are costly and corporations are likely to wait until they have more clarity around trade before making such investments. Indeed, we have seen a decline in cross-border M&A and capital expenditures (capex) as trade tensions have escalated.
Even if corporations can maintain profit margins by passing through price increases, at some point, this would be negative for profits too. Price inflation decreases consumer and corporate purchasing power, which has potential to curtail revenues if corporations and consumers spend less as a result. Corporate cash flows and access to credit remain plentiful today, while consumers remain in good health, so both sectors can absorb some price increases in the near term. Of course, the longer these conditions persist, the greater the inflation and the uncertainty, which could curb spending and investment.
Investors should not underestimate the potential for an extended and expanded trade war. China can take pain and has plenty of tools to offset the impact from higher tariffs. The truce between China and the United States at the June G20 meeting may prove to be temporary in nature. Even if a deal is reached, it is unlikely that the fundamental tensions related to intellectual property and technology transfer rights will be resolved any time soon. Indeed, the trade war may become secondary to the tech embargo war, which could cause lasting impact and be harder to unwind in the short to mid-term.
While China does not import enough US goods and services to match the United States dollar for dollar in tariffs, it does have other “qualitative” means of leverage, including being home to US subsidiaries with sales of $223 billion into China in 2017. China could pressure consumers and corporations to boycott and reduce shipments of goods manufactured by local subsidiaries of US companies, and could even target products that have alternative suppliers to limit domestic damage. For example, in response to the United States adding Huawei to the Entity List requiring preapproval to purchase certain US items under the name of US national security, China announced its own “unreliable entity list” for foreign firms.
Longer term, to the degree that China becomes more independent in its development of technology components including semiconductors, US exporters to China would suffer; movement of supply chains would hurt US companies with operations in China that would see existing Chinese investments lose value. So far this activity has been limited, perhaps in part because some of these US companies are major employers and China does not want to aggravate unemployment levels at a time that economic growth is slowing.
While not often discussed, at the same time that China has increased tariffs on US exports, in retaliation for US tariffs, it has reduced tariffs against other countries. With the exception of imports of US autos, aircraft, and pharmaceuticals, China now levies a meaningfully higher tariff on US imports than on the same goods from other nations. As a result, China’s imports from the United States have fallen much more significantly than imports from all other exporters since September 2018. At the same time, other countries are striking trade deals that exclude the United States, such as the recent EU deals with Canada and Japan and the Trans-Pacific Partnership. The United States may find its export competitiveness reduced. Even as exports are not a significant percentage of GDP in the United States at low growth rates, loss of market share can bite.
CHINA IS RAISING TARIFFS ON US GOODS AND LOWERING THEM FOR THE REST OF THE WORLD
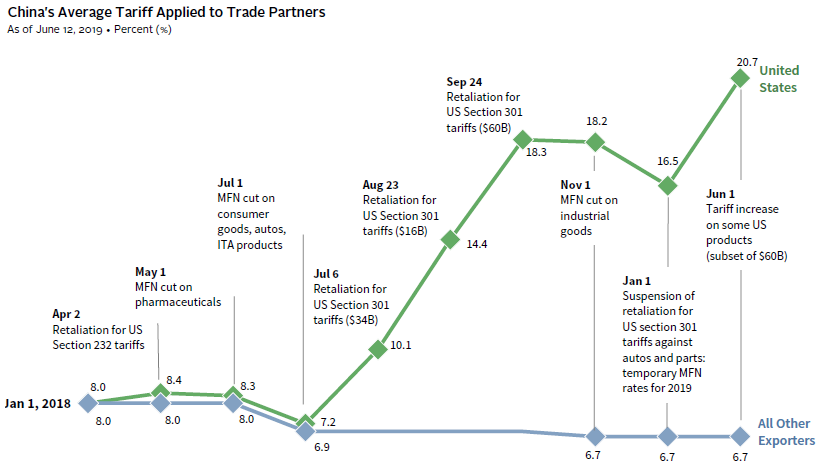
Source: Peterson Institute for International Economics.
Notes: Concept adapted from PIIE. “ITA” stands for Information Technology Agreement and “MFN” stands for Most Favored Nation. Trade-weighted average tariffs computed from product-level tariff and trade data, weighted by exports to the world in 2017.
The United States is not immune to trade pressures. While exports are not a particularly large share of GDP, US corporations are heavily exposed to global supply chains and foreign operations. Further, increased tariffs will result in higher consumer inflation and currency volatility, and if significant and prolonged, supply chains will ultimately shift (rendering some manufacturing and distribution infrastructure obsolete). The key variables, of course, are the degree to which tariffs and other constraints on trade escalate and how long the escalation lasts. One important offset to these negative prospects is that the United States and China still have flexibility for easing (both monetary and fiscal policy), while proposed EU appointments indicate more potential for fiscal easing and a continuation of European Central Bank easing monetary policies. Some emerging markets central banks are already cutting rates. These policies can provide an offset to some degree, but given low policy rates, large central bank balance sheets, and elevated government debt levels across much of the developed world, policy makers have less firepower today than they have had in the past.
US Companies Focus on Buybacks, Foregoing Investing for the Future
FALSE. While it is true that US corporations have ramped up their buyback activity in recent years, and that such activities have helped support US equity prices, this has not come at the expense of capital expenditures. GAAP accounting rules contribute to this misperception, as total shareholder payouts have exceeded reported net income in recent years, bolstering the narrative that companies are levering up to return cash to shareholders at the expense of investing for future growth. These statistics are misleading for several reasons. First, reported earnings understate true economic earnings, as several categories of investments that arguably have value over a multiyear time horizon must be expensed as operating expenses. Second, many analysts ignore share issuance, particularly when employee stock options are exercised, while in fact it should be netted out against buybacks.
Since they were legalized in 1982, 6 US corporations have come to use buybacks as a standard means of returning capital to shareholders. In the United States, buybacks provide a more tax advantaged means than dividends for returning cash to shareholders. Further, they offer greater flexibility to corporations, as shareholders expect dividends to be more stable than share buybacks, offering corporations more freedom to increase or decrease payouts to shareholders based on other potential cash uses. Since 2005, buybacks have averaged about 60% of MSCI US company payouts to shareholders, or about 45% of payouts when adjusted to be net of share issuance.
Payout ratios based on reported earnings paint a misleading picture of how corporations allocate capital. The most obvious example is research & development (R&D), 7 which is treated as an operating expense in GAAP accounting. R&D has increased 160% in nominal terms since 2005 and has grown almost twice as fast as capex. Indeed, over the last several years, aggregate R&D expenditures have totaled about 40% of capex for MSCI US companies in aggregate and have roughly equaled capex in excess of depreciation, which serves as a rough proxy for growth capex.Since capital investments depreciate over time and companies must make additional investments to maintain existing levels of capital assets, the portion of capex that is equal to depreciation can be used as a rough guide to estimate capex for maintenance, while any additional capex can be viewed as expansionary, or capex to support growth. Of course, this is an imperfect measure. To the degree that companies depreciate capital assets faster than their useful lives, this analysis overstates maintenance and understates growth capex. 8 If R&D were treated as a capital expenditure and capitalized rather than expensed, payout ratios would be well below 100%.
The best way to look at corporate capital allocation is to take a holistic view of cash uses, rather than to rely solely on GAAP earnings analysis that understates corporate resources. Through this holistic lens, it is clear that corporations continue to make significant investments in the future. Both buybacks and capex were elevated in 2018 and over the last 12 months, in part due to incentives included in the late 2017 Tax Cuts and Jobs Act. However, over this entire market cycle, dividends and net buybacks have accounted for less than half of cash uses, with R&D, capex, and cash acquisitions playing a dominant role.
US PUBLIC COMPANIES ARE INVESTING IN THE FUTURE AND RETURNING CASH TO SHAREHOLDERS
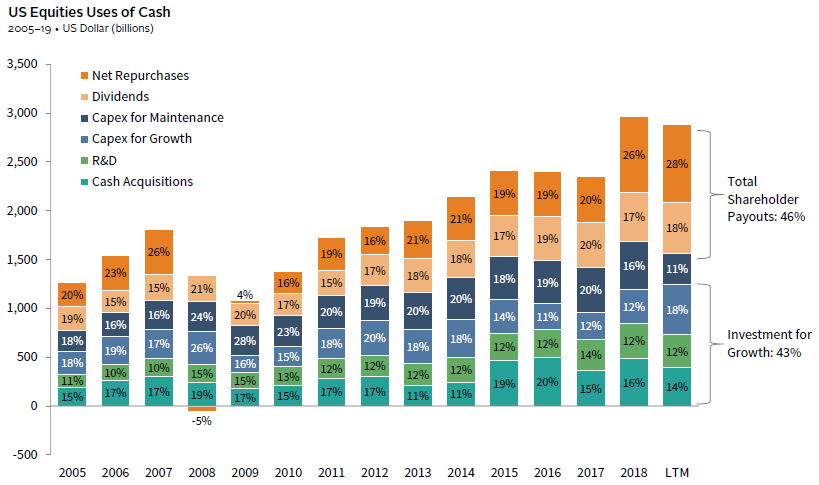
Sources: FactSet Research Systems and MSCI Inc. MSCI data provided “as is” without any express or implied warranties.
Notes: US Equities are represented by the MSCI US Index. Capex for maintenance is equal to the depreciation expense on the income statement, because a portion of the Capex must be allocated to replace existing resources. Capex for Growth is total capex minus the depreciation expense. Some columns may not sum to 100% due to rounding. LTM represents data from June 1, 2018 – May 31, 2019.
Companies have consistently allocated capital to support the future. As a percent of sales, capex and R&D have been remarkably stable. From 2005 to 2018, R&D has steadily increased from 1.8% to 2.8% of sales, while capex has ranged from 5.4% to 7.0% of sales. In total, capex and R&D have increased from 7.6% to 9.2% of sales. That said, capital investments are additive only when projects have expected returns above their weighted average cost of capital. While companies are using cash flows for growth capex and M&A today, these activities should decline once expected returns fall below the cost of capital, as they did in the 2008–09 recession before recovering in subsequent years.
CORPORATE INVESTMENT AS A PERCENT OF SALES REMAINS ROBUST
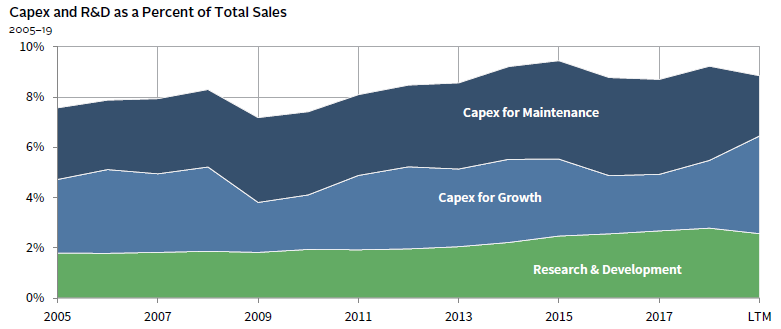
Sources: FactSet Research Systems and MSCI Inc. MSCI data provided “as is” without any express or implied warranties.
Notes: US Equities are represented by the MSCI US Index. Capex for maintenance is equal to the depreciation expense on the income statement, because a portion of the Capex must be allocated to replace existing resources. Capex for Growth is total capex minus the depreciation expense. LTM represents data from June 1, 2018 – May 31, 2019.
Conclusion
US equities have a lot to offer. We agree that the United States has a heavy dose of high-quality, innovative companies that deserve premium valuations, but we see no reason for extraordinary valuations that project peak profit margins well into the future in the face of many risks. Indeed, although profit margins have remained elevated for an unusually long period of time, the tide is beginning to turn on some of these secular trends. In addition to limited cost-reduction expectations from offshoring, falling rates, and lower taxes, negative sentiment toward globalization and large companies in general has been mounting in the current populist environment. Further, in contrast to market action to the contrary, the United States is not immune to trade pressures. While exports are not a particularly large share of GDP, US corporations are heavily exposed to global supply chains and foreign operations, while China has plenty of tools to manage through a long period of trade conflict.
The better news is that the perspective that US corporations’ focus on buybacks and short-term returns forestalls investment in future growth is also false. Of course, growth capex and M&A activities are cyclical, and will likely decline in the next recession, but remain supportive for now and represent a long-term positive for US equities.
We expect that stretched valuation premiums for US versus global ex US equities will converge back toward average historical levels over time as the truth unfolds about these fallacies and half-truths, reinforcing the lesson that trees don’t grow to the sky. Of course, timing of any such reckoning is unpredictable and may not come to fruition until the next recession, particularly as US equities tend to be defensive in times of stress. Given the stage of the economic cycle, we continue to recommend modest underweights to US equities relative to global ex US developed and emerging markets equities. We would look to increase underweights in a recession-related bear market. ■
Index Disclosures
Consumer Price Index
The Consumer Price Index is a measure of the average change over time in the prices paid by urban consumers for a market basket of consumer goods and services. Indexes are available for the United States and various geographic areas. Average price data for select utility, automotive fuel, and food items are also available.
MSCI All Country World ex USA Index
The MSCI ACWI ex USA Index is a free float–adjusted, market capitalization–weighted index designed to measure the equity market performance of developed and emerging markets. It consists of 48 country indexes comprising 22 developed and 26 emerging markets country indexes. The developed markets country indexes included are: Australia, Austria, Belgium, Canada, Denmark, Finland, France, Germany, Hong Kong, Ireland, Israel, Italy, Japan, the Netherlands, New Zealand, Norway, Portugal, Singapore, Spain, Sweden, Switzerland, and the United Kingdom. The emerging markets country indexes included are: Argentina, Brazil, Chile, China, Colombia, Czech Republic, Egypt, Greece, Hungary, India, Indonesia, Korea, Malaysia, Mexico, Pakistan, Peru, the Philippines, Poland, Qatar, Russia, Saudi Arabia, South Africa, Taiwan, Thailand, Turkey, and the United Arab Emirates.
MSCI US Index
The MSCI US Index is designed to measure the performance of the large- and mid-cap segments of the US market. With 617 constituents, the index covers approximately 85% of the free float–adjusted market capitalization in the United States.
Footnotes
- We look at the long history of ROE data, as it is more accessible than ROIC data and has followed a similar pattern to ROIC metrics, given the similarities between the two metrics. We compare US data to developed ex US equities, as MSCI emerging markets fundamental metrics date back only to 1995. Because of the relatively small market-cap weight of emerging markets equities, trends between US and DM ex US equities (MSCI World ex US Index) are nearly identical to trends between US and DM ex US plus EM equities (MSCI All Country World ex US Index).
- US price-to–cash earnings multiples and EV-to-EBITDA multiples trade at a 16 ppt and 23 ppt premium compared to the average of the last 20 years, respectively.
- Please see Gustavo Grullon et al., “Are US Industries Becoming More Concentrated?,” Review of Finance.
- The HHI measures the sum of the square of the market share of each firm competing in a market and can range from zero (very competitive) to 10,000 (a monopoly).
- For an excellent discussion of industry concentration trends and the history of US antitrust precedent, please see Jonathan Tepper and Denise Hearn, The Myth of Capitalism, Monopolies and the Death of Competition (Hoboken, NJ: John Wiley & Sons, Inc., 2019).
- In 1982, the SEC passed rule 10b-18, which legalized buybacks. Prior to that time, share repurchase activity was restricted and viewed as a means toward stock manipulation.
- Other operating expenses that provide lasting benefits and could reasonably be capitalized include advertising expenses that serve to build brand equity. Further, many capitalized assets are depreciated faster than their useful lives. For example, FAS 142 passed in 2001 requires companies to have annual impairment tests of goodwill, meaning that intangibles can only be written down, but not increased. Also, real estate values depreciate to a $0 value even as their useful lives continue.
- Since capital investments depreciate over time and companies must make additional investments to maintain existing levels of capital assets, the portion of capex that is equal to depreciation can be used as a rough guide to estimate capex for maintenance, while any additional capex can be viewed as expansionary, or capex to support growth. Of course, this is an imperfect measure. To the degree that companies depreciate capital assets faster than their useful lives, this analysis overstates maintenance and understates growth capex.
Celia Dallas - Celia Dallas is the Chief Investment Strategist and a Partner at Cambridge Associates.
About Cambridge Associates
Cambridge Associates is a global investment firm with 50+ years of institutional investing experience. The firm aims to help pension plans, endowments & foundations, healthcare systems, and private clients achieve their investment goals and maximize their impact on the world. Cambridge Associates delivers a range of services, including outsourced CIO, non-discretionary portfolio management, staff extension and alternative asset class mandates. Contact us today.