
VantagePoint: The Iran War Fuels the Case for Portfolio Resilience


Geopolitical shocks often fade quickly in markets. The Iran War is testing that pattern. Alternative shipping routes, inventory drawdowns, additional supply outside the Middle East, and an earlier decline in Chinese imports have prevented an immediate energy collapse. These buffers have bought time, but the system has little room to absorb further disruption. Refined fuels and liquefied natural gas (LNG) are particularly difficult to replace, while ocean freight rates and maritime insurance premiums have risen. Investors need to consider whether their portfolios can withstand a prolonged shock.
Our base case remains a simmering conflict in which partial energy flows continue, and energy and shipping costs remain elevated and volatile. A durable resolution would ease near-term pressure, while wider disruption could bring a sharper economic shock. Escalation between Saudi Arabia and Yemen’s Houthi movement and a potential escalation by the United States, raises the risk of a broader regional conflict, particularly if attacks cause sustained losses of energy export capacity. Higher fuel prices lift headline inflation immediately; if disruption persists, higher costs could spread more widely. Even without a repeat of the 1970s, the most exposed economies could face slower growth and more restrictive monetary policy.
Investors should stress test assets, spending needs, capital calls, operating businesses, and liabilities together. When asset values fall, investors need dependable sources of funding to meet obligations, alongside return drivers that can withstand a prolonged shock. Sovereign bonds can help in a recession but may lose value when inflation lifts yields. Selected hedge funds with limited equity and interest rate exposure, along with strategies such as litigation finance and insurance-linked securities, can broaden return drivers, though their liquidity and risks differ. Over time, investment in energy security and power systems can also reduce vulnerability to future shocks and create opportunities. Investors should trim overlapping exposures and add distinct return drivers while retaining growth holdings whose valuations support long-term returns.
Less energy slack raises portfolio risk
Middle Eastern crude exports recovered to around pre-war levels in late September, supported by bypass pipelines and other ways of moving oil around disruption at the Strait of Hormuz. That recovery has not restored reliable passage through the strait or resolved shortages of refined fuels and liquefied natural gas (LNG). Attacks on ships and export infrastructure could interrupt flows again during a simmering conflict. The region has found ways to keep crude moving, but those measures offer uneven protection against further disruption.
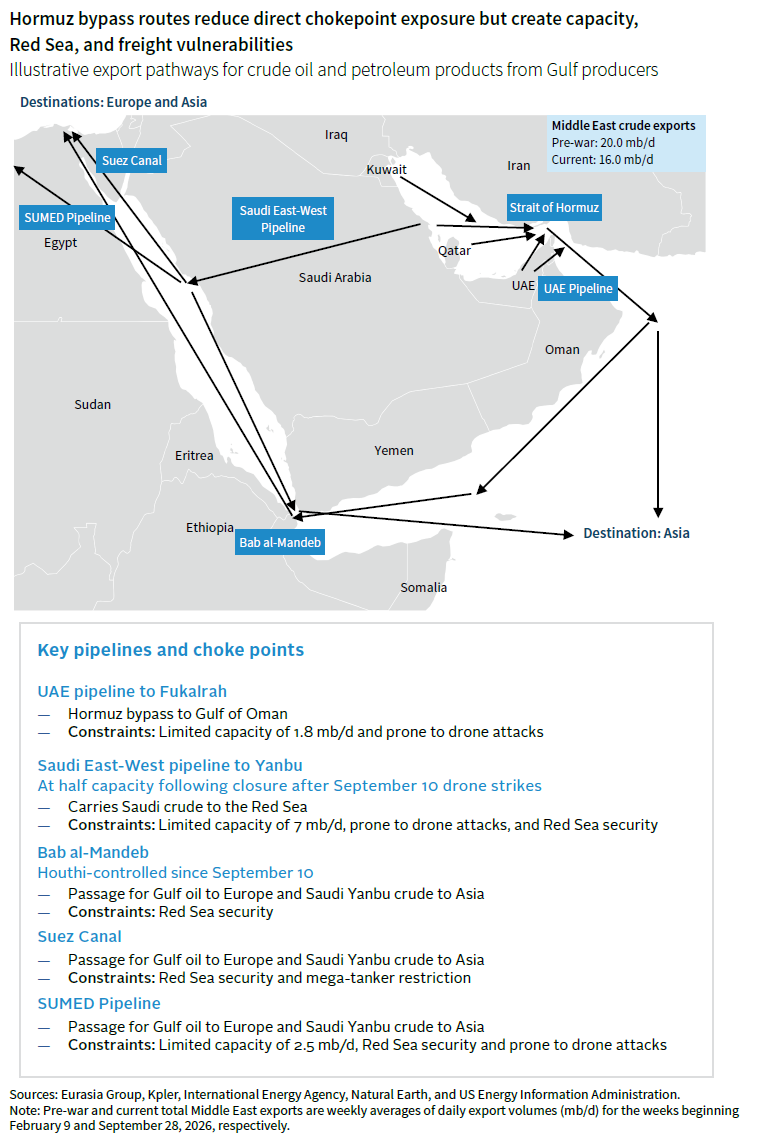
Some Gulf crude can bypass the Strait of Hormuz by pipeline, although capacity, operating conditions, and security limit those routes. Saudi Arabia’s East-West pipeline has carried more oil, but attacks have shown that it is also vulnerable. Qatari LNG has no comparable bypass, while Red Sea shipping faces its own security risks. Meanwhile, Chinese crude oil imports rebounded in July and August after their earlier decline helped absorb the initial supply shock. In its September report, the IEA forecasts that global oil supply would fall by nearly 6% in 2026, with a recovery in Gulf output deferred until 2027.
The sharpest constraint is in refined fuels. In August, Gulf exports of refined products and liquefied petroleum gas were 3.7 million barrels per day (mb/d), or nearly 60% below their pre-war level. Disruption to Russian refineries and product exports has added to the shortfall. Refiners elsewhere have increased output but cannot quickly replace the lost supply of diesel and other fuels. LNG faces its own transport constraints. Reduced flows through the Strait of Hormuz have tightened gas markets. LNG shipments increased in September but remained far below pre-war levels. European buyers have drawn flexible cargoes away from Asia. These pressures have pushed refined fuel and gas prices up more sharply than headline crude benchmarks.
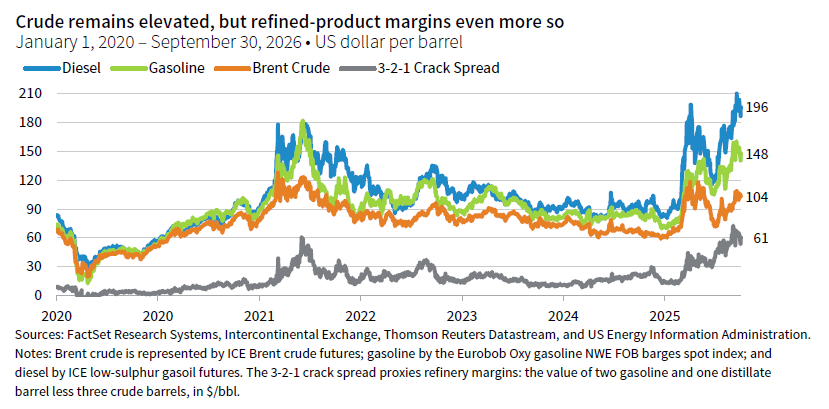
Inventories have absorbed much of the initial disruption, but further drawdowns would leave the system with even less capacity to absorb another shock. The IEA estimates that observed global oil stocks fell by 507 million barrels between February and August, equivalent to an average draw of 2.8 mb/d. Further damage to an export route, refinery, or LNG facility would therefore be harder to absorb without higher prices or lower consumption. The IEA already forecasts a 2.5 mb/d decline in oil demand this year—the largest annual decline since the 2020 pandemic.
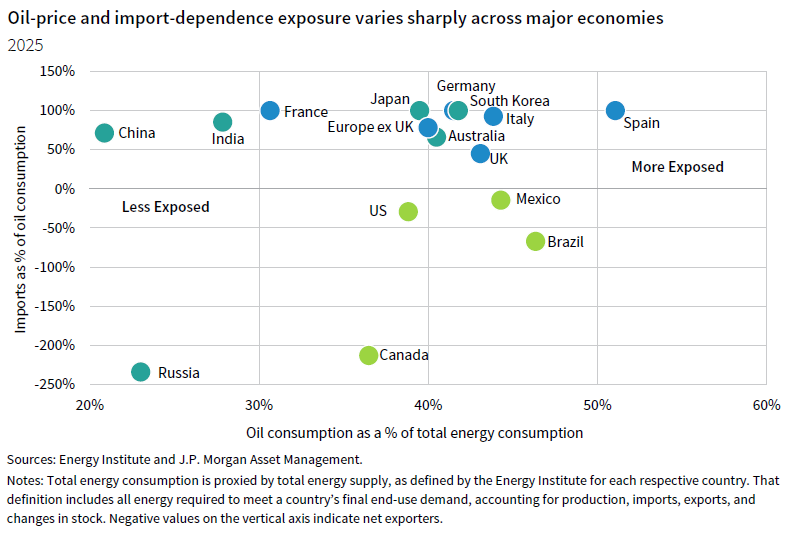
Greater domestic production gives the United States some protection from a physical import shortfall, but US consumers and businesses still face globally influenced crude and fuel prices. Elsewhere, import dependence, fuel subsidies, and available fiscal support shape how higher costs reach households and companies. Across regions, expensive diesel, gas, and freight can pressure margins and spending even if crude prices stabilize.
Over time, renewable generation supported by grids and storage can reduce the fuel required to produce electricity, limiting how far imported gas prices feed into power costs. Electrification can likewise reduce exposure to oil-price swings in transport, provided power supply expands alongside demand. These changes create investment opportunities in renewable power generation, transmission, and storage, though returns depend on project economics and valuations. They take years to scale and offer little immediate relief from shortages of diesel or LNG.
How energy stress spreads through the economy
The economic and market effects of the conflict will depend on its duration, breadth, and effect on energy flows.
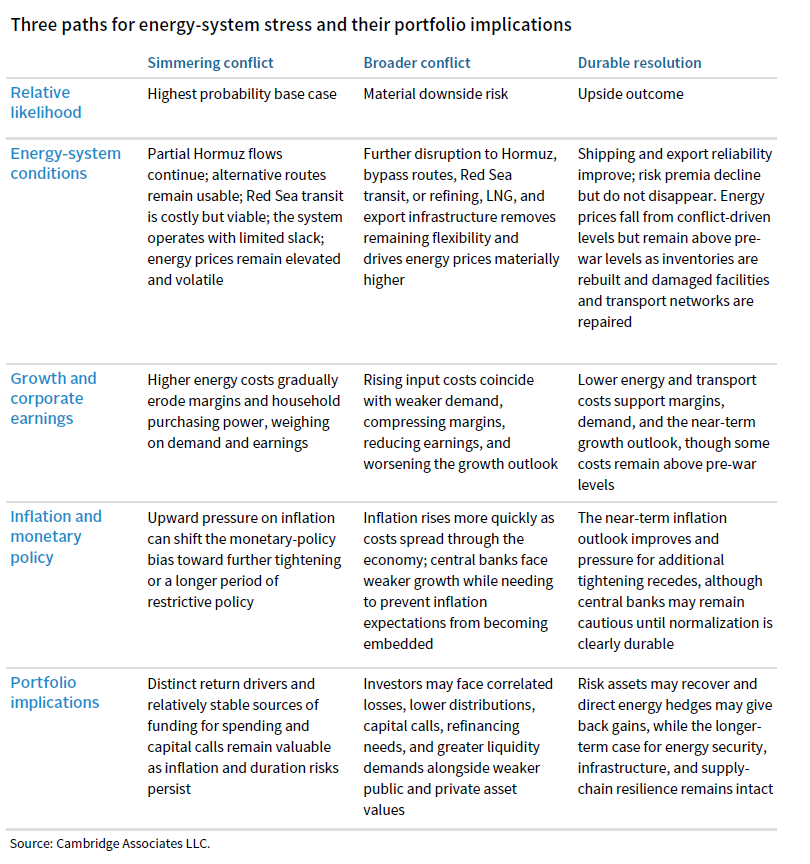
A simmering conflict would become less convincing if attacks caused sustained losses of the Strait of Hormuz traffic, bypass-route capacity, or refining and LNG exports while inventories continued to fall. A durable recovery in reliable commercial shipping, product exports, and inventories would point toward resolution. More ships passing through the Strait of Hormuz would not, by itself, show that crude, refined fuel, and LNG exports have returned to normal. Routes would need to remain reliable and inventories rebuild before the system could better withstand another disruption.
The three paths will not affect all economies alike. In the simmering conflict case, tight energy markets would gradually weigh on growth and keep inflation pressure elevated. The broader conflict case brings the greatest risk of simultaneous economic and financial stress. Oil-import dependence indicates exposure to higher prices, but currency regimes, subsidies, industry mix, foreign earnings, and fiscal capacity help determine whether costs show up in weaker demand, lower margins, currency depreciation, or broader inflation.
Higher costs for fuel, freight, electricity, and industrial inputs reduce purchasing power and pressure corporate margins. Fuel prices lift headline inflation quickly. If disruption persists, higher costs can spread into food, goods, and services, particularly where firms can pass them on or inflation expectations rise. Weaker economic demand may limit that pass-through. How widely inflation spreads will depend on the duration of the disruption and the strength of demand.
Central banks often look through a temporary supply shock because higher energy costs already restrain spending. However, the Federal Reserve, European Central Bank, and Bank of Japan have raised rates, and bond markets priced in further tightening. Policymakers may raise rates again or delay easing if price pressures broaden, even if growth weakens.
Fiscal policy can cushion households and businesses but may also add to price pressure. Governments may support households and businesses, replenish strategic stocks, increase defense spending, and invest in energy and transport resilience. Their capacity to do so varies, especially where debt-service costs and defense spending are rising. Support can sustain demand for scarce energy, while additional borrowing and investment place demands on financing and industrial capacity.
AI-related investment provides a partial offset to weaker growth in economies building data centers and power systems, as well as those supplying the equipment and materials they require. The investment simultaneously competes for electricity, construction capacity, and financing. Broader AI adoption could raise productivity over time, but the scale and timing of those gains remain uncertain.
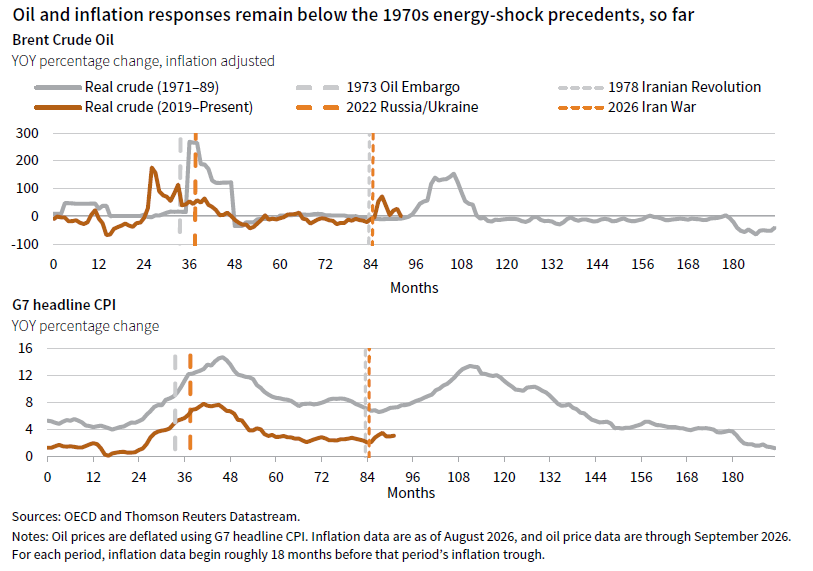
Historical episodes provide a useful frame for assessing energy shocks, but only limited guidance for the current setting. Economies use less energy per unit of output than they did in the 1970s and draw on more diverse energy sources. A prolonged disruption can keep inflation elevated, rates restrictive, and growth weak.
Diversification depends on how the conflict unfolds
The initial market response to the Iran War shows how differently assets can react to the same event. Over the 20 trading days following February 27, global equities fell 8.5%, while global energy equities gained 11.2% and broad commodities rose 23.5%. Global resource equities were slightly negative, gold fell sharply, and listed real estate declined by more than global equities. Global government bonds and US Treasuries also lost value, although less than equities. The simultaneous losses in equities, bonds, and listed real estate show why holding different asset classes did not necessarily provide protection from an inflation-led shock.
Global equities recovered their losses as negotiations sustained hopes of a near-term resolution and unusually strong earnings supported shares. The broad recovery concealed losses in exposed regional and industry markets. As of October 6, Gulf Cooperation Council (GCC) equities remained below their February 27 level, as did global shares of passenger airlines, airfreight and logistics companies, and hotels and cruise lines, for example.
As a prolonged simmering conflict has come into focus, markets have faced a different combination of risks. Brent crude rose above $100 per barrel in September, refined-fuel prices climbed more sharply, and interest rates moved higher. Sustained energy costs could weaken growth while keeping inflation elevated and monetary policy restrictive. Investors need to assess whether their portfolios are positioned to navigate through that combination of pressures.
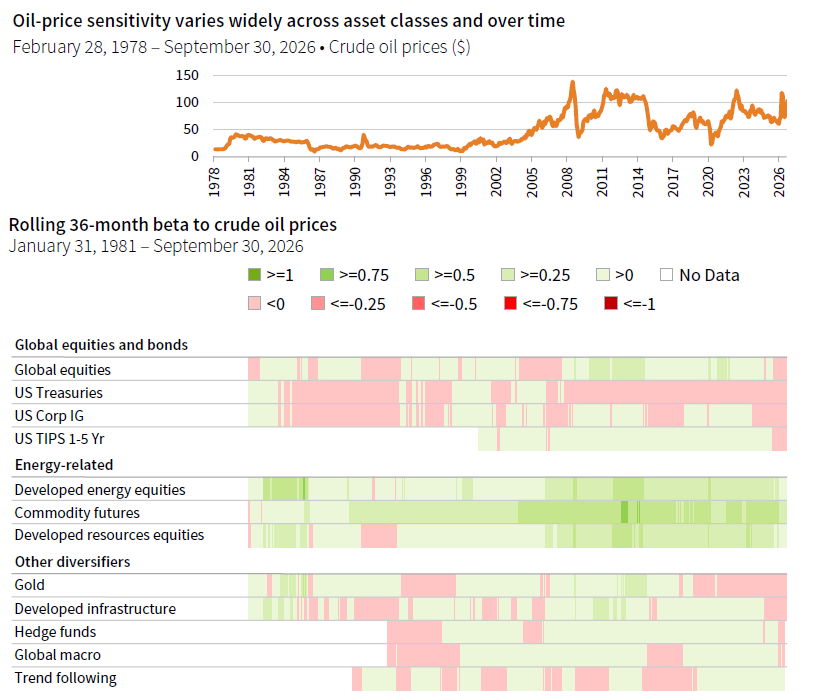
Notes: Asset classes are represented by: Global equities (MSCI All Country World Index), US Treasuries (Bloomberg US Treasury Index), US Investment Grade (Bloomberg US Investment Grade Index), US TIPs (Bloomberg US TIPs Index), Developed Energy Equities (Datastream Developed Energy Equities Index), Commodity futures (S&P GSCI Commodity Index), Developed resources equities (50/50 blend of Datastream Developed Energy Equities Index and Datastream Basic Resources Equities Index until 1998 and MSCI ACWI Commodity Producers Index thereafter), Gold (Datastream Gold Benchmark), Developed Infrastucture (Equal-weighted Datastream World Gas, Water & Multi-Utilities TR Index and the Datastream World Pipelines TR Index until 2009 and FTSE Developed Core Infrastructure 50/50 TR Index thereafter), Hedge Funds (HFRI Fund Weighted Composite Index), Global Macro (HFRI Macro Index), and Trend following (Barclay BTOP50 Index). Rolling 36-month betas to crude oil are through August 31, 2026, for hedge funds, global macro, and trend following as September returns are not yet available; all other betas are through September 30, 2026.
Investments with direct energy exposure have shown the most persistent positive sensitivity to crude oil prices, while Treasuries have generally shown a negative relationship. The sensitivities of other assets have varied. Oil price sensitivity, however, addresses only one part of the portfolio challenge. A fuller assessment considers assets’ longer-term sensitivity to inflation alongside their risk-adjusted returns.
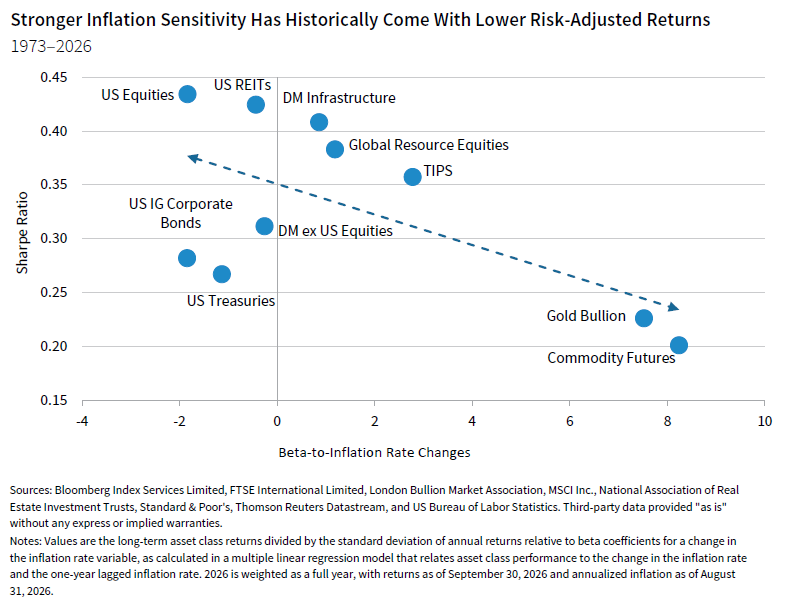
Stronger inflation sensitivity has often come at a cost to long-term, risk-adjusted returns. Commodity futures and gold can provide useful protection particularly in inflationary or supply-constrained environments, but their long-run, risk-adjusted returns have generally been weaker than those of conventional growth assets. Inflation-linked bonds offer more balanced inflation protection, although they remain vulnerable to rising real yields. These trade-offs should be weighed against a portfolio’s spending, capital call, and liability needs, particularly where those needs rise with energy prices or inflation.
Stress test assets and funding needs across conflict scenarios
Investors should assess what a portfolio may need to fund alongside how its assets may perform. Spending, capital calls, support for operating businesses, and financing obligations may continue or rise as asset values and distributions fall. This assessment should account for when payments are due, the currencies in which they must be made, available liquid assets, and other sources of funding.
In the simmering conflict base case, sustained energy and financing costs could gradually raise spending and other cash needs while weakening operating revenues. If these pressures last long enough, they could weaken demand enough to cause a recession without further escalation. A broader conflict would make that outcome more likely and could bring funding strains forward. A durable resolution could ease immediate demands but reverse gains in energy-sensitive holdings.
Funding capacity and overlapping exposures deserve attention in all three paths. Investors should identify which apparently distinct holdings, cash flows, and funding sources could weaken together, and which would remain available without forced sales. Direct energy positions are more contingent, offering support if disruption persists but giving back gains as flows normalize.
Reduce common exposures and diversify for resilience
Investors can strengthen portfolios without betting on the war’s next turn. They should reduce concentrations that could weaken together if inflation lifts rates, focusing on overlapping exposures across managers, weak balance sheets, and valuations that leave little room for disappointment. They should retain durable growth businesses whose earnings prospects and valuations support long-term wealth creation. The earlier inflation-sensitivity chart shows why new return drivers should be sized for their contribution to the whole portfolio, not their hedge sensitivity alone.
High-quality sovereign bonds remain important sources of liquid funding that can cushion portfolios when growth weakens. Persistent inflation, however, can push yields higher and bond prices lower. Short-duration bond strategies limit price sensitivity to rising yields and allow managers to reinvest maturing securities at higher rates. Inflation-linked sovereign bonds can help align assets with inflation-sensitive spending and liabilities. Although, they can still lose value when real yields rise, especially at longer maturities.
Floating-rate loans can earn more interest as rates rise, but that benefit can be overtaken by credit losses when borrowers’ financing and operating costs rise faster than revenues. Across public credit and direct lending managers, investors should examine vulnerability to higher rates, with particular attention to exposure to weaker-quality borrowers and highly leveraged loans made during the low-rate years earlier this decade. Some private equity–backed software businesses face an additional risk if AI undermines the growth assumptions behind their financing. Weakness in the same businesses could affect both private credit and private equity managers. Existing private holdings can be difficult to adjust quickly. Where exposures overlap, investors can consider trimming comparable public market positions and pacing future commitments around the risks they already hold.
Rising inflation and rates can pressure equities, particularly businesses whose valuations rest heavily on distant earnings. Managers focused on balance sheets, pricing power, and valuation may be better positioned over time. Value-oriented managers may have more exposure to businesses with near-term earnings, although the label alone does not establish how a portfolio will respond. Banks, for example, benefit from higher loan yields only if funding costs and credit losses do not offset the gains. Active managers can adjust exposures but cannot eliminate a market-wide inflation shock.
Diversification should address different horizons. Direct energy exposure and commodity futures can provide sensitivity to supply disruption and inflation, but they have already experienced a significant rally, and gains can reverse as energy flows normalize. Gold can diversify currency and confidence risks, yet its decline during the initial sell-off amid rising real yields and a reversal of retail investor flows argues against relying on gold exposure as a dependable energy-shock hedge.
Selected hedge fund managers can serve both funding and longer-term diversification needs. Some offer periodic redemptions that may help meet obligations, but investors should assess whether those terms and underlying holdings make the funds dependable sources of cash under stress. Strategies with limited equity and duration exposure can broaden the sources of return that support purchasing power over time, while equity long/short managers can seek returns on both sides of the book when stock returns diverge. Global macro and trend-following strategies that invest across a range of assets including commodities and currencies can offer a more flexible means of responding to changing market conditions. Their contribution depends on how managers combine signals, size positions, and adjust exposures as conditions change. Investors should assess redemption terms, underlying liquidity, and performance in stress before relying on any manager for funding or diversification.
Over a longer horizon, selected managers in resource-linked equities, infrastructure, and real estate may benefit from investment in scarce capacity and energy security. Power generation, grids, storage, and some non-energy infrastructure can offer distinct sources of return, while contractual inflation adjustments may support revenues. Renewable generation can reduce dependence on imported fossil fuels over time, although it cannot quickly replace constrained LNG or refined products. Some REIT holdings can benefit as rents reset, but higher financing costs, property expenses, and weaker demand often offset those gains. Manager underwriting, leverage, and underlying valuations are central to the case for these allocations.
Specialty strategies (e.g., litigation finance, insurance-linked securities, royalties) can add exposures with distinct return drivers. They are not perfect hedges and should not displace the liquidity role of high-quality sovereign bonds. Their role is to reduce reliance on cash and sovereign duration as the portfolio’s only sources of ballast.
The Iran War could pull currency risks in different directions. Escalation may initially support the US dollar as investors seek liquidity and higher oil-import bills weigh on the currencies of importing economies. The Fed’s recent tightening could reinforce that support if US interest rates rise relative to those abroad; tightening by other central banks would limit the advantage. If disruption persists, rates could rise enough to constrain AI-related investment, creating headwinds for US assets, particularly those with high valuations, long-dated earnings expectations, and high leverage. Most foreign investment inflows into the US have gone into equities, leaving the US dollar vulnerable to a potential equity correction if those inflows slow.
GCC Families: Diversifying the Wider Balance Sheet
-
-
- For GCC families, the same shock can reach investments, operating businesses, property, and sources of funding at once. Even families with global portfolios may depend on regional energy revenues and trade across their wider balance sheets. Higher oil prices may support some earnings and fiscal revenues; the net effect varies by family and country.
- Several GCC sovereign wealth funds already hold globally diversified portfolios, offering a regional precedent for long-term diversification. A written policy can give each allocation a role in growth, diversification, or protection against inflation and deflation, while setting rules for funding commitments and rebalancing. The mix should reflect business exposures, liabilities, and the purpose of the family’s investment pool.
- For families with substantial GCC-listed equities, portfolio losses could coincide with rising demands for support from regional businesses. Local equities are heavily weighted toward financials, with limited technology and healthcare exposure. Global equities can broaden access to those sectors and consumer businesses, adding earnings drivers shaped by innovation, aging-related healthcare demand, and spending across markets.
- Gold and funds held with local banks serve different roles. Gold need not rise during every crisis; bank balances can fund near-term obligations but share exposure to local bank stress. Where permitted under the family’s investment guidelines, hedge-fund strategies with limited equity and interest rate sensitivity may add distinct return drivers, provided their structures and redemption terms suit the family’s funding needs.
- Dollar pegs across much of the GCC reduce the currency mismatch between local liabilities and dollar assets. They do not determine the appropriate long-term currency mix. Families with substantial dollar exposure can diversify gradually across currencies and markets, guided by their liabilities, policy targets, and the risks of each allocation.
-
Investors should stress test their portfolios alongside the businesses and commitments those portfolios support, identifying where assets, liquidity reserves, liabilities, and currencies share exposure to energy and regional shocks. Reducing those shared exposures and diversifying across distinct return drivers can strengthen resilience without relying on a single hedge. Valuations, the cost of protection, and the expected effect on total portfolio returns should guide those changes.
Justin Hopfer and Graham Landrith also contributed to this publication.
Index Disclosures
Barclay BTOP50 Index
The Barclay BTOP50 Index seeks to represent the managed futures industry’s trading styles and market exposures. It selects large investable trading advisor programs by assets under management; the selected programs collectively represent at least 50% of investable assets in the Barclay CTA Universe each calendar year.
Bloomberg US Corporate Investment Grade Bond Index
Bloomberg US Corporate Investment Grade Bond Index measures the investment-grade, fixed-rate, taxable corporate bond market and includes USD-denominated securities issued by US and non-US industrial, utility, and financial issuers.
Bloomberg US TIPS Index
Bloomberg US TIPS Index is a rules-based, market value–weighted index tracking inflation-protected securities issued by the US Treasury.
Bloomberg US Treasury Index
Bloomberg US Treasury Index measures USD-denominated, fixed-rate nominal debt issued by the US Treasury. It includes securities with at least one year of remaining maturity and excludes Treasury bills and STRIPS.
Datastream Developed Basic Resources Index
Datastream Developed Basic Resources Index is combined with the Datastream Developed Energy Index in a market-capitalization weighted historical global resource equities series for 1973–98.
Datastream Developed Energy Index
Datastream Developed Energy Index is combined with the Datastream Developed Basic Resources Index in the market-capitalization weighted historical global resource equities series for 1973–98.
Datastream World Gas, Water & Multi-Utilities TR Index
Cambridge Associates (CA) uses this index as one half of an equally weighted developed markets (DM) infrastructure series, alongside the Datastream World Pipelines TR Index, for 1973–2009.
Datastream World Pipelines TR Index
CA uses this index as the other half of the equally weighted DM infrastructure series for 1973–2009.
FTSE Developed Core Infrastructure 50/50 TR Index
FTSE Developed Core Infrastructure 50/50 TR Index tracks DM core infrastructure companies with sector weights adjusted at semiannual reviews toward 50% utilities, 30% transportation, and 20% other infrastructure sectors.
HFRI Fund Weighted Composite Index
The HFRI Fund-Weighted Composite Index is an equal-weighted global index of single-manager hedge funds reporting monthly US dollar performance net of fees to the HFR database. Constituent funds must have at least $50 million under management or a 12-month active track record; it excludes funds of hedge funds.
HFRI Macro (Total) Index
HFRI Macro (Total) Index is composed of macro managers whose strategies are based on movements in economic variables and their effects on equity, fixed-income, currency, and commodity markets.
MSCI ACWI Commodity Producers Index
MSCI ACWI Commodity Producers Index captures listed commodity producers in the energy, metals, and agricultural sectors, selected from the MSCI ACWI large- and mid-cap equity universe. Cambridge Associates uses it for the 1999–2025 portion of a historical global resource equities series.
MSCI All Country World Index (ACWI)
The MSCI ACWI captures large- and mid-cap representation across 23 developed markets (DM) and 24 emerging markets (EM) countries. With 2,558 constituents, the index covers approximately 85% of the global investable equity opportunity set. DM countries include Australia, Austria, Belgium, Canada, Denmark, Finland, France, Germany, Hong Kong, Ireland, Israel, Italy, Japan, the Netherlands, New Zealand, Norway, Portugal, Singapore, Spain, Sweden, Switzerland, the United Kingdom, and the United States. EM countries include Brazil, Chile, China, Colombia, Czech Republic, Egypt, Greece, Hungary, India, Indonesia, Korea, Kuwait, Malaysia, Mexico, Peru, the Philippines, Poland, Qatar, Saudi Arabia, South Africa, Taiwan, Thailand, Turkey, and the United Arab Emirates.
S&P GSCI™ Commodity Index
S&P GSCI™ Commodity Index is a broad, production-weighted commodity-futures benchmark designed to represent global commodity-market exposure using liquid futures contracts.
Celia Dallas - Celia Dallas is the Chief Investment Strategist and a Partner at Cambridge Associates.
About Cambridge Associates
Cambridge Associates is a global investment firm with 50+ years of institutional investing experience. The firm aims to help pension plans, endowments & foundations, healthcare systems, and private clients achieve their investment goals and maximize their impact on the world. Cambridge Associates delivers a range of services, including outsourced CIO, non-discretionary portfolio management, staff extension and alternative asset class mandates. Contact us today.