VantagePoint: Second Quarter 2019

This edition of VantagePoint addresses five key implementation questions as a follow up to our recent report, “The Case for Dedicated China Exposure.”
- Should investors implement through public or private equities?
- What are the best public equity implementation options?
- Should investors be concerned about The Committee on Foreign Investment in the United States’ (CFIUS) expanding oversight over cross-border investments?
- How do investors measure China portfolio exposure?
- How much should investors allocate to China?
We find attractive investments in private and public equity markets. Private investments (especially venture investments in healthcare) and long-only public equities offer the most appeal today. All-China and A-share mandates are both attractive, with All-China offering active managers a bigger canvas, at the expense of more complexity. A handful of dedicated China long/short hedge funds are appealing and have credible track records, however shorting limitations in the A-share market may boost the relative appeal of regional hedge funds. We do not think that investors should steer clear of Chinese venture capital and private equity as a result of recent changes in the US regulatory environment (e.g., FIRRMA), but rather they should assess how (if at all) these laws will influence the opportunity set for managers.
There is no single answer for how much investors should allocate to China, but 5% to 10% of the total portfolio seems reasonable, based on the investible opportunity set and the attractive market environment. Included in this calculus is an understanding of the portfolio’s current China exposure, both direct and indirect.
Much Ado about China. Our recent report, “The Case for Dedicated China Exposure,” argued that investors should take a systematic and comprehensive approach to investing in China, overweighting Chinese assets relative to their index weights. Over the intervening weeks, we have received many thoughtful questions regarding implementation decisions. In this edition of VantagePoint, we address the five most commonly asked implementation questions.
- Should investors implement through public or private equities?
- What are the best public equity implementation options? All-China versus A-share? Long only versus long/short?
- Should investors be concerned about the impact of The Committee on Foreign Investment in the United States’ (CFIUS) expanding oversight over cross-border investments?
- How do investors measure China portfolio exposure?
- How much should investors allocate to China?
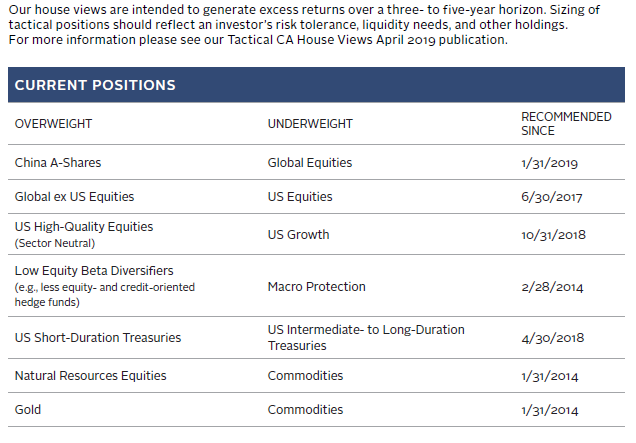
OVERVIEW OF TACTICAL CA HOUSE VIEWS
March 29, 2019
Public or Private Equities?
Private investing in China, particularly venture capital, has certainly been the investment of choice in China since the market began to open to foreign investors. Private investment returns have been quite strong in absolute terms and relative to US and European peers, while public equity returns have been more lackluster and volatile. Why, then, should investors consider public equities?
Public and private investments in China can both be additive to portfolios today. Public equities provide a diversified and broad opportunity set of companies at attractive valuations and the potential to add value through active management in an inefficient market. By participating in private markets, investors can tap skilled managers to concentrate investments in some of the highest growth areas, including healthcare, technology, and consumer sectors. Such managers also provide diversification to global private equity and venture capital portfolios, which tend to be US-centric.
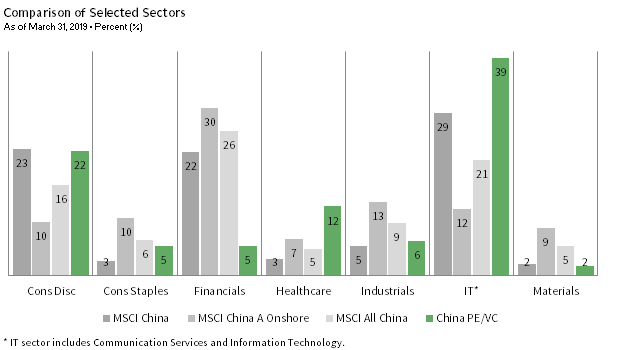
PUBLIC EQUITIES MORE DIVERSIFIED; PRIVATE EQUITIES FOCUSED ON NEW ECONOMY
Sources: Cambridge Associates LLC, FactSet Research Systems, and MSCI Inc. MSCI data provided “as is” without any express or implied warranties.
Notes: “China PE/VC” is represented by the Cambridge Associates China Private Equity and Venture Capital Benchmark, which includes the following asset classes/strategies: venture capital, growth equity, and buyout. China PE/VC data are based on unrealized investments made between January 1, 2008, and September 30, 2018. Totals may not add up to 100% due to rounding. Energy, real estate, and utilities sectors are not included for scaling purposes. The China PE/VC allocations to those sectors are 1%, 5%, and 0%, respectively. Allocations to those sectors for the three public markets indexes range from 2%–5%, 5%–6%, and 2%-3%, respectively.
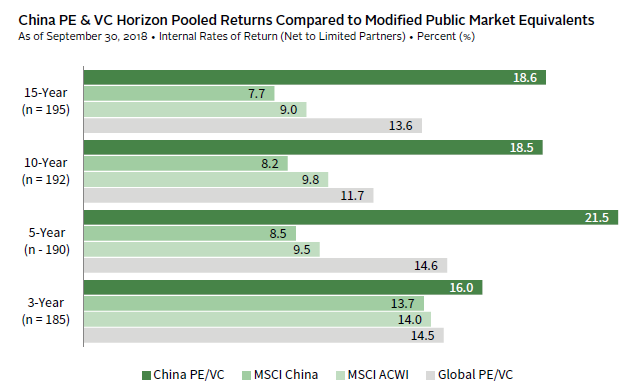
Chinese private equity and venture capital (PE/VC) funds have created significant value for investors, with total value–to–paid-in multiples of 2.0x for vintage years 2004–15. 1 These multiples compare favorably to those of US (1.7x) and European (1.5x) funds over the same period. Investors might argue that China’s private investments have achieved higher returns because they take greater risks, but this does not seem to be the case. Indeed, across all PE/VC investments made between 2004 and 2015 that are tracked in our database, Chinese investments have had comparable loss ratios and impairment ratios, but lower leverage relative to US and European peers. 2 China PE/VC funds have also added significant value relative to Chinese and global public market equivalents over the past five-, ten-, and 15-year periods.
CHINESE PE & VC HAVE ADDED VALUE TO PUBLIC MARKET EQUIVALENTS
Sources: Cambridge Associates LLC, MSCI Inc., and Thomson Reuters Datastream. MSCI data provided “as is” without any express or implied warranties.
Notes: Both China and Global PE/VC are represented by Cambridge Associates benchmarks, which include the following asset classes/strategies: venture capital, growth equity, and buyout. The number of funds and CA Modified Public Market Equivalents (mPME) correspond with the China PE /VC benchmark. Pooled horizon returns are net of fees, expenses, and carried interest. mPME returns replicate private investment performance under public market conditions. The public index’s shares are purchased and sold according to the private fund cash flow schedule, with distributions calculated in the same proportion as the private fund, and mPME NAV is a function of mPME cash flows and public index returns. Total returns for MSCI China and MSCI All Country World (ACWI) are gross of dividend withholding taxes. MSCI China is being used rather than the MSCI China A or All China universes because of the longer history and because MSCI China represents the market available to foreign investors, which until recently has been limited to the offshore market and ADR listings on foreign exchanges.
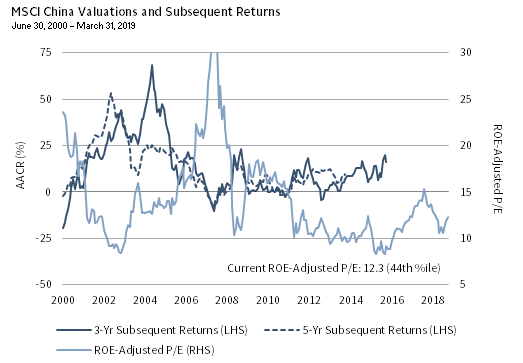
Valuations have been one driving factor behind the degree of public market underperformance, particularly for Chinese public equities. Although the history is short, periods when starting valuations were particularly high, such as 2000 and 2007–08, have been associated with poor subsequent three-year and five-year returns. Current valuations for listed Chinese shares speak well for prospective returns, although the strong market recovery since the start of this year has moved the public equity market from fire-sale prices to good value.
VALUATIONS MATTER FOR CHINESE PUBLIC EQUITIES
Sources: MSCI Inc. and Thomson Reuters Datastream. MSCI data provided “as is” without any express or implied warranties.
Note: Total returns are gross of dividend withholding taxes.
Starting valuations have a less direct impact on private investments because a fund’s manager invests and distributes capital over many years. While high valuations raise entry prices for some funds, the exit market may be particularly robust for older funds in the portfolio. Indeed, a comparison of US public market equivalents with the long history of US private equity returns reveals there have been only rare instances when privates underperform public market equivalents, especially when looking at the broad market and top quartile managers. From 1993 to 2015, 3 relative to the Russell 3000® public market equivalent, our US venture capital benchmark has underperformed in only 30% of vintage years and our growth equity and buyout benchmark, less than 5% of the time. The median fund 4 has fared much worse relative to public markets in venture capital, but only marginally worse in private equity. For those with adequate selection skill, the top quartile underperformed during just two vintage years (2000 and 2002, during the bursting of the tech and telecom bubble) in US venture capital and never underperformed in US growth equity and buyouts.
Investors in Chinese PE/VC have benefited from a wave of innovation and development, so it is logical to ask if it is too late today to invest in these markets and gain outsized returns. Investors must reassess the environment on an ongoing basis to evaluate investment themes, the manager landscape, and the market environment as current investment themes mature and new ones develop. However, several investment themes seem far from saturation and offer the potential for continued strong returns: healthcare, mobile internet, and investments related to serving changing consumption patterns.
Most prominent among these today is healthcare. Healthcare is an important sector in China that is undergoing rapid change. Consumer demand for healthcare is on the rise and underserved, while the domestic regulatory environment has become far more positive in recent years. The sector’s attractiveness has spurred growth in the manager universe, including specialist private healthcare funds. More funds mean more opportunities for investors, but the influx of capital has also pushed up deal pricing, so we favor early-stage managers that operate in a less competitive space and should also benefit from the ample capital available for later stage deals.
Public and private Chinese equities both present attractive investment opportunities today. Public equity index exposure is diversified and complements private investments. When implementing active listed equity managers, investors should be aware that some exclude or limit exposure to the more cyclical segments of the Chinese equity market, and these sectors will outperform when economic activity surprises to the upside. Within venture capital, we favor the healthcare sector, and given generally high (although moderating) valuations, we prefer early-stage managers that offer better value at this stage of the cycle. We’d only selectively invest in mid- to late-stage managers. Given expensive private equity valuations and slowing growth, we favor growth equity managers that specialize—by deal type or by sector—as the market matures and differentiation matters more to the execution of deals.
What Are the Best Public Market Equity Investment Options?
First, some background is necessary. The Chinese public equity market is vast, with equities listed onshore on the Shenzhen and Shanghai exchanges, as well as offshore in Hong Kong, the United States, Europe, and Singapore. The more than 2,000 Chinese public stocks amount to US$9.6 trillion at full float. 5 Free-float limitations restrict investor access to just 37.3% of the onshore A-share market, and 42.6% of the broad (onshore and offshore) Chinese equity market. Foreign ownership restrictions limit investor access to A-shares further still. In total, the share of Chinese stock market capitalization accessible to foreign investors accounts for 6.0% of global equities and 43.8% of emerging markets equities, making China the third largest equity market in the world (behind the United States and Japan).
Most Chinese equities in global equity benchmarks are listed offshore. The Stock Connect programs and other reforms have greatly improved access to Chinese onshore A-shares, so index providers are gradually incorporating A-shares into market benchmarks. At full float, Chinese A-shares represent 81% of the companies and 64% of the market capitalization of Chinese public stocks. After adjusting for free float, China A-shares account for 24% of the Chinese equity market, and after adjusting for investability, 15%. However, at present, Chinese A-shares account for just 0.1% of the MSCI ACWI, 0.8% of the MSCI EM, and 2.5% of the MSCI China indexes. MSCI estimates that the planned increase in their inclusion factor will result in A-shares increasing to 0.4% of the MSCI ACWI, 3.3% of the MSCI EM, and 10.1% of the MSCI China indexes by the end of this year. 6
China equity mandates have been evolving as access to China’s vast equity market improves. More than a decade ago, Greater China mandates were common. Such managers focused on Hong Kong– and Taiwan-listed companies. Managers focused on offshore China mandates have increasingly shifted to companies incorporated in mainland China, but listed on HK and US exchanges. The MSCI China Index focuses on such securities and has become the benchmark of choice for such mandates. Now that MSCI is including A-shares in the MSCI China Index (albeit with a tiny initial weight), lines between onshore and offshore mandates are beginning to blur. However, it will take time for these distinctions to disappear. The opening and development of the onshore market will drive the pace of change. In this report we highlight two main long-only categories: All-China mandates, including onshore and offshore companies that provide investors with the broadest China universe, and dedicated China A-share manager mandates. The China-dedicated long/short equity manager universe is also developing, as shorting capabilities expand within the onshore market; this merits watching.
A-Shares or All-China?
The MSCI All China Index market capitalization is composed of about 51% onshore listed stocks, 36% Hong Kong-listed stocks, and 13% US-listed stocks, so the All-China and A-share indexes overlap, and the distinction between the two will fade over time. Indeed, managers that launched A-share-only mandates years ago are now updating their prospectuses to allow investment in offshore China stocks, while offshore China strategies are adapting to include A-share investments.
Both mandates provide a means for investors to improve portfolio diversification and offer significant exposure to the A-share market that is missing from most portfolios today. The main considerations when choosing between these mandates relate to diversification benefits, volatility, alpha potential, exposure to dynamic “new China” sectors, and implementation complexity.
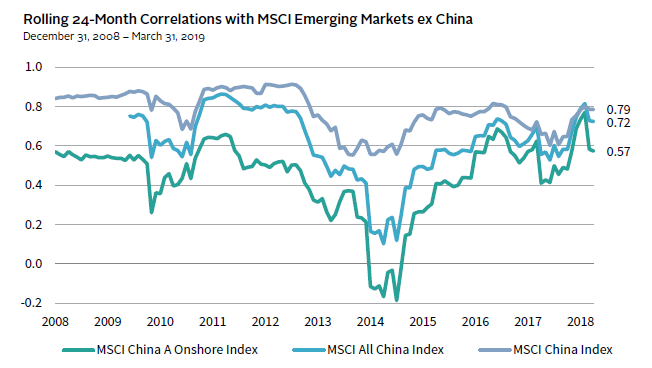
China A-share and All-China mandates provide diversification benefits to portfolios. China A-share correlations have been persistently lower than MSCI All-China correlations relative to global equities. The source of diversification benefits goes beyond the fact that A-shares are minimally included in the MSCI EM Index. If we exclude all Chinese stocks by looking at correlations of the two China indexes to the MSCI EM ex China Index, A-share index correlations remain lower than All-China index correlations. However, both mandates offer greater diversification benefits than MSCI China (i.e., the China sub-index of MSCI EM that is concentrated in offshore Chinese stocks).
CHINA A-SHARES OFFER DIVERSIFICATION TO EQUITY PORTFOLIOS
Sources: MSCI Inc. and Thomson Reuters Datastream. MSCI data provided “as is” without any express or implied warranties.
Notes: Correlations are based on monthly total returns, net of dividend withholding taxes. Data for MSCI All China Index begin May 31, 2010.
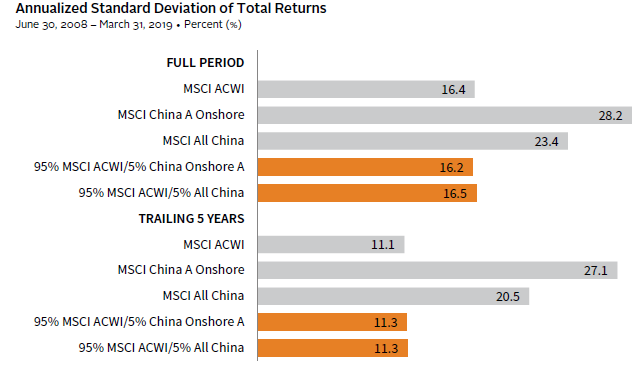
The slightly greater diversification offered by China A-shares offsets its relatively higher volatility when compared to All-China mandates. The volatility of a portfolio with 95% global equities and 5% China is similar, whether the China exposure is to China A-shares or All-China equities.
A-SHARE DIVERSIFICATION BENEFITS OFFSET HIGHER VOLATILITY AT PORTFOLIO LEVEL
Sources: MSCI Inc. and Thomson Reuters Datastream. MSCI data provided “as is” without any express or implied warranties.
Note: Correlations are based on monthly total returns, net of dividend withholding taxes.
Perhaps the greatest benefit of adding dedicated A-share or All-China equity mandates is the alpha potential. Of the more than three dozen China A-share managers that reported performance to eVestment five years ago, 65% continued to report returns throughout the five-year period and 55% outperformed their stated benchmark net of fees. The database attrition rate is relatively high when compared to some other manager universes such as emerging markets (82% continued reporting) and US large caps (77% continued reporting), but a success rate of 55% is quite high—comparable to emerging markets on the whole, where 52% outperformed net of fees, and well above US large-cap managers’ 16% success rate. In performing due diligence on managers, investors should emphasize the importance of organizational stability, as highlighted by the high level of A-share manager attrition. Some of the biggest investor concerns about the A-share market—high volatility, large share of state-owned enterprises (SOEs), and relatively low exposure to tech-related companies—are also the most likely sources of manager alpha.
The A-share market’s volatility stems from its retail-driven nature, with retail investors comprising an estimated 80% of turnover. We believe that the scarcity of domestic institutional investors results in greater market inefficiency and dispersion than seen in other markets, and may boost opportunities for highly skilled active managers. As institutional investment increases, managers’ ability to add alpha may decrease, but this will take time.
The A-share market’s relatively high allocation to SOEs and “old economy” sectors offers another potential source of alpha. Investors seeking exposure to “new economy” consumer and tech sectors might not give A-shares a second look. However, for every company managed without a shareholder-value focus or occupying an unattractive sector, there are also plenty of desirable holdings in increasingly attractive sectors (e.g., consumer staples and healthcare). Managers that can differentiate between the two may be able to add alpha. Furthermore, managers can add value by identifying companies with improving governance before the market reassesses these value opportunities. However, the A-share market lacks exposure to China’s tech giants, such as Tencent and Alibaba, that have turbo-charged index returns in recent years.
SOEs account for 43% of market capitalization of A-share stocks. Firms totaling an additional 19% of market capitalization have both private and government shareholders, with no clear controlling ownership. These companies may effectively be SOEs. Market concentration in SOEs has been falling across all industries since the mid-2000s and is concentrated within five sectors: energy, materials, telecommunications, utilities, and industrials. By contrast, consumer staples, healthcare, and tech sectors are far less SOE-centric. Further, according to research by investment manager Matthews Asia, a large number of China A-share companies are “value creators,” which they define as non-financial companies that generate a five-year average return on invested capital greater than their cost of capital. As of September 2017, 971 A-share companies with at least US$100 million in market capitalization created value for investors. While this is just 30% of China A-share companies, the number of value creating companies compares favorably to Chinese offshore equities, as well as many other emerging and Asian developed markets.
Both A-share and All-China managers have the opportunity to add value to portfolios through diversification and manager alpha. Indeed, there is considerable overlap between the two. All-China mandates have an additional potential advantage from having a wider canvas of companies from which to choose and from exploiting divergences between H-shares and A-shares, as many companies are listed on both the Hong Kong and mainland China exchanges. The trade-off is that adoption of All-China allocations involves more complexity, since the mandate overlaps with existing global emerging markets (GEM) managers and regional Asia managers. The overlap for A-share mandates is likely to be limited, as A-shares are largely absent from GEM managers and regional Asia benchmarks, although we have seen some GEM managers embrace A-share investments ahead of the index providers. More generally, if China continues to open its market over the coming years, the distinction between onshore and offshore should dissipate with both the market and index shifting toward an All-China approach. All-China mandates offer managers the most flexibility in implementing China long-only public equity allocations.
Long Only or Long/Short?
Conceptually, long/short equity investing should be attractive in a volatile and inefficient market like China A-shares. However, the onshore short-selling market is not well developed. As a result, China long/short managers tend to focus on the offshore market where the securities lending and short-selling market is highly developed and affordable. Those managers that include A-share listings do so in the long book, using indexes or onshore shares on the short side.
Investors were permitted to short a limited number of A-shares starting in April 2010. However, after the 2015 market crash, the China Securities Regulatory Commission was suspicious that short-sellers were manipulating the market and introduced curbs limiting securities lending to large companies. Hedge fund managers in the region expect that the growing inclusion of A-shares in MSCI’s flagship indexes will help grow the lending pool and improve the ability to short a wider variety of securities in scale and at a reasonable cost. 7 China’s derivative market is gradually broadening and deepening, and the question for investors is more about when, rather than if, the market will mature to a point where managers can easily short in size at low cost.
These challenges have limited the list of institutional-quality long/short hedge funds with credible All-China track records. The hedge fund manager environment is just starting to mature, with a handful spinning out from established firms. Chinese hedge funds provide a reasonable way to gain exposure to Chinese equities on a hedged basis, as some managers have demonstrated ability to outperform long-only China managers, and do so with less volatility, but the focus remains primarily on the offshore market. The best way for many investors to use hedge funds in China may be through well-established, Asia-focused long/short managers, especially since many investors have little hedge fund exposure to the region as a whole.
Is CFIUS a Game Changer for Chinese PE/VC?
Recent regulatory developments designed to protect US intellectual property in security- related industries could impact some private investments in China. We do not think that investors should steer clear of PE/VC because of these changes, but they should assess how (if at all) these laws will influence the opportunity set for managers.
In August 2018, the Foreign Investment Risk Review Modernization Act of 2018 (FIRRMA) was signed into law. FIRRMA gives CFIUS an expanded role in reviewing foreign investment in US “critical technology” and “critical infrastructure.” FIRRMA’s final regulations are not expected until later this year or early next year; however, interim regulations established a CFIUS “pilot program” focused on 27 industries, including US biotech, semiconductors, nanotechnology, and computer storage device manufacturing.
The full impact of FIRRMA remains to be seen, but will certainly involve a mandatory filing requirement, and could also prohibit some foreign investments. In a related action, the Export Control Reform Act of 2018 requires certain federal agencies to assess the licensing requirements on US exports. The review, expected in May, is generally seen as focused on China, and could result in tighter controls and licensing requirements on US exports to China. Therefore, when investing in Chinese PE/VC firms, we would exercise caution in investing in managers narrowly focused on cross-border investment in US technology in the critical industries.
How Much China Exposure Do You Have?
Most investors have not traditionally tracked their exposure to China on a look-through basis across the total portfolio. However, with Chinese markets opening, investors should consider China as a separate market, like the United States, Japan, and the United Kingdom. As with any country or region, implementing a mix of dedicated China managers along with managers that have flexibility to dial up or dial down China exposure complicates investors’ ability to manage to a particular target allocation. An additional complication is that China has significant influence on the global economy and global investments. We would not be overly precise about measuring these indirect exposures; rather, the intent is to understand the aggregate sensitivity of the portfolio to China, to determine how investors might fund dedicated China allocations, and to assess whether investors are over- or underexposed to the country.
With regard to capital allocations, as China’s share of market capitalization in emerging markets benchmarks increases, China may ultimately spin out and emerging markets ex China may become a mandate, but today China is embedded within most global emerging markets mandates, and investors must consider the overlap. There are two main reasons to monitor portfolio allocations. The first is for periodic rebalancing purposes and the second is for risk management when exposures become extreme (in either direction).
With regard to rebalancing, a simple and helpful way to measure China allocations of managers using broad mandates is to consider only the China weight in their benchmarks. From a practical standpoint, we use active managers because we want them to make active decisions that add value to portfolios. If you include manager overweights and underweights relative to benchmarks in your ongoing monitoring of allocations for the purposes of rebalancing, you may end up offsetting allocation decisions that you have paid managers to make. We would, however, consider managers’ structural underweights or overweights to China, particularly if they are more a reflection of a managers’ strategy rather than reflective of a view. For example, active managers tend to hold more equal-weighted portfolios of stocks relative to market cap–weighted indexes, resulting in underweights to the largest index components (i.e., stocks, countries, and regions). We see this in global equity manager underweights to US equities and mid- to large-cap managers’ underweights to the largest stocks in their benchmarks. Interestingly, this has not been a universal practice for GEM managers and their China allocations.
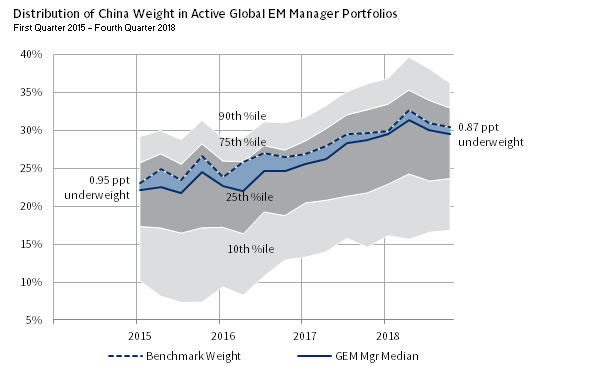
GLOBAL EM MANAGERS MAINTAIN SLIGHT UNDERWEIGHTS TO CHINA ON AVERAGE
Source: eVestment.
Notes: The benchmark is represented by the MSCI EM Index. China weights include Chinese companies that are listed on international stock markets.
While the median GEM manager in the eVestment database has been underweight China relative to the MSCI EM Index, the difference has been small and has decreased as the benchmark weight to China has grown. This may be a result of the investable opportunity set opening faster than reflected in the benchmarks. We see some anecdotal evidence of this in managers we track closely, as some have been increasing their exposure to Chinese A-shares ahead of the index inclusion ramp-up. Over time, GEM managers may underweight China more significantly, so this merits watching. From a risk management perspective, we would monitor total allocations for the purpose of understanding if exposure were to get uncomfortably low or high as might happen if multiple managers were to heavily overweight China in a portfolio that already had significant exposure.
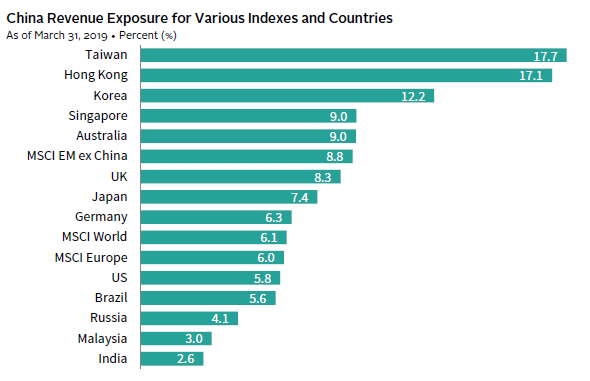
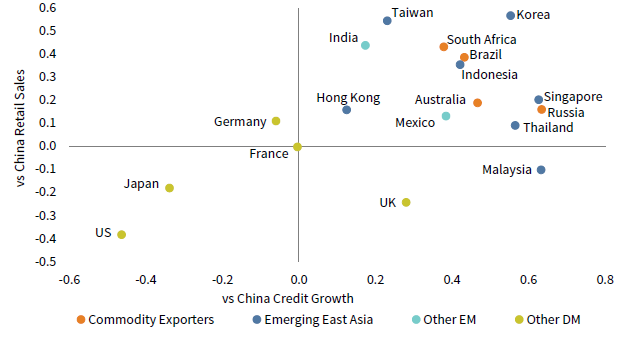
When thinking about where to set portfolio targets in the first place, considering indirect exposures is useful. Within global equity markets, while the index share of Chinese companies is just 3.9%, the revenue exposure is 9.5%. Unsurprisingly, countries tied closely to China through supply chains, commodities, and industrial equipment imports also have the highest revenue share. Similarly, such countries’ equity markets tend to have the most sensitivity to changes in Chinese leverage. The following chart shows the correlation between these Chinese economic indicators and the performance of various countries’ equity markets relative to the broad equity market. The countries in the upper right quadrant are most sensitive to increases in credit growth and increases in retail sales growth, with their equity markets tending to outperform during periods of stronger growth and lag during periods of weaker growth. When setting China targets, investors should consider the impact of heavy allocations to these Asian equity and commodity-driven markets, which could also serve as a funding source for dedicated China allocations, while recognizing that these relationships may change over time, as China continues to focus more on developing a stronger consumer base and de-emphasizing the industrial sector. Changes in trade agreements may also shift this landscape.
GLOBAL EQUITIES OUTSIDE OF CHINA ALSO HAVE CHINESE EXPOSURE
Correlations: MSCI Country Index Returns vs China Economic Indicators
March 31, 2010 – February 28, 2019
Sources: BCA Research Inc., MSCI Inc., National Bureau of Statistics of China, People’s Bank of China, and Thomson Reuters Datastream. MSCI data provided “as is” without any express or implied warranties.
Notes: In the bottom chart, China credit growth is the de-trended stock of total social financing less equity issuance and includes all local government bonds. Retail sales are also de-trended. MSCI country index returns are trailing 12-month total returns, gross of dividend withholding taxes, and are in USD terms.
How Much China Is Appropriate?
As you might imagine, there is no right answer to this question. We approach the issue using a three-step process. First, consider the scale of the China investment opportunity set as a percentage of various markets in which you invest. Second, measure what you already own, as discussed previously. Third, determine how different you are willing to look relative to peers and benchmarks. Based on such analysis, we expect that 5%–10% would be a reasonable China allocation for most investors.
We always start with the question of what is neutral based on the market consensus—how has the market allocated capital as reflected in market benchmarks. The following chart provides a high-level overview of current and potential index weights.
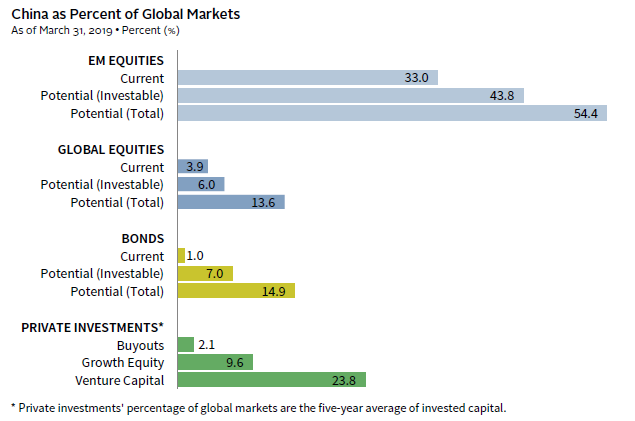
CHINA IS UNDER-REPRESENTED IN GLOBAL BENCHMARKS
Sources: Bloomberg Index Services Limited, FactSet Research Systems, MSCI Inc., PitchBook, and Thomson Reuters Datastream. MSCI data provided “as is” without any express or implied warranties.
Notes: Potential (Investable) weight of China bond market is based on the Bloomberg Barclays Policy Bank + Government Bond Index and the current China subset of the Bloomberg Barclays Global Aggregate Bond Index. Potential (Total) weight of China bond market is based on the market capitalization of ChinaBond New Composite Index, which is as of February 28, 2019. Potential (Investable) weight of China equity market is based on the sum of free-float market capitalization of MSCI China Index and MSCI China A International Index. Potential (Total) weight of China equity market is based on the full-float market capitalization of MSCI All China Index. Private Investments data are based on trailing 5-year annual averages through December 31, 2018.
As discussed earlier, the investible China universe is underrepresented in many benchmarks. In terms of public equities, MSCI estimates that combining onshore and offshore equities and taking into account free float and foreign ownership limitations would translate to about a 6.0% share of global public equities or a maximum of 15% if we ignored these limitations. Today, 6.0% is a reasonable approximation, although index weights should gradually increase provided Chinese policy makers move forward with their stated ambitions to open up markets over time.
Within fixed income, RMB-denominated bonds just made it to the big time, with the ubiquitous Bloomberg Barclays indexes phasing RMB bonds into their flagship Global Aggregate Bond Index starting this month. By December 2020, RMB-denominated bonds could represent 7.0% of the index. If RMB-denominated bonds were fully included in the global market benchmark, they would account for about 15% of the market today. For now, the index provider believes that only central government and policy bank bonds have sufficient liquidity and quality to include in the indexes. Growth-oriented investors need not rush to own these bonds today, as current bond yields offer little buffer against further RMB depreciation, while hedging costs may reduce returns, especially for non-USD–based investors. However, investors may obtain access to this market via certain global and emerging markets bond managers. As for credits, we see pockets of opportunities in both onshore and offshore credit, but prefer to address these opportunities through lock-up managers. Implementation options on a pure-play China basis are limited, making Asia private credit strategies the best option.
China accounts for a higher share of global venture capital and growth equity investments than other asset classes. Over the last five years, China has accounted for an average of 24% of investments in venture capital and 10% of investments in growth equity globally. Regarding buyouts, the share of global investments in China is only 2%, as the buyout market in China is not yet highly developed. 8 On average, our clients tend to have a roughly equal split between buyouts/growth equity and venture capital in their portfolios. Such a split means a reasonable baseline share of China would represent about 13% of such allocations combined. Given the time it takes to build allocations and that China’s share of investments is rising, 15% is a reasonable goal for China as a share of venture capital, growth equity, and buyout allocations in total over the next five years.
Data on Chinese hedge fund exposures are more difficult to come by. Official Chinese statistics combine hedge fund and private investment allocations, while different hedge fund databases have vastly different Asian hedge fund representation. To estimate a baseline allocation to China in hedge funds, we assume that most China exposure would be in the long/short segment of the market and that it would be proportional to the investable share of China’s public equity market. In other words, we multiplied the share of the hedge fund universe that is invested in long/short hedge funds by the 6.0% weight of investible China stocks, to get 1.7%.
Depending on allocations to these areas (both dedicated mandates and Chinese asset exposures by regional or global managers), we think it is reasonable to target China exposure as 5%–10% of the total portfolio. China’s weight in a simple global stock/bond index portfolio could reach more than 6% over the coming years, based on current estimates of investible market weights. Of endowments responding to our year-end quarterly asset allocation survey, the average participant had a baseline China allocation of 5%. This is a low-end estimate, given that we assume that there is no China exposure for a number of asset classes for which we don’t have data (e.g., real assets). Portfolios with higher allocations to private investments would have correspondingly higher China exposure due to the high share of China within venture capital and growth equity.
Finally, investors should also consider their ability to withstand the risk of looking different from peers and benchmarks. To the degree that benchmarks understate the investable China universe and peers choose to stick with the status quo of approaching China through emerging markets or regional Asia mandates, investors overweighting China will look different, which will feel great when China outperforms, but will be challenging when it underperforms. As with any other portfolio divergence from peers and benchmarks, it is critical that investors consider their ability and that of stakeholders to tolerate differentials. Stress testing portfolios to understand performance in up and down China markets is a helpful way to understand how to size positioning with an eye to risk tolerance.
Conclusion
We would be deliberate, but patient in building China allocations, looking for the highest-quality managers in appealing segments. Today, we find equity markets, both public and private, to have the most attractive opportunities for investors. Public equity allocations are attractive, but given their volatile nature, we would capitalize on market downturns to build portfolio exposure over time with skilled, dedicated China managers. All-China and A-share mandates are both attractive, with All-China offering active managers a bigger canvas, but requiring somewhat more complexity for the time being. Over time, we expect that both onshore and offshore China approaches will disappear and All-China will become the prevalent approach. A short list of dedicated China long/short hedge funds offer strong appeal and have demonstrated credible track records. However, given the focus on offshore markets due to shorting limitations, regional hedge funds may be the better approach for many investors. Private investments have strong long-term appeal, with healthcare venture capital offering the most attraction. Fixed income remains an area to watch as the markets develop, but for now, broader Asia or emerging markets mandate managers that can selectively invest in Chinese credits offer a better approach.
For investors with large or mature private investment allocations to China, using a portion of distributions to fund public equities may make sense; those with only public equity investments in China should seek to diversify private equity allocations into Chinese private investments. In either case, such investments should focus on the most attractive managers and segments of the China venture capital and growth equity market. Investors with large emerging markets or Asia public equity overweights should consider such allocations as a good funding source for either public or private investments in China. Failing to consider the exposure to China in the portfolio when adding dedicated China manager can result in too much China overall.
Maintaining a dedicated China allocation requires some complexity, but the hurdles are not insurmountable and are similar to those faced by any investor that owns managers with overlapping mandates, which is nearly ubiquitous today. The main constraints for investors will likely be the ability to handle the inevitable volatility that single-country mandates bring, and the resources available to source and monitor portfolio managers. We cannot overstate the importance of both these factors. Single-country mandates, especially in public emerging markets equities, can be highly volatile, and investors that don’t appreciate this characteristic may not last for the long term—a prerequisite for successful investing.
Index Disclosures
Cambridge Associates Asia Private Equity and Venture Capital Benchmark
The Cambridge Associates Asia Private Equity and Venture Capital Benchmark shows multi-year returns for Cambridge Associates Private Investments benchmarks pulled from CMDB are compounded returns. Multi-year returns reported by the Private Investments group are end-to-end. The end-to-end calculation is a periodic internal rate of return calculation that accounts for the beginning net asset value (NAV), the quarterly cash flows, and the ending NAV.
MSCI All Country World Index
The MSCI ACWI is a free float–adjusted, market capitalization–weighted index designed to measure the equity market performance of developed and emerging markets. The MSCI ACWI consists of 46 country indexes comprising 23 developed and 24 emerging markets country indexes. The developed markets country indexes included are: Australia, Austria, Belgium, Canada, Denmark, Finland, France, Germany, Hong Kong, Ireland, Israel, Italy, Japan, Netherlands, New Zealand, Norway, Portugal, Singapore, Spain, Sweden, Switzerland, the United Kingdom, and the United States. The emerging markets country indexes included are: Brazil, Chile, China, Colombia, Czech Republic, Egypt, Greece, Hungary, India, Indonesia, Korea, Malaysia, Mexico, Pakistan, Peru, the Philippines, Poland, Qatar, Russia, South Africa, Taiwan, Thailand, Turkey, and the United Arab Emirates.
MSCI China Index
The MSCI China Index contains 469 constituents and captures large- and mid-cap representation across China H-shares, B-shares, red chips, P chips, and foreign listings. Currently, the index also includes large-cap A-shares represented at 5% of their free float–adjusted market capitalization.
MSCI China A Onshore Index
The MSCI China A Onshore Index captures large- and mid-cap representation across China securities listed on the Shanghai and Shenzhen exchanges.
MSCI Emerging Markets Index
The MSCI Emerging Markets Index represents a free float–adjusted, market capitalization–weighted index that is designed to measure equity market performance of emerging markets. It includes 24 emerging markets country indexes: Brazil, Chile, China, Colombia, Czech Republic, Egypt, Greece, Hungary, India, Indonesia, Korea, Malaysia, Mexico, Pakistan, Peru, the Philippines, Poland, Qatar, Russia, South Africa, Taiwan, Thailand, Turkey, and the United Arab Emirates.
MSCI Emerging Markets ex China Index
The MSCI Emerging Markets ex China Index contains 667 constituents and captures large- and mid-cap representation across 23 of the 24 emerging markets countries excluding China, including Brazil, Chile, Colombia, Czech Republic, Egypt, Greece, Hungary, India, Indonesia, Korea, Malaysia, Mexico, Pakistan, Peru, the Philippines, Poland, Russia, Qatar, South Africa, Taiwan, Thailand, Turkey, and the United Arab Emirates.
Footnotes
- Multiples are from Cambridge Associates database as of September 30, 2018.
- The loss ratio is the percentage of capital in investments realized below cost, net of any recovered proceeds, over total invested capital. The impairment ratio is the percentage of invested capital realized or valued at less than cost.
- We evaluate this time horizon because 1993 is the year our index data begins, and 2015 is the most current vintage year mature enough to evaluate.
- Median fund performance differs from total vintage year returns in that vintage year returns are asset weighted.
- While there are many more listed stocks, these statistics reflect the constituents of the MSCI All China IMI Index at their full-float weights.
- As of 2018, MSCI has included a small fraction of A-shares eligible for purchase via the Stock Connect program. The 2018 inclusion limited each company to 5% of investable market cap (i.e., adjusted for free float and foreign ownership limits). By the end of this year, the inclusion factor will increase to 20% of investable market cap and begin including mid-cap stocks.
- Stock index shorting is about to get easier for foreign investors as futures contracts on the portion of Chinese A-shares included in the MSCI EM Index (the MSCI China A Index) will also be available for trading on Hong Kong’s stock exchange in November, pending regulatory approval. This will allow investors to use Stock Connect links to hedge risk in the A-share market. Stock index futures are available in mainland China on major benchmarks (e.g., CSI 300), but international access to these futures is limited.
- According to PitchBook, for growth equity and buyouts combined, China accounts for an average of 3% of total investments over the last five years, as global investments in buyouts were roughly seven times that of growth equity, such that the small weight in China buyouts diminishes the aggregate weighting to China.
Celia Dallas - Celia Dallas is the Chief Investment Strategist and a Partner at Cambridge Associates.
About Cambridge Associates
Cambridge Associates is a global investment firm with 50+ years of institutional investing experience. The firm aims to help pension plans, endowments & foundations, healthcare systems, and private clients achieve their investment goals and maximize their impact on the world. Cambridge Associates delivers a range of services, including outsourced CIO, non-discretionary portfolio management, staff extension and alternative asset class mandates. Contact us today.