VantagePoint: Fourth Quarter 2017

Advice in Brief
- From the outset in 2009, investors have had very little faith in the durability of this bull market. Yet our analysis suggests that the risk-on environment continues. Global growth is strong and widespread, financial conditions remain easy, and equity valuations outside the United States remain reasonable.
- These positive factors are offset by concerns related to geopolitical risks and uncertainty surrounding efforts to shrink historically large central bank balance sheets. Further, as the market cycle continues, valuations are becoming more elevated, especially in US equities that also have less earnings upside relative to other equity markets.
- Despite the rise in valuations, investors continue to be compensated for taking risk. As a result, we remain neutral on risky assets, while tilting away from the most expensive and vulnerable markets like US equities and high-quality sovereign bonds.
- Investors should seek to determine how much risk they are taking in portfolios relative to neutral risk allocations and adjust positioning accordingly.
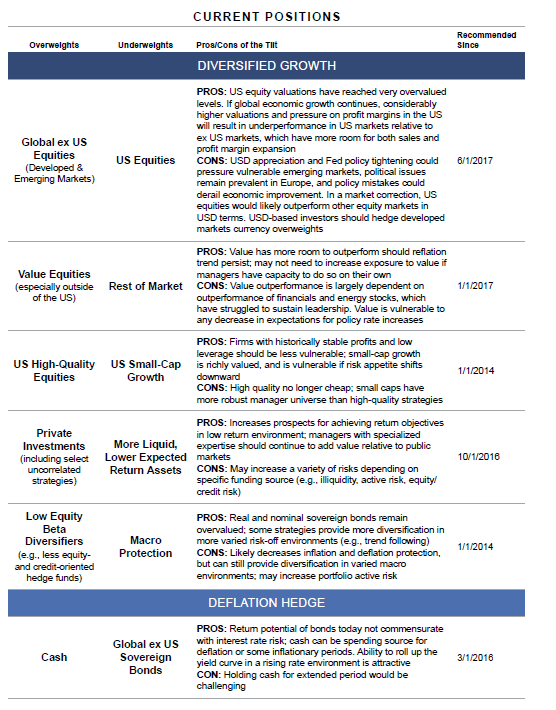
Portfolio Tilts From CA’s Chief Investment Strategist
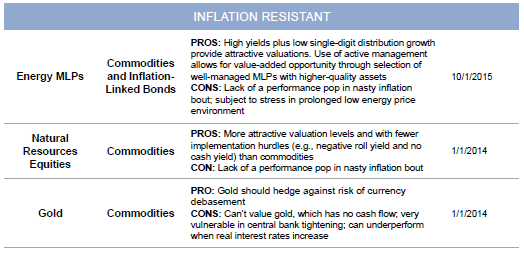
Are we there yet? From the outset in 2009, investors have had very little faith in the durability of this bull market. Markets have had to climb a pretty steep wall of worry over the last 8+ years, but risky assets have remained resilient and equities are now in one of the longest bull markets on record. Time and time again, investors are expressing concern that the bull market must be drawing to a close. In this edition of VantagePoint, we pull out our roadmap to help investors understand the key influences on markets and discuss implications for portfolio positioning.
Our analysis of these influences suggests that we remain in a risk-on environment; although a near-term pullback would not be surprising given how hard many markets have run. Global growth is strong and widespread, financial conditions remain easy, and equity valuations outside the United States remain reasonable. These positive factors are offset by concerns related to geopolitical risks and uncertainty surrounding efforts to shrink historically large central bank balance sheets. Further, as the market cycle continues, valuations are becoming more elevated, especially in US equities that also have less earnings upside relative to other equity markets. Despite the rise in valuations, investors continue to be compensated for taking risk. As a result, we remain neutral on risky assets, while tilting away from the most expensive and vulnerable markets like US equities and high-quality sovereign bonds. Investors should seek to determine how much risk they are taking in portfolios relative to neutral risk allocations and adjust positioning accordingly.
Widespread Global Economic Expansion
The global economic expansion has now extended to every country in the MSCI developed and emerging markets indexes, marking the first time such widespread expansion has been seen in a decade. Such periods are rare, occurring in only five other years since 1981 (2000 and 2004–07). The economic drag from the Eurozone debt crisis and the energy-led bust has lifted, allowing the global economy to enter the sweet spot of broadening expansion with low inflation. To the extent this continues, the environment will remain supportive for risky assets.
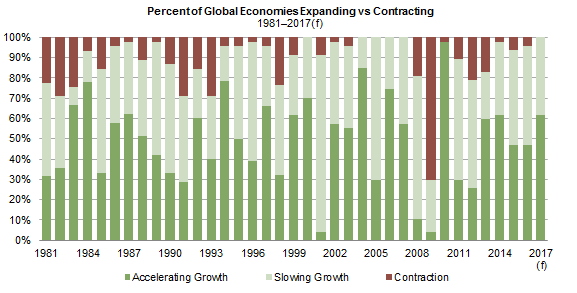
Global growth is synchronizing and expanding at a faster clip
Sources: International Monetary Fund – World Economic Outlook Database and MSCI Inc. MSCI data provided “as is” without any express or implied warranties.
Notes: Included in this analysis are the 23 developed markets economies in the MSCI World Index and the 24 emerging markets economies in the MSCI Emerging Markets Index. GDP growth figures are in national currencies and inflation-adjusted terms. Growth for all 47 economies in 2017 is forecasted; growth is also forecasted for nine economies in 2016 and two in 2015. Czech Republic, Russia, and the Netherlands data are excluded prior to 1997, 1994, and 1982, respectively, due to data availability.
The economic expansion has been a slow and drawn out affair, causing investors to keep predicting that it must end soon. However, despite its length, the slow pace of growth has left a considerable degree of slack in the global economy. Even in the United States, where the economic expansion is furthest along, the economy appears to have just caught up with its potential, setting the stage for some price pressure ahead, but little has been forthcoming outside of asset prices. Based on data from the Federal Reserve Bank of St. Louis and the US Congressional Budget Office, the US economy is just about at full capacity as measured by the output gap—a condition that typically is met much earlier in economic expansions. Further, the unemployment rate has only recently fallen below the US Federal Reserve’s 4.6% estimate of full employment. Under these circumstances, the lack of inflationary pressures has allowed central banks to move slowly. These accommodative conditions could support this expansion for longer than has been typical.
Outside of a geopolitical shock, the two key risks to continued expansion are: (1) a backup in yields caused by tighter monetary policy and an unwinding of quantitative easing and (2) a rapid pickup in inflation. Tighter financial conditions are certainly a risk, particularly given the uncertainty surrounding a reduction in central bank balance sheets. As discussed later, some increase in bond yields is priced in to the market, but the potential for an upside surprise that could tighten financial conditions must be considered. For now, even with the Fed tightening monetary policy and initiating shrinkage of its balance sheet, financial conditions remain easy. The economy usually responds to stronger financial conditions with a lag, suggesting that US economic growth may see more improvement. In addition, a recent IMF report highlighted that easy US financial conditions tend to have a positive transmission effect to other countries, which perhaps helps explain why growth is broadening globally. 1
Inflation pressure in the United States should be expected to build, but global excess capacity may keep inflation at bay for now. Inflationary pressures will likely need to build globally to cause more meaningful tightening efforts that constrain financial conditions, and that will take some time. Once inflationary pressures begin to emerge and central banks pull back liquidity, we expect tightening will become restrictive to the flow of credit. At that point, valuations will matter. Even if the economic damage is not as profound as it was in the 2008 recession given leverage remains lower and more spread out among varied parties, asset market valuations are generally more elevated today and vulnerable to an increase in yields. For now, we remain neutral on risky assets, while maintaining diversification and appropriate liquidity. Underweighting the most expensive assets is also prudent at this stage.
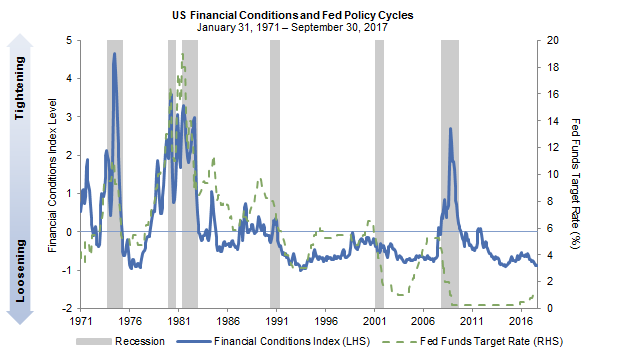
Financial conditions remain easy, even as the Fed has started raising rates
Sources: Federal Reserve, Federal Reserve Bank of Chicago, National Bureau of Economic Research, and Thomson Reuters Datastream.
Notes: Positive values of the National Financial Conditions Index indicate tighter than average financial conditions; negative values indicate looser than average financial conditions. Recessions are defined by NBER.
Monetary Policy Risk
While most major central banks maintain an easing bias today, the Fed has been gradually raising rates and just initiated a program to reduce the size of its balance sheet, while the European Central Bank (ECB) has begun to consider prospects for tapering purchases and the Bank of England (BOE) is contemplating raising rates. Tighter monetary policy has in the past signaled the end of bull markets, as higher interest rates can constrain borrowing and send the economy into recession. However, at early stages of tightening, the market response is often mixed. When earnings growth is strong enough to offset the impact of rising rates, equities and other risky assets can still generate positive returns. For now, this appears to be the case given strong earnings growth and a positive cyclical economic growth backdrop.
Nonetheless, considerable uncertainty surrounds the possible impacts from a reduction in the Fed’s balance sheet. Between 2008 and 2014, the Fed’s balance sheet increased from $900 billion to an unprecedented $4.5 trillion. According to the Fed’s own analysis, the nearly $4 trillion increase in its balance sheet resulted in a 100 basis point (bp) decline in the term premium (compensation demanded by investors to own longer duration bonds) embedded in the ten-year US Treasury yield. Notably, even as the term premium did fall by about 100 bps over the extended period of balance sheet expansion, the bulk of the adjustments occurred in advance of Fed asset purchases, with the term premium and total yield generally increasing during periods of quantitative easing.
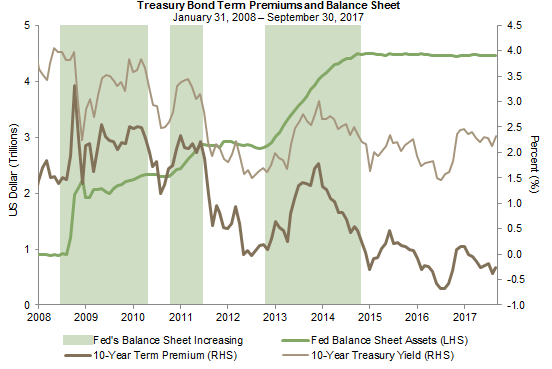
Treasury bond term premium and balance sheet size not highly correlated
Sources: Federal Reserve, Federal Reserve Bank of New York, and Thomson Reuters Datastream.
Since the Fed’s June announcement that balance sheet reduction was forthcoming, the ten-year Treasury yield and term premium have barely budged, implying the market was already pricing in some expectation of rising rates or believes their impact will be minor. The pace of reduction will be slow initially and increase gradually over the next 12 months. 2 Importantly, the Fed has not disclosed by how much it will shrink its balance sheet, only stating that it expects reserve balances to reach “a level appreciably below that seen in recent years but larger than before the financial crisis.” Most analysts estimate that the balance sheet will shrink to between $2 trillion and $3 trillion, pushing the term premium up by somewhere between 25 bps and 65 bps over a multi-year horizon. As of early October, the market seems to agree. The ten-year Treasury forward curve is pricing in broadly consistent expectations: 26 bps higher by the end of 2018, 42 bps higher by the end of 2019, and 63 bps higher by the end of 2021. Markets could well change their minds as the effects of balance sheet reduction become evident in the coming months. Changes in the Federal Open Markets Committee at the Fed further complicate matters as three of seven board seats are empty, one seat was just filled, and Chair Janet Yellen’s term expires in February.
Another factor keeping rates tame is the continued accommodative stance of and asset purchases by the ECB and BOJ. Indeed, the net supply of sovereign debt issued by the Eurozone, Japan, the United Kingdom, and the United States has been negative in recent years, helping to keep rates low. According to BCA, the combination of increased federal borrowing and a reduction in Fed asset purchases will increase the amount of US Treasuries sold to the private sector by about $300 billion between this year and next—a 57% increase in one year. This will swing the net supply of G4 sovereign bonds into positive territory for the first time since 2014.
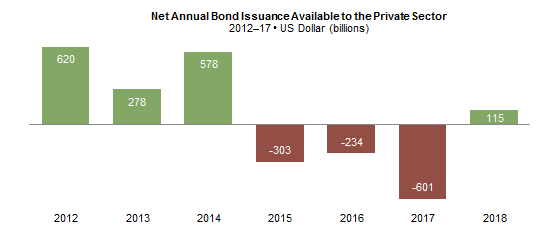
US quantitative tightening will increase supply of G4 sovereign bonds to private investors
Source: BCA Research Inc.
Notes: Includes the Eurozone, Japan, the United Kingdom, and the United States. Data after 2016 are estimated. For the Eurozone, monthly purchases are assumed to be €60B per month from March to December 2017 and then continue at €30B of monthly purchases in 2018. For Japan, purchases are assumed at ¥70T per month for the whole forecast period. For the UK, no change is assumed in central bank holdings of government bonds in 2017 and 2018.
Still, the big picture is that financial conditions remain loose. Even with fewer asset purchases, net sovereign issuance will be well below historical averages. However, as economic growth accelerates, and global slack decreases, other central banks will join the Fed in tightening and pulling back from extraordinary monetary policy measures. In the interim, investors need to be wary of the influence of ultra-low rates on excesses building in the market. For example, low rates have pushed up equity valuations in some markets, and higher rates could mean they eventually or suddenly deflate. The low rate environment may also drive excessive and/or mal-investment. Here the data are fairly mixed, as some countries and sectors have cleaned up balance sheets, but others need to do more work. In Europe and the United States, for example, corporate leverage has increased in recent years, but is only slightly above its recent averages. Excesses may well become more extended before this cycle reverses.
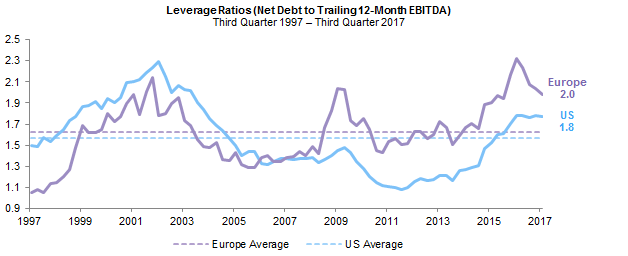
Corporate leverage has risen but is not alarming
Sources: FactSet Research Systems and MSCI Inc. MSCI data provided “as is” without any express or implied warranties.
Notes: Europe uses data for the MSCI Europe Index; US for the MSCI US Index. Both exclude the financial and real estate sectors.
Trump Trade Revival?
In the immediate aftermath of the US presidential election, markets responded strongly to expectations for reform and fiscal spending, and related prospects for higher inflation pressures. However, as the Trump agenda has been slow to materialize and the Republican majority has proven to be splintered, these trades have faded. In recent weeks, the tax reform trade has resurfaced, following the release of a tax reform proposal in late September by the Trump administration and top Republican house and senate leaders, the so-called Big Six. At the same time, as discussed earlier, global growth has been surprising to the upside, reinforcing market strength.
The details of the tax proposal matter, but have not yet been sufficiently laid out. For example, questions surround the treatment of taxation of intellectual property, which could disproportionately penalize technology and pharmaceutical companies.
Perhaps the biggest question for US multinationals is the tax treatment of foreign revenue. The proposal indicates that the United States will transition to a territorial tax system. In theory, this is favorable, as today corporations are required to pay higher US tax rates on global earnings than most foreign competitors. Under territorial tax systems, corporations’ foreign profits are typically not taxed. However, the proposal indicates that it would seek to protect erosion of the US tax base by taxing foreign profits of US corporations at a reduced tax rate to prevent companies from shifting profits to tax havens. Further, the new proposal would close the tax loophole of deferring taxes on earnings that are not repatriated. Today, an estimated $2.6 trillion in untaxed earnings remains outside the United States at subsidiaries. Foreign earnings that have remained outside the United States would be subject to a low one-time tax that would be payable over a multiyear horizon. The inability to defer taxes indefinitely and the taxation of all future earnings would potentially increase the tax rate of many US multinational companies relative to current tax bills.
What we do know is that under the proposal, companies that pay higher taxes today would benefit over those paying lower taxes, particularly as special deductions are reduced or eliminated to pay for a decrease in the corporate tax rate. Smaller companies tend to pay higher taxes, while large companies, particularly technology companies, have benefitted from lower tax rates overseas provided they don’t repatriate earnings. The median effective corporate tax rate for US small-cap companies was 33% in 2016, materially above the 29% paid by large caps.
The market has largely priced in the relative benefit of lower corporate tax rates for small-cap stocks. The performance of US small-cap stocks relative to mid- to large-cap stocks started to rebound following the failure of the Senate to repeal the Affordable Care Act (ACA), which signaled a shift in focus from health care to tax reform. Since the low in relative performance in late August, small caps have outperformed large caps by about 6 percentage points. About one-third of the outperformance was gained on the back of the release of the tax reform proposal in the last few days of September.
In addition, the expectation that the tax proposal will include some deficit financing has pressured up US Treasury yields (along with anticipated Fed moves) and given a lift to the US dollar, which rallied about 2% from its early September lows after previously suffering a loss of about 10% this year. Similarly, value stocks, which benefit in a rising rate and stronger growth environment, have seen a tentative reversal of similar magnitude since their early September lows relative to growth stocks.
The view from Capitol Hill is that tax reform is not possible near term, but a tax cut is probable. Congressional staff view it as likely that the Republican majority will vote for corporate tax cuts, probably at a higher rate than the 20% proposed, and that such a cut will pass by early next year.
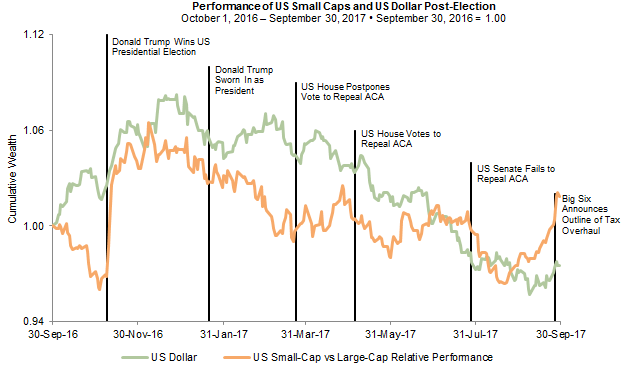
Is there much further upside for Trump trades?
Sources: Frank Russell Company, Thomson Reuters Datastream, and various news outlets.
Notes: US small caps are represented by the Russell 2000® Index, US large caps are represented by the Russell 1000® Index, and US dollar is represented by the DXY Index.
Some of the prospective improvement in earnings has been priced in. Should actual reform or sharper tax cuts pass, US equities, particularly small-cap, cyclical, and value stocks; the US dollar; and US rates would likely continue their ascent. If other initiatives, such as infrastructure or deregulation, become a priority, they could give a lift to near-term growth expectations, depending on how they are executed. Given that US small-cap stocks are at peak valuations and have already priced in a sizeable degree of relative benefit, global value and cyclical stocks may offer a better risk/reward proposition. Globally, value stocks are cheap relative to growth stocks, they have priced in less improvement in earnings growth, and they should be expected to benefit from accelerating global growth irrespective of developments in the US tax proposal.
With regard to the US dollar, the Fed continues to telegraph more rate increases than are priced in by the market. With economic slack waning and an unemployment rate of just 4.2%, upside risk to the US dollar and rates remain. However, we remain neutral on the US dollar given high valuations and a global growth expansion that may mean markets start to discount tighter policy across other economies as well.
Improving Fundamentals
As global trade and commodity prices have stabilized at higher levels, earnings have rebounded smartly from the depths of the earnings recession. Like the economy, earnings growth has been slow since the financial crisis, suggesting there may be room for further growth before the cycle is out. This is true even in the United States, which has seen the strongest earnings recovery. US earnings have grown at around 0.5% a year over the last decade, and are currently 5.5% above 2007 peaks (in inflation-adjusted terms). In contrast, earnings in Europe remain roughly 30% below pre–financial crisis peaks. Earnings typically retrace prior peaks and then some before the cycle ends. While it seems unreasonable to expect European financial sector earnings to fully retrace their inflated prior peaks, earnings growth globally does not appear to be overextended in the aggregate and has more room for improvement, especially outside the United States.
US profit margins also look extended relative to other markets, but may be less vulnerable than they appear on the surface. While profit margins for US equities are just under all-time highs at an index level, on an equal-weighted basis, margins are high, but below peak levels reached in 2006, 2011, and 2014. Indeed, the largest stocks, the so-called FAAMGs (Facebook, Apple, Amazon, Microsoft, Google) boast margins well above that of the overall index. Remove these stocks and the index margin would drop by around 60 bps. US equity portfolios remain vulnerable to a decline in large company margins, but most actively managed portfolios are less exposed to such companies and likely have less stretched profit margins. Further, non-US markets have more opportunity for margins to expand as companies catch up to the United States, boosted by an improvement in sales growth. Even if US margins stay stable, non-US companies have more upside potential.
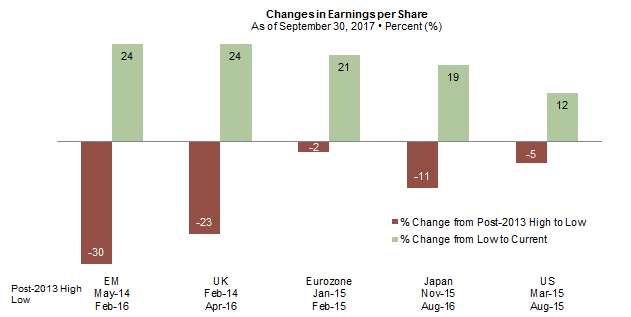
Earnings are rebounding from 2014–16 earnings recession
Sources: I/B/E/S, MSCI Inc., and Thomson Reuters Datastream. MSCI data provided “as is” without any express or implied warranties.
Notes: EPS data are in local currency terms, except for EM, which is in USD terms. EPS data are trailing 12 months.
Are Investors Being Compensated for Taking Risk?
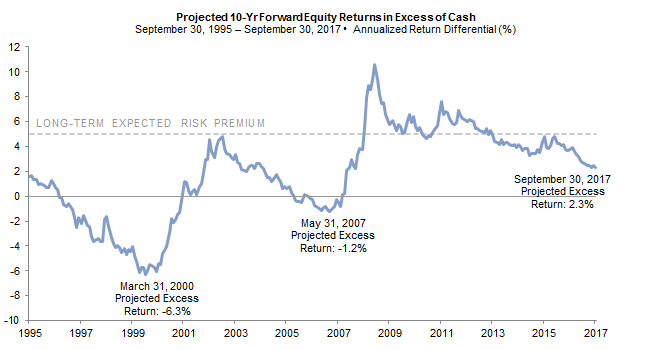
Valuations across the board have been getting more expensive as this market cycle has progressed. At present, the most extreme valuations are found in US equities, particularly US small caps, other developed markets small caps, select segments of private markets (e.g., late-stage US venture capital), and segments of tradeable bonds, particularly core EMU sovereign bonds and euro-denominated credits. Many other asset classes and investment strategies are fully priced or expensive, but not excessively so. A helpful framework to consider when evaluating the impact of valuations on portfolio construction is to look at the degree to which investors are being compensated for taking risk. To evaluate this, we look at the spread between prospective returns for global equities and cash if valuations reverted to fair value and fundamentals to average levels over the next decade.
Since its peak in 2009, compensation for taking risk has been falling, but remains positive and well above spreads seen near prior market tops. Over the long term, we expect the equity risk premium to be about 500 bps. Today, investors are getting paid half that amount—230 bps—for taking risk. By comparison, at prior market peaks, the equity risk premium was deeply negative.
The equity risk premium may well bottom at a level higher than marked the end of the past two cycles, as the yield on cash may not increase as much as it did in the past. However, for the time being, investors are still being compensated for taking risk.
Still getting paid for risk: less compensation, but projections well above prior market bottoms
Sources: MSCI Inc. and Thomson Reuters Datastream. MSCI data provided “as is” without any express or implied warranties.
Notes: This analysis uses our valuation-based scenario return projection models. Our return to normal scenario incorporates current valuations and assumes equity valuations revert to fair value over ten years. This scenario makes assumptions about the market environment including mild inflation; moderate real earnings growth; and low corporate default rates, government bond yields, and credit spreads. Projections are in local currency terms and are intended to represent total returns. Projected global equity returns are based on a weighted average of the projections for US, developed ex US, and EM equities using month-end weights for the MSCI All Country World Index. Cash returns are based on 3-Month US Treasury Bill yields.
What To Do About Geopolitical Risks
Geopolitical and political risks are at the forefront today, most notably tensions in North Korea. Evolution in the global balance of power and resolution of political, economic, and social risks can take decades to play out, not years. Prospects for military conflict on the Korean peninsula are very low, but the consequences would obviously be devastating.
With respect to capital markets, the impact of geopolitical events on equities historically has been sharp sell-offs followed by rapid recoveries. Most equity-related sell-offs have been relatively modest and short lived, with the decline in the immediate aftermath of an event averaging roughly 7.5% and recoveries beginning less than a month after the sell-off started.
The worst returns were during more severe events, such as the Korean War, or events that have coincided with recessions, like the Israel-Arab war/oil embargo and the September 11, 2001, attacks. Ultimately, the economic environment prevails over the geopolitics, but sometimes geopolitics can aggravate the economic environment. For example, US equities sold off 17% around the time of the 1973 oil embargo. While the market drop bottomed after just 27 days, six months later equities had fallen 2% below the bottom and a year later were down nearly 30% from the bottom.
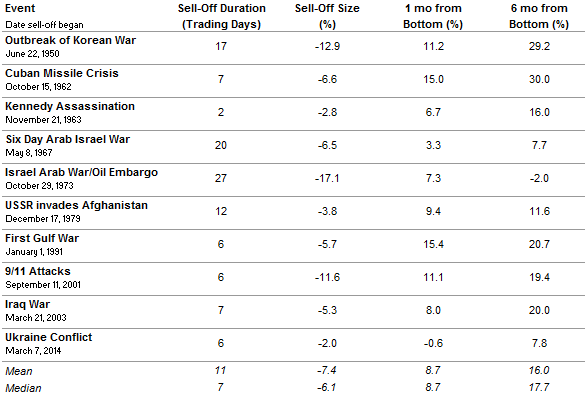
Equity Market Sell-Offs and Recoveries Around Geopolitical Events
Sources: Deutsche Bank and Haver.
Note: Data reflect S&P 500 price returns.
Please see Celia Dallas, “Should Investors Be Concerned About Rising Geopolitical Tensions?” CA Answers, November 1, 2016.
Positioning portfolios for specific geopolitical events can be hazardous as the magnitude of sell-offs varies, turnarounds tend to start quickly, and other factors, such as economic conditions, market fundamentals, and valuations, often dominate over longer horizons. Diversification and careful liquidity management are the best lines of defense.
Weighing the Evidence
Even as the ride has been longer than anticipated, it appears investors must still wait a bit longer for the end of the market cycle. In weighing the factors influencing the market, the balance is tilted to a risk-on environment. Economies are in the first fully synchronized global expansion in a decade, financial conditions are easing even as some central banks, including the Fed, are tightening, and equity valuations outside the United States remain reasonable.
There are clearly risks, in particular related to geopolitical tensions and uncertainty as central banks begin to unwind their unprecedented balance sheet expansion. Valuations across the board are getting more expensive, which does give us pause. Overall, we remain neutral on risky assets rather than more aggressive, even as the balance of factors is supportive to risk taking.
For more discussion on illiquid diversifiers, please see the fourth quarter 2016 edition of VantagePoint, published October 17, 2016.
We would tilt away from expensive US equities toward developed ex US and emerging markets equities. We would continue to own high-quality sovereign bonds as they remain valuable, but would minimize allocations given low yields mean low expected return and high downside if rates rise. Finally, in place of some sovereign bonds, we would seek to add other diversifiers. At the top of our list of candidates are trend-following strategies, low equity and credit beta hedge funds, and for those that can take some illiquidity, niche credit opportunities. ■
Footnotes
- International Monetary Fund, “Global Financial Stability Report: Getting the Policy Mix Right,” April 2017.
- The Fed began this process in October by allowing up to $10 billion a month ($6 billion in US Treasuries and $4 billion in mortgages) of current assets to mature without reinvesting the proceeds. Every quarter, it will increase the maximum by $10 billion until a maximum of $50 billion is reached in one year ($30 billion in Treasuries, $20 billion in mortgages).
Celia Dallas - Celia Dallas is the Chief Investment Strategist and a Partner at Cambridge Associates.
About Cambridge Associates
Cambridge Associates is a global investment firm with 50+ years of institutional investing experience. The firm aims to help pension plans, endowments & foundations, healthcare systems, and private clients achieve their investment goals and maximize their impact on the world. Cambridge Associates delivers a range of services, including outsourced CIO, non-discretionary portfolio management, staff extension and alternative asset class mandates. Contact us today.