Global ex US PE/VC Benchmark Commentary: Calendar Year 2021


In 2021, the Cambridge Associates LLC Developed Markets (ex US) Private Equity and Venture Capital (PE/ VC) Index returned 33.4% in USD terms, equaling its strong performance in 2020. Because the index’s return is measured in US dollars, the currency’s value vis-à-vis the euro impacts its performance. The US dollar gained significant value against the euro in the second half of 2021, strengthening performance as measured in euros, which reached 43.5% (Figure 1). PE/VC in emerging markets performed less well in 2021 than they did in 2020. The Cambridge Associates LLC Emerging Markets Private Equity and Venture Capital Index earned 14.1% for the year, as strong first half performance was tempered by a negative second half. The developed markets PE/VC index has handily outperformed its public market counterparts across time based on modified public market equivalent (mPME) returns.(Cambridge Associates’ mPME calculation is a private-to-public comparison that seeks to replicate private investment performance under public market conditions.) While the same is generally true for the emerging markets PE/VC index, the MSCI All Country World Index (MSCI ACWI) mPME has outperformed over more recent time periods. Public markets were negatively impacted by strict COVID-19 measures in some countries and ongoing geopolitical tensions, which led to a broader market downturn that has continued into 2022; the impact was already visible on private market returns in early 2022 and is expected to continue to be felt for some time.
Calendar Year 2021 Highlights
- The developed markets (ex US) PE/VC index had its second consecutive strong year in 2021, which further increased its dominance over the comparable public benchmark (MSCI EAFE) in all time periods listed in Figure 1. The emerging markets index has also outperformed its public market peer (the MSCI Emerging Markets Index) across all time periods.
- As of December 31, 2021, public companies accounted for a much larger portion of the emerging markets index than of the developed one (about 20% for emerging and just over 7% for developed).
- From a relative performance standpoint, information technology (IT) and consumer staples stood head-and-shoulders above the other sectors, though absolute performance was strong across all sectors in the developed markets index. The story was similar in the emerging markets PE/VC benchmark; IT, financials, and industrials were the big winners, but many sectors posted strong returns.

Developed Markets (ex US) PE/VC Performance Insights
Showcasing the strong recovery after the COVID-19 pandemic shut down large parts of the global economy in 2020, public equities finished 2021 with positive returns. The developed markets index (MSCI EAFE) handily outperformed emerging markets (MSCI EM). The developed markets PE/VC index had a stellar year in 2021, earning 33.4%. This follows the 33.5% annual return in 2020, representing the two highest calendar year returns since 2006. At year-end, 15 vintage years (2006–20) made up substantially all the index’s value; all but two (2007 and 2010) returned more than 14% for the year.
According to Dealogic, five European PE-backed companies went public in 2021 (down from 14 in 2020); among them, four were traditional initial public offerings (IPOs) and one through a special purpose acquisition company (SPAC). Combined, the public deals were worth just $2.4 billion. Two of the companies were in the IT sector, and the rest occurred in the consumer, materials, and communication services sectors. In stark contrast to the PE-backed IPO markets, VC-backed companies in Europe went public at a staggering rate, according to Pitchbook; more than three times as many VC-backed companies went public via IPO in 2021 than in 2020, at nearly ten times the value (€103.1 billion in 2021 vs €10.6 billion in 2020). Europe also saw an increase in PE-backed mergers & acquisitions (M&As) in 2021, with 871 transactions completed (up from 768 in 2020). Within the sample, 246 (or almost 30%) of the deals had publicly disclosed values and those averaged $1.1 billion per transaction, and slightly more of the activity took place in the first half of 2021 than in the second.
Vintage Years
The number of meaningfully sized vintage years (those that represented at least 5% of the index’s value) at the end of 2021 rose to eight (from seven at the end of 2020); combined, the large vintages (2012–19) accounted for almost 88% of the benchmark’s value (Figure 2). During 2021, vintage years 2016–18 each grew in net asset value (NAV) by more than $20 billion, and, combined, they made up over 40% of the index. The 2016 vintage alone accounted for about 20%, which is a higher level of concentration by vintage year than seen in the other indexes. At nearly 7%, the 2014 vintage was the smallest of the meaningfully sized vintages; all others represented at least 9% of the index.
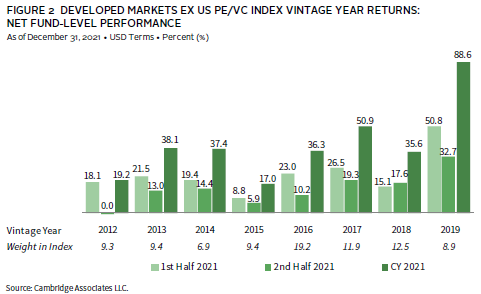
Calendar year returns for the eight key vintage years were strong, ranging from 17.0% (2015) to 88.6% (2019). Only two vintages, 2012 (19.2%) and 2015 (17.0%) returned less than 35%. Write-ups in consumer staples were the largest driver of performance in the top-performing 2019 vintage; IT and healthcare helped drive performance for the second-best vintage, 2017.
LP Cash Flows
The developed markets (ex US) PE/VC index saw record high cash flows during 2021. Limited partner (LP) contributions topped $71.4 billion, and distributions topped $84.6 billion. Both contributions and distributions were significantly higher in the second half ($44.8 billion and $51.3 billion, respectively) than they were in the first ($26.6 billion and $33.4 billion, respectively). Annual distributions have outpaced contributions in ten of the previous 11 years, with 2020 as the exception (Figure 3).
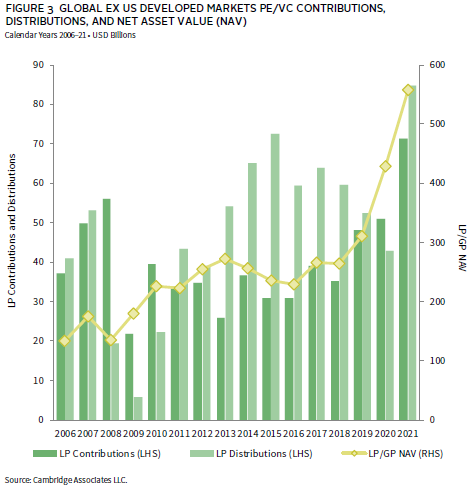
Capital calls were led by five vintage years (2016–20), each of which called at least $7 billion; the 2018–20 subset, which represented vintages earlier in their investment periods (often the first five years of fund lives), called more than $10 billion each. Combined, the five vintages represented nearly 95% of the total LP contributions during the year. Capital calls for these vintages helped to drive the significant NAV growth and index weights mentioned in a prior paragraph. Distributions were less concentrated, as seven vintage years (2011–17) returned more than $6.9 billion each. Notably, funds raised in the relatively immature 2017 vintage distributed more than $7 billion (8.6% of total).
Sectors
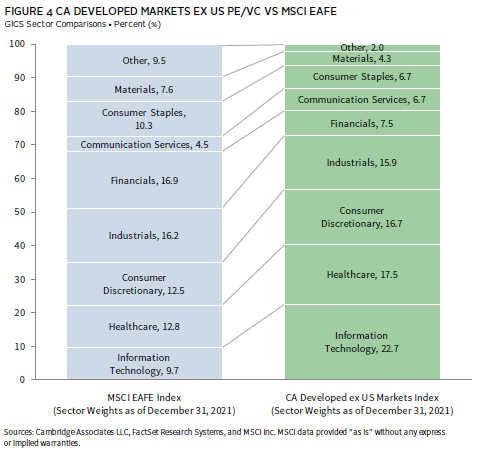
Figure 4 shows the GICS sector breakdown of the Developed Markets (ex US) PE/VC Index and a public market counterpart, the MSCI EAFE Index. Compared to the public index, private markets had substantial overweights in healthcare, IT, and consumer discretionary (overweights of 4.7%, 13.1%, and 4.2%, respectively). The larger exposures to these sectors might help to explain the PE/VC index’s outperformance in recent time horizons. Calendar year 2021 was mostly defined by a post-COVID economy, one marked by tech proliferation across portfolios and accelerated advancement in biotech and life sciences.
At the end of 2021 there were seven meaningfully sized sectors in the index, and all but two returned more than 37% for the year in USD terms (Figure 5). Though lagging the group in relative terms, consumer discretionary—the weakest-performing sector—and healthcare still showed strong absolute performance, posting returns of 15.4% and 26.5%, respectively. For all but consumer staples, first half returns were stronger than those in the second half, though most sectors performed well in both halves on an absolute basis. That said, returns for consumer staples and IT were far and away the best at 73.5% and 66.4% for the year, respectively. The US dollar gained value against the euro in second half of 2021, leading to stronger performance when measured in euros.
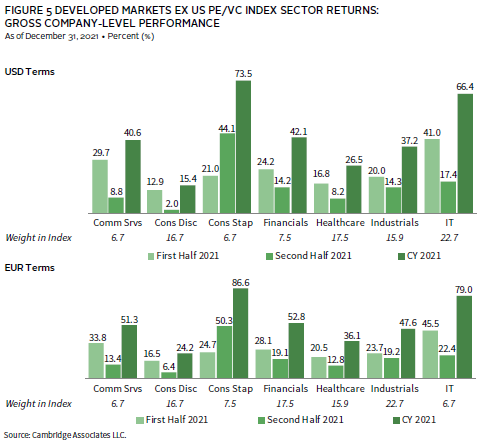
Consumer staples’ strong performance was concentrated in just three vintage years of varying maturities (2009, 2013, and 2019), with nearly 84% of the write-ups occurring in these vintages. About half of this was attributable to the 2019 vintage, a fact not altogether surprising in a rapidly rising market environment. Gains in IT were more widespread; ten vintages accounted for 95% of the net appreciation for the year, though two vintages (2016–17) accounted for 44% of the total write-ups. Consumer discretionary results were mixed, with significant write-ups in several vintage years partially offset by write-downs in others.
The index’s four largest sectors—IT, healthcare, consumer discretionary, and industrials (in rank order)—represented 73% of its value and returned 36.0% on a gross USD-weighted basis and 46.4% on a euro-weighted basis. More than 71% of the capital invested during 2021 went to IT, healthcare, consumer discretionary, and industrials companies (from largest to smallest); at the same time, managers realized more than $12 billion from IT, consumer discretionary, and healthcare investments, representing 62% of all capital realized. Since the inception of the index, managers invested about 67% in those four sectors; this is roughly in line with 2021 levels, which reflect increases in healthcare and IT and decreases in consumer discretionary and industrials.
Countries
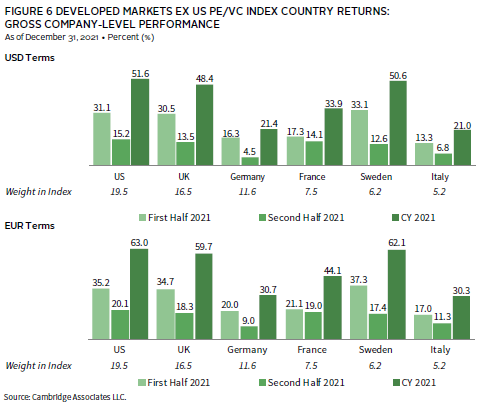
In 2021, there were six meaningfully sized countries in the index, and all earned returns of at least 21.0% in USD terms (Figure 6); returns in euros were higher for every country. Performance for UK companies was weaker when measured in pound sterling (49.7% in GBP versus 59.7% in euro), but GBP returns for the year still finished higher when compared with the dollar. As in 2020, investments made in US companies performed the best over the full year and accounted for the largest amount of the index’s value (19.5%). (Funds in the developed markets (ex US) PE/VC benchmark primarily invest in companies in Europe, but occasionally make investments in US companies as well. This is particularly true of “global” managers included in the ex US indexes.) Sweden and the United Kingdom were the second and third best performers, returning 50.6% and 48.4%, respectively. Italy and Germany, the two lowest performers, both posted single-digit returns during the second half, 6.8% and 4.5%, respectively; all other countries enjoyed double-digit returns during both the first and second halves of the year. Performance was strong across the board as countries continued to reopen and recover from the impacts of the COVID-19 pandemic.
While valuation increases were relatively widespread for US companies, the 2017 and 2019 vintage years accounted for almost 43% of those write-ups. The strong performance for Swedish businesses was elevated by the 2012–13 and 2016–17 vintages, with each set of vintage years accounting for just over a third of the country’s gains. For UK-based businesses, the 2013 and 2016 funds saw significant write-ups and accounted for 56% of the total gains in 2021. For the year, the gross USD-weighted return for the three top performers—the United States, Sweden, and the United Kingdom—was 50.2%.
European companies attracted 73% of the capital invested during the year, led by those in the United Kingdom; an additional 21% of the invested capital was allocated to US-based businesses. Historically, Europe and the United States garnered 92% of capital, with the difference in 2021 attributed to the higher-than-normal investment in the United States.
Emerging Markets PE/VC Performance Insights
Like the private asset classes, in the public markets, the developed markets index (MSCI EAFE) outperformed the emerging markets (MSCI EM), as public equities continued their strong performance post-pandemic. With a 14.1% annual return, the emerging markets PE/VC benchmark had a strong year, though its performance was nearly half that of 2020. At the end of 2021, vintage years from 2011–21 made up nearly 86% of the index’s value and annual returns among those vintages averaged nearly 17%.
Vintage Years
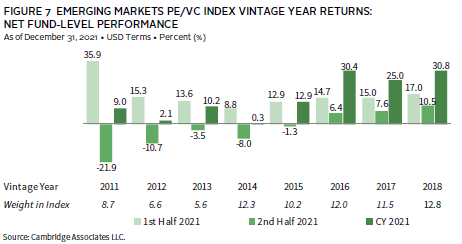
Eight vintage years were meaningfully sized in 2021 and collectively they accounted for 80% of the total sample (Figure 7). All produced positive returns for the year, ranging from 0.3% (2014) to 30.8% (2018). The average pooled return of the eight vintages (2011–18) was 15.1%, a nearly 16% decrease from the average return of the key vintages in the emerging markets index last year. The strong performance by 2018 vintage funds was driven in large part by write-ups in the IT sector, and to a lesser extent, in the consumer discretionary sector. Across sectors, funds formed in the worst-performing vintage, 2014, had mixed results; industrials, IT, and financials were written up, and consumer discretionary valuations were substantially written down. All but the two most recent meaningfully sized vintages (2017–18) experienced write-downs in the consumer discretionary sector, likely a reflection of the continuing fight against COVID-19 in many countries and China’s zero-tolerance policy (the largest constituent of the emerging markets PE/VC benchmark).
LP Cash Flows
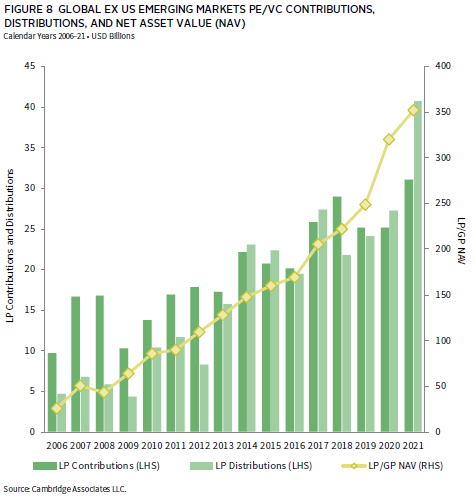
Emerging markets PE/VC funds had a banner year for cash flows. During 2021, funds called $31.0 billion from investors, a 23% increase from the previous year (Figure 8) and the highest year on record for dollars called since the inception of the index. Distributions also set a record as managers returned $40.8 billion in capital to investors, 49.4% more than in 2020. Compared to the managers in the developed markets index, emerging markets funds have seen far fewer distributions—both in absolute terms as well as when expressed as a percentage of NAV (distribution yield)—but a more consistent increase in PE/VC investment activity year-over-year. While the relative difference might be explained by the emerging markets index’s overweight in VC and its smaller size, the consistent investment activity more convincingly reflects a growing appetite for these regions.
Funds raised in 2017–20 were responsible for most of the capital called in 2021, amounting to $25.4 billion and representing almost 82% of the total. Each called at least $4.3 billion; the largest three vintages were 2017–19, which called more than $5 billion each, and 2018 led the pack with calls totaling more than $10 billion.
Notably, funds in 12 vintages (ranging from 2007–18) distributed more than $1 billion, indicating the older vintages were able to sell some of their long-held investments. The trend of funds older than ten years distributing significant amounts of capital is a continuation from prior years. Further illustrating this point, funds raised in 2007 and 2010–11 distributed more than 36% of the total capital returned to investors during the year, with 2012 vintage funds accounting for another 12%.
Sectors
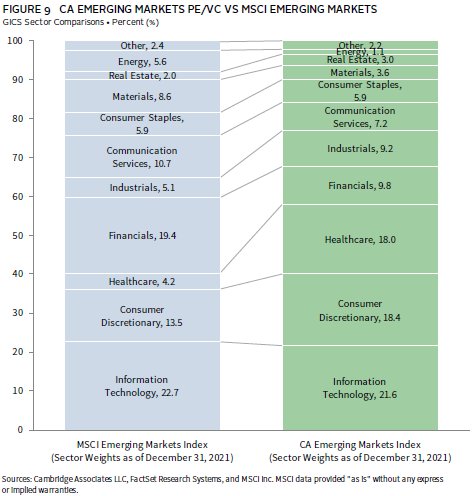
Figure 9 shows the GICS sector breakdown of the Emerging Markets PE/VC Index and a public market counterpart, the MSCI Emerging Markets Index. The breakdown provides context when comparing the performance of the two indexes. The chart highlights the relative overweights in the PE/VC index in healthcare and consumer discretionary and the underweights in financials and communication services. At the end of 2021, IT became the largest sector in the index, reaching 21.6% and overtaking consumer discretionary at 18.4%. Healthcare (18.0%) was a close third; these three sectors now account for almost 60% of the index.
Six of the seven meaningfully sized sectors posted positive results for the year; consumer discretionary was the exception (Figure 10). Performance across the key sectors ranged from -17.2% (consumer discretionary) to 36.0% (IT), and five of the seven sectors posted double-digit returns. IT edged out the next best sectors, financials and industrials, which returned 33.9% and 29.7%, respectively. Write-ups in IT were fairly widespread, with 80% attributed to funds formed in 2011, 2014, and 2016–18. Write-ups in financials and healthcare were more concentrated by vintage: 2004, 2014, and 2016 in financials and 2012 and 2016 in healthcare. Returns in consumer discretionary were pulled down mostly by write-downs in one vintage, 2014, which in turn were hurt most by investments in China, the largest country in the emerging markets benchmark by market value. China posted nearly $15 billion in write-downs in consumer discretionary during 2021. On a gross USD-weighted basis, the three largest sectors by market value—IT, consumer discretionary, and healthcare—returned 7.2% during the year. During the same period, the remaining four meaningfully weighted sectors returned 21.2%.
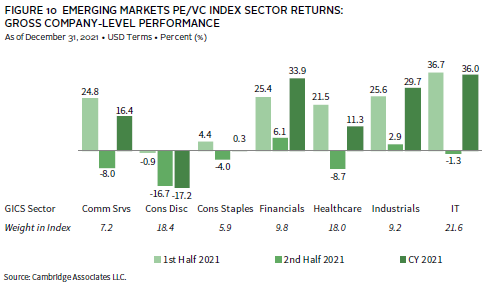
The investment pace in 2021 was roughly the same as in the previous year, in aggregate. Companies across five sectors (in rank order: healthcare, IT, consumer discretionary, industrials, and consumer staples) garnered 80% of the capital invested, with healthcare and IT alone attracting 47% of all capital. Over the long term, managers in the emerging markets index have allocated 68% of their capital to these five sectors, with 27% going to healthcare and IT. Healthcare and IT attracted 24% and 23%, respectively, of the capital invested during the year, 10% more than their long-term norms of 14% and 13%; the two sectors tied for the biggest deviation above the long-term trend during the year. On the flip side, consumer discretionary attracted 13% of the capital invested during the year; about 7% less than its long-term level, and the largest deviation below the norm of any sector.
Countries
Highlighting the index’s geographic concentration, China remained, by far, the largest country component of the index (Figure 11). The index did become less concentrated last year, with China constituting almost 7% less of the index at the end of 2021 than at the end of 2020, due mostly to poor performance in 2021. India and South Korea continued to be meaningfully sized, and as of the end of 2021, the United States constituted 7.4% of the index. (Funds in the emerging markets PE/VC benchmark occasionally invest in companies in developed markets countries, as well as those in the emerging markets regions.) Three other countries—Singapore, Hong Kong, and Japan (from low to high)—represented between 3.9% and 4.7% of the index.
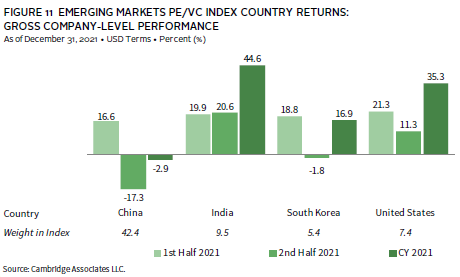
Other than China, the meaningfully sized countries in the index posted double-digit returns in 2021. Performance ranged from -2.9% (China) to 44.6% (India). For companies in China, significant write-downs in the 2014 vintage funds overshadowed modest write-ups across other vintages during the year. Notably, the 2014 vintage was the biggest positive return driver in 2020, having accounted for nearly 40% of all write-ups in Chinese companies driven by investments in companies that went public in recent years. For companies based in India, write-ups in three vintages (2016–18) accounted for 64% of the total valuation increase for the year. Dragged down by negative performance in China, the calendar year gross weighted return for the four countries was 7.3%, almost 34% lower than the return for 2020.
For the year, businesses in China, India, the United States, and South Korea (in rank order) each garnered more than $1.0 billion of invested capital and, together, accounted for more than 70% of the capital deployed. Over the long term, these same countries attracted about 56% of invested capital, with increases in capital to companies based in all but India making up for the difference; India was nearly in line with its long-term level. Despite ongoing geopolitical tensions, nearly 48% of the capital invested in 2021 went into China-based companies, above the long-term average of 35% and once again the highest amount of any country. India and the United States received the second- and third-most invested capital, at 9% and 8%, respectively, compared to their long-term norms of 9% and 6%.
Figure Notes
Global ex US Private Equity and Venture Capital Index Returns
The PE/VC indexes are pooled horizon internal rates of return and are based on limited partners’ fund-level performance; the returns are net of fees, expenses, and carried interest. Because the indexes are capitalization weighted, performance is mainly driven by the largest vintage years.
Public index returns are shown as both time-weighted returns (average annual compound returns) and dollar-weighted returns (mPME). The CA Modified Public Market Equivalent replicates private investment performance under public market conditions. The public index’s shares are purchased and sold according to the private fund cash flow schedule, with distributions calculated in the same proportion as the private fund, and mPME net asset value is a function of mPME cash flows and public index returns.
Vintage Year Returns
Vintage year fund-level returns are net of fees, expenses, and carried interest.
Sector Returns
Industry-specific, gross company-level returns are before fees, expenses, and carried interest.
GICS® Sector Comparisons
The Global Industry Classification Standard (GICS®) was developed by and is the exclusive property and a service mark of MSCI Inc. and S&P Global Market Intelligence LLC and is licensed for use by Cambridge Associates LLC. As a result of the GICS sector definition changes in 2018, the makeup of the private and public indexes changed and, in some cases, impacted the relative over and underweights in the private index. The newest sector, communication services, largely includes companies formerly designated as telecommunications, consumer, and IT. “Other” includes sectors that make up less than 3% of the CA benchmark.
About the Cambridge Associates LLC Indexes
Cambridge Associates derives its Developed Markets (ex US) Private Equity and Venture Capital Index from the financial information contained in its proprietary database of global ex US private equity and venture capital funds. As of December 31, 2021, the database consisted of 999 global ex US developed markets buyouts, growth equity, and venture capital funds formed from 1986 to 2021 with a value of about $558 billion. Ten years ago, as of December 31, 2011, the benchmark index included 603 global ex US developed markets funds, whose value was roughly $224 billion. The funds in this index invest primarily in developed markets in Australia, Canada, Israel, Japan, New Zealand, Singapore, and Western Europe.
Cambridge Associates derives its Emerging Markets Private Equity and Venture Capital Index from the financial information contained in its proprietary database of global ex US buyouts, growth equity, and venture capital funds. As of December 31, 2021, the database consisted of 763 emerging markets PE/VC funds formed from 1986 to 2021 with a value of about $352 billion. Ten years ago, as of December 31, 2011, the benchmark index included 451 emerging markets funds, whose value was about $90 billion. The funds in this index invest primarily in Africa, emerging Asia, emerging Europe, Latin America & Caribbean, and the Middle East ex Israel.
The pooled returns represent the net periodic rates of return calculated on the aggregate of all cash flows and market values as reported to Cambridge Associates by the funds’ general partners in their quarterly and annual audited financial reports. These returns are net of management fees, expenses, and performance fees that take the form of carried interest.
About the Public Indexes
The MSCI All Country World Index (ACWI) is a free float–adjusted, market capitalization–weighted index designed to measure the equity market performance of developed and emerging markets. As of December 31, 2021, the MSCI ACWI consisted of 48 country indexes comprising 23 developed and 25 emerging markets country indexes. The developed markets country indexes included are: Australia, Austria, Belgium, Canada, Denmark, Finland, France, Germany, Hong Kong, Ireland, Israel, Italy, Japan, the Netherlands, New Zealand, Norway, Portugal, Singapore, Spain, Sweden, Switzerland, the United Kingdom, and the United States. The emerging markets country indexes included are: Argentina, Brazil, Chile, China, Colombia, Czech Republic, Egypt, Greece, Hungary, India, Indonesia, Korea, Malaysia, Mexico, Peru, the Philippines, Poland, Qatar, Russia, Saudi Arabia, South Africa, Taiwan, Thailand, Turkey, and the United Arab Emirates.The MSCI EAFE Index is a free float–adjusted, market capitalization–weighted index that is designed to measure large- and mid-cap equity performance of developed markets, excluding Canada and the United States. As of December 31, 2021, the MSCI EAFE Index consisted of the following 21 developed markets country indexes: Australia, Austria, Belgium, Denmark, Finland, France, Germany, Hong Kong, Ireland, Israel, Italy, Japan, the Netherlands, New Zealand, Norway, Portugal, Singapore, Spain, Sweden, Switzerland, and the United Kingdom.
The MSCI Emerging Markets Index is a free float–adjusted, market capitalization–weighted index that is designed to measure large- and mid-cap equity performance of emerging markets. As of December 31, 2021, the MSCI Emerging Markets Index included 25 emerging markets country indexes: Argentina, Brazil, Chile, China, Colombia, Czech Republic, Egypt, Greece, Hungary, India, Indonesia, Korea, Malaysia, Mexico, Peru, the Philippines, Poland, Qatar, Russia, Saudi Arabia, South Africa, Taiwan, Thailand, Turkey, and the United Arab Emirates.The MSCI World Index represents a free float–adjusted, market capitalization–weighted index that is designed to measure the equity market performance of developed markets. As of December 31, 2021, it includes 23 developed markets country indexes: Australia, Austria, Belgium, Canada, Denmark, Finland, France, Germany, Hong Kong, Ireland, Israel, Italy, Japan, the Netherlands, New Zealand, Norway, Portugal, Singapore, Spain, Sweden, Switzerland, the United Kingdom, and the United States.
About Cambridge Associates
Cambridge Associates is a global investment firm with 50+ years of institutional investing experience. The firm aims to help pension plans, endowments & foundations, healthcare systems, and private clients achieve their investment goals and maximize their impact on the world. Cambridge Associates delivers a range of services, including outsourced CIO, non-discretionary portfolio management, staff extension and alternative asset class mandates. Contact us today.