A Stronger Union: Addressing the Unique Investment Challenges of Multiemployer Defined Benefit Plans

Adaptive and sophisticated strategies are necessary to serve the unique features, constraints, and needs of multiemployer plans
- For most plans, market-based returns on their own will likely be too low over the next decade to close the asset-liability gap. Across asset classes, active management and the relentless pursuit of alpha are crucial to generating needed returns.
- Private investments could be the single biggest driver of asset return for many plans, but only if the best investment managers within this diverse and opaque space can be identified.
- Active management and private investments come in many forms and involve a number of complexities. Consequently, individual investment strategies and the entire portfolio should be tailored to each plan’s specific participant demographics, economic conditions, and risk tolerances.
- Use of these sophisticated strategies can introduce heightened illiquidity, volatility, and drawdown risks. Long-term success requires effective approaches to designing, executing, and monitoring these strategies, and diligently managing their risks.
Although virtually all defined benefit plans face daunting challenges, multiemployer plans are in a class of their own. These plans are characterized by a unique regulatory environment, distinctive organizational structures, and, often, deep underfunding in combination with uncertain contribution prospects. These factors, as well as the current low-return environment, make each plan’s investment strategy ever more important. In this note, we first explore some of the key challenges that many multiemployer plans face. Next, we discuss how to invest in light of these challenges, focusing on asset allocation, manager selection, risk management, and effective execution. We conclude with some thoughts on governance and the overall role of the investment advisor in the multiemployer context.
Challenges and Considerations
Since the enactment of the Taft-Hartley Act in 1947, multiemployer defined benefit plans have enabled millions of union members to earn pension benefits over the course of their careers while working for various employers. Though union representation has declined substantially over the last 30 years, 1 approximately 1,400 multiemployer plans still operate today, covering roughly 10.4 million participants across a wide variety of industries (Figure 1).
Figure 1. Plan Participants by Industry
2013 • 10.4 Million Participants
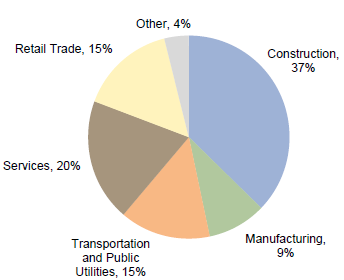
Note: “Other” includes agriculture, information, mining, and wholesale trade.
Of the many considerations in the multi-employer landscape, 2 four key aspects of these plans create particular challenges in developing effective investment strategies:
- committee composition and governance;
- significant, but not always obvious, plan underfunding;
- demographic limitations on investments; and
- inability to improve funded status through contributions or plan re-design.
Balancing the diverse needs of various employers and members often leads committees to struggle with making complex investment decisions and ensuring their timely execution. A multiemployer plan is overseen by a committee of union members and employer representatives; by its nature, this setup can create governance challenges due to member-management relations. These challenges can be further magnified by the fact that employer trustees represent many participating employers rather than a single employer, each of which may have different operating objectives and constraints that evolve over time. Similarly, union trustees represent different member groups, including retirees, former employees, and active participants, who also may have differing concerns and risk preferences.
Multiemployer plans’ asset-liability deficits may often be larger than established measures might suggest, and can create an especially pressing need for return generation. For multiemployer plans, the primary measure of plan solvency is the Pension Protection Act (PPA) zone. The PPA zone—green (healthy), yellow (endangered), orange (seriously endangered), or red (critical)—reflects the plan’s current funded status and projected cash flow position over the next five to ten years. In general, the majority of plans in the green zone have a PPA funded status of at least 80%; those in the yellow or orange zone, 65%–79%; and those in the red zone, less than 65%.
According to this classification more than half of all plans appear “healthy” (Figure 2), but the reality is more complex. This is because the PPA zone funded status reflects pension liabilities discounted at the plan’s expected long-term investment return assumption. Given the low-return environment, funded status determined using current bond yields (which are used for corporate plans) or investment return assumptions that reflect current market valuations can help trustees make more informed decisions.
By these measures, funded status is roughly 20 percentage points (ppts) lower than reported (a more detailed explanation is provided in the sidebar). Indeed, the Society of Actuaries’ most recently published estimates indicate aggregate funded status for multiemployer plans of 76% using the plans’ selected expected investment return assumptions, and only 47% using Treasury yields. Of course, the differences resulting from these two measures will vary by plan, depending, for instance, on plan duration and return assumptions used. Thus, it may be prudent for trustees to assess their funded status using multiple metrics in order to ascertain the size of the asset-liability gap for their specific plan.
Computing Funded Status
Determining a multiemployer plan’s realistic state of health is complicated by the long-term expected return assumption method with which these plans’ funded status is calculated, especially in the current low-return, low interest rate environment.
Consider, as an example, a multiemployer plan that is 78% funded, has a duration of 15 years, and uses a long-term expected return discount rate of 7.5%. To estimate its funded status on a mark-to-market basis, the Citigroup Pension Liability Index—Intermediate Duration provides a useful proxy of a typical pension liability valued with Aa corporate bond yields and having a duration of 15 years. As of December 31, 2016, the discount rate for this index was 4.0%. Using duration as an approximation for the impact of discount rate changes, the liability discounted at 4.0% would be 15 times 3.5%, or about 50% higher than the liability discounted at 7.5%. This means that the mark-to-market funded status is 51%, or 27 ppts lower than reported.
Alternatively, a pension plan may have an asset allocation of 50% global equities, 25% fixed income, 12.5% private equity, and 12.5% hedge funds. Using the capital market assumptions shown in Figure 4, this plan would have an expected return of 4.9% (before manager alpha). Again, using the duration approximation, this yields a funded status of 56%, or about 20 ppts lower.
The impact of the discount rate change is generally smaller for plans with shorter durations and larger for plans with longer durations.
Figure 2. Plan Participants by PPA Zone
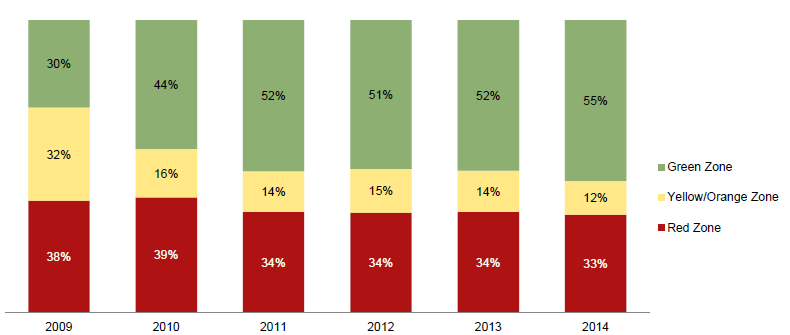
Note: Yellow includes yellow and orange zone status classifications.
The demographic profiles of most multiemployer plans likely will cause rising net asset outflows, reinforcing the need for higher returns but also requiring rigorous liquidity management. Since employer contributions usually are determined by the number of hours worked by active plan participants, and not by a single well-defined formula as is the case for corporate plans, demographics have especially important implications for multiemployer plans. As a whole, union plans have declining active, and growing retiree, populations (Figure 3). Thus, even if collective bargaining leads to higher contribution rates, this demographic imbalance, coupled with complex contributions math, creates a rising cash flow challenge.
Figure 3. Multiemployer Plan Demographics
2000–13
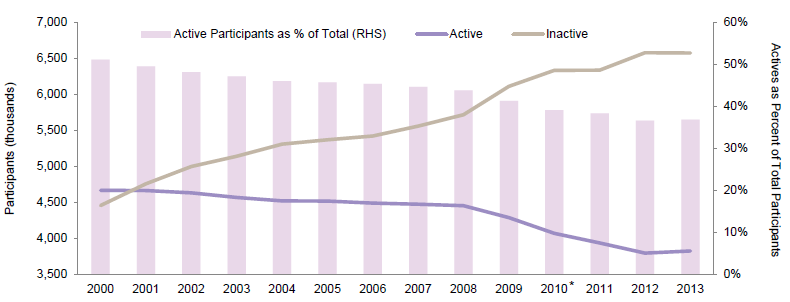
Source: Pension Benefit Guarantee Corporation 2014 Databook.
Note: Due to rounding of individual items, percentages may not add up to 100%.
Even when trustees have attempted to shore up funded status by increasing contributions and/or reducing benefits, implementation has had mixed results, in part due to the application of unrealistic assumptions. For example, though plans in the red (critical) zone have adopted legally mandated rehabilitation plans, the number of participants in red-zone plans has remained relatively stable over the past five years (Figure 2). Moreover, according to the Department of Labor, in 2016, 75 plans declared “critical and declining status” (meaning they are likely to deplete assets within the next 10–20 years, subject to certain other conditions) and 12 filed to reduce benefits under the Multiemployer Pension Reform Act of 2014 (MPRA).
In the MPRA applications, the Department of the Treasury has been particularly clear about using “reasonable” investment return assumptions. The department rejected two MPRA applications, citing expected investment return assumptions of 7.25%–7.50% as being “significantly optimistic” and “unreasonable,” especially over the near-term time horizon. In another case, where the application was accepted, expected investment returns for the next decade were quite muted, starting out at 4.8% in 2016–17 and rising to 7.4% in 2025–26. 3 All of this suggests that trustees need to be more realistic about what the market can deliver, especially in the near term.
These challenges may be overcome, but not without thoughtful, careful, and coordinated efforts. To help realize the necessary returns and address multiemployer plans’ multiple other challenges, trustees need a customized, goal-oriented investment strategy that is efficiently and expertly implemented. In today’s low-return environment, we believe that closing the asset-liability gap means going beyond traditional asset classes; long-only equities and core fixed income simply aren’t likely to cut it (Figure 4). The ten-year prospective market return for a typical portfolio that is 60% global equities and 40% core fixed income is only 4.5%, or 3% below a typical target return of 7.5%. 4
Figure 4. Nominal Prospective Ten-Year Market Returns: Return to Normal Scenario
As of December 31, 2016

Notes: Our return to normal scenario incorporates current valuations and assumes equity valuations revert to fair value over ten years. This scenario makes assumptions about the market environment including mild inflation; moderate real earnings growth; and low corporate default rates, government bond yields, and credit spreads. All projections are in local currency terms and are intended to represent total returns. Projected hedge fund returns are the average returns for equity hedge funds and absolute returns asset classes as defined by particular HFRI indexes. The return projection for private equity/credit is shaded to reflect that it is not calculated using the same “bottom up” methodology as the other asset classes. The private equity return is calculated as the projected global equity return plus 2%. The private credit return is calculated as the projected US high yield return plus 2%.
Achieving the necessary total portfolio return will likely require taking advantage of all available asset classes and seeking—and securing—differentiated asset managers focused on alpha generation. In doing so, it will be important to keep in mind that potential manager value-add varies greatly among asset classes, being highest in private equity and lowest in fixed income. And, as discussed further in the following section, managing risk with discipline and acuity is an important part of this equation as well.
Investment Strategy
Bearing in mind the challenges multiemployer plans face, these steps are critical to the successful development and execution of investment strategy:
- review and evaluate plan characteristics, trustee objectives, and committee dynamics;
- decide on asset allocation, including balancing the exposure to alternative investments with the plan’s liquidity needs;
- focus on alpha generation through manager selection, portfolio construction, and risk management; and
- develop a plan for effective ongoing implementation, monitoring, and governance.
Plan Characteristics, Objectives, and Dynamics. The first step in the investment process is an assessment of trustees’ objectives, risk tolerance, and outlook for the plan. Since virtually no committee is composed entirely of professional investors, and since multiemployer plan stakeholders often have differing points of view and priorities, committee education and expectation setting are a substantial part of this process. An investment advisor can play an important role by connecting the investment options available in the capital markets to the benefits and risks these options can provide to the plan. Generally speaking, plans with wind at their back—e.g., those that exhibit a higher funded ratio, a large and young active membership, moderate benefit payments (relative to assets), higher contribution levels, and/or lower contribution volatility—can take on more risk. Ultimately, they can withstand asset return volatility, illiquidity lock-ups, sharp market downturns, and contribution declines. Knowing that they do not need to take on significant risk, however, these plan trustees must decide how much incremental risk is appropriate.
Unfortunately, most plans do not exhibit such favorable characteristics and instead must take on greater risk to improve their funding position; however, higher risk also implies a heightened possibility of insolvency. The degree of risk- taking truly depends on each specific plan’s circumstances; not all plans will be able to take on the risk commensurate with the returns required to achieve full funding. Indeed, a poorly funded plan consisting almost entirely of retirees (and therefore expecting low contributions) is potentially better served by a more conservative asset allocation that prevents large drawdowns and preserves benefits for as long as possible, than by an aggressive strategy that aims to close the asset-liability gap but may result in a catastrophic drawdown during a sharp recession. In both cases, PBGC guarantees would apply once the plan exhausts its assets, so it’s a question of when and with what probability this would occur. 5 Trustees must understand the choices—and associated risks—available to them.
Asset Allocation, Including Private Investments. Following the review of plan characteristics, trustee objectives, and risk tolerance, the committee, with the guidance of its investment advisor, can move on to the asset allocation decision. Among all of the investment decisions a committee makes—including manager selection, rebalancing, and tactical shifts—asset allocation is usually the biggest driver of pension fund risk and return. Accordingly, the committee should recognize the long-term importance of this decision and hold itself accountable.
Beyond the general determinants of asset allocation (described in the previous section), any specific portfolio under consideration should be rigorously modeled and stress tested in tandem with the plan’s liabilities and contributions. In particular, while trustees should certainly evaluate the return potential of specific asset classes versus their volatility, drawdown, and liquidity characteristics, they should also review short-term and long-term deterministic and stochastic modeling in light of the liabilities. In other words, the modeling should include the plan’s funded status, cash flow and resulting implications for zone status, funding improvement or rehabilitation plans, contributions, and, in the case of extreme risk scenarios, entire benefit structure.
See David Shukis and David Thurston, “The 15% Frontier,” Cambridge Associates Research Report, 2016. Although the focus of this paper is on foundations and endowments, the lessons of the paper apply to all investors.
An important asset allocation decision is the inclusion—or exclusion—of private investments. Though certainly less liquid and more complex than long-only equities and fixed income, private investments are well worth trustees’ consideration due to the sizeable returns they can deliver. Our research shows that over the past 10–20 years, endowed institutions with at least a 15% allocation to private investments have consistently outperformed their peers. Looking forward, we believe that in the expected low-return environment these strategies have the greatest prospect of generating strong investment returns.
Private investments include a wide collection of strategies, each with different objectives and attributes. Digging deeper, for instance, private equity focuses on capital appreciation through illiquid positions in a variety of businesses, from early-stage start-ups (i.e., venture capital) to mature companies, typically with a fund life of 10–12 years. With a somewhat shorter fund life of 6–12 years, private credit encompasses an array of strategies that can be characterized as return maximizing (including capital appreciation mezzanine strategies and those targeting distressed debt), capital preserving (including traditional mezzanine and direct lending), and either one depending on the asset targeted (credit opportunities funds and specialty finance, which encompasses investments in aircraft leases and entertainment, pharmaceutical, and other kinds of royalties, among other assets). Unlike private equity, private credit typically has both income and appreciation components. Over the past ten, 15, and 20 years, global private equity funds have outperformed the global public equity markets by 480 basis points (bps) to 710 bps (Figure 5). Over the past ten years, direct lending funds have outperformed high-yield bonds by 210 bps, a significant value-add. 6
Figure 5. Comparing Private and Public Historical Index Returns
As of September 30, 2016 • Annualized
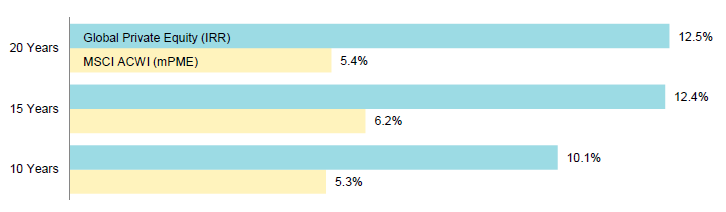
Notes: Cambridge Associates mPME methodology replicates private investment performance under public market conditions and allows for an appropriate comparison of private and public market returns. The mPME analysis evaluates what return would have been earned had the dollars invested in private investments been invested in the public market index instead. Total return data for the MSCI ACWI are gross of dividend taxes through fourth quarter 2000 and net of dividend taxes thereafter.
Although carefully selected private investments offer very attractive return potential (net of fees), decisions about their inclusion should reflect plan size and projected liquidity needs. Each type of private investment fund has a distinct liquidity profile and specific cash flow characteristics. For example, at one extreme is venture capital, with no yield and unpredictable cash flows (both commitments and return of capital), and at the other extreme is direct lending, with a large current income component and a more predictable, bond-like cash flow profile (Figure 6). Trustees often underestimate their plan’s tolerance for private investments by assuming that all strategies exhibit the liquidity profile of the most illiquid end of the private investment spectrum.
Figure 6. Key Characteristics of Private Investments
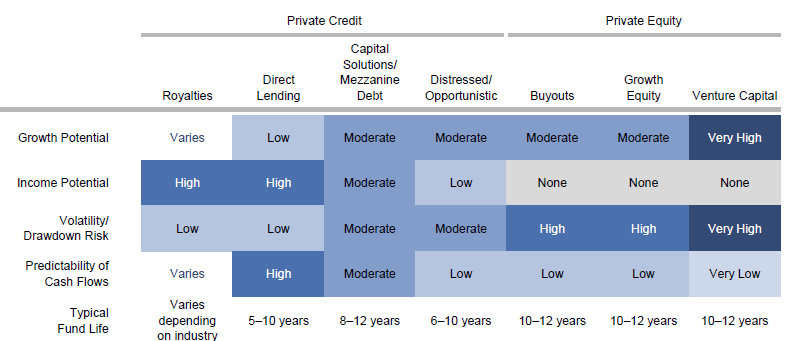
Note: This is a partial list of common private investment strategies and their general characteristics; a specific strategy will have its own unique characteristics that may be different from those shown here.
Thus, extensive asset and liability cash flow modeling and stress testing over a ten- to 15-year horizon is critical to determine: the appropriate target weight to private investments; the types of private investments to include; the pacing of commitments to these strategies; and the implications for the rest of the asset allocation. For example, a plan with economically sensitive contributions and relatively large outflows would likely be more focused on income-oriented, shorter lock-up private credit. Alternatively, a barbell approach could be employed, with an allocation to private equity and a larger allocation to liquid, core fixed income.
Clearly, asset allocation decisions are critical to plan success, but they are also complicated and must be expertly fashioned to serve the unique circumstances of each plan. In the case of a relatively healthy plan, the decision may be more or less straightforward; for a struggling plan, it may be less clear. In the Appendix, we provide an example of asset allocation considerations and solutions for two plans.
Alpha Generation. The third aspect of a successful investment strategy is alpha generation, achieved mainly through active management. Although certainly not all active managers outperform, and certainly not over all time horizons, most multiemployer plans, due to their underfunding, simply cannot afford to invest passively and leave potential alpha on the table. This is especially true during economic downturns, in which a “perfect storm” of poor market returns and lower employment—in other words, lower contributions and potentially higher retirements—can wreak havoc on these benefit plans.
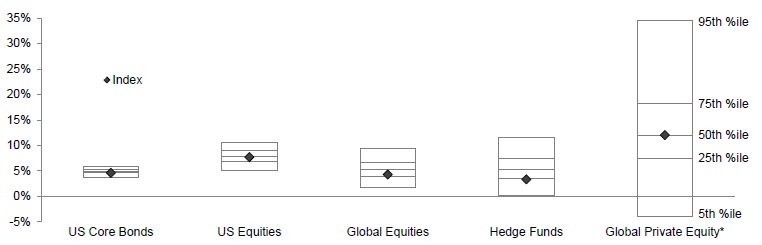
As the inefficiency and complexity of asset classes increase, so does the opportunity to add alpha, as does the dispersion of manager returns (Figure 7). For example, within US equities, the middle 50% of ten-year manager returns through December 31, 2016, (September 30, 2016, for private equity) were within a 2.1 ppt band, as compared to 2.8 ppts, 4.0 ppts, and 10.8 ppts for global equities, hedge funds, and private equity, respectively.
Figure 7. Range of Ten-Year Manager Returns by Percentile
As of December 31, 2016
Sources: Bloomberg L.P., Barclays, Cambridge Associates LLC, Frank Russell Company, Hedge Fund Research, Inc., and MSCI Inc. MSCI data provided “as is” without any express or implied warranties.
Notes: Range of ten-year manager returns for US core bonds, US equities, global equities, and hedge funds use Cambridge Associates LLC’s (CA) Manager Universe Statistics, which are derived from CA’s proprietary database covering investment managers. Managers that do not report in US dollars, exclude cash reserves from reported total returns, and have less than $50 million in product assets are excluded. Performance results are generally gross of investment management fees (except hedge funds, which are generally net of management fees and performance fees). As a proxy for fees we have added 30 bps to the index returns for core bonds, 60 bps to the index returns for US equities, and 70 bps to the index returns for global equities. To be included in analysis of any period longer than one quarter, managers must have had performance available for the full period. Manager returns for global private equity managers are pooled horizon internal rate of return (IRR) calculations, net of fees, expenses, and carried interest. Global private equity data represent mature funds (vintage years 2006 through 2010). Performance results for private investment managers for which the IRR is unavailable, or not able to be calculated, are not included. The timing and magnitude of fund cash flows are integral to the IRR performance calculation. Manager returns for public asset classes are average annual compounded return (AACR) calculations, which are time-weighted measures over the specified time horizon, and are shown for reference and directional purposes only. Due to the fundamental differences between the two calculations, direct comparison of IRRs to AACRs is not recommended. Manager returns for global private equity are as of September 30, 2016. The indexes are Bloomberg Barclays US Aggregated Bond (for core bonds), Russell 3000® (for US equities), MSCI ACWI (Net) (for global equities), HFR Fund-Weighted Composite (for hedge funds), and the median of the private equity universe described above (for private equity). Total return data for all MSCI indexes are net of dividend taxes.
While Figure 7 shows that there are opportunities to add significant alpha (net of fees), it also highlights the importance of thorough research and monitoring to select managers likely to deliver this critical result on a consistent basis. This is particularly important for private investments. First, there is simply no way to invest passively in privates. Second, manager dispersion is extremely wide, strategies are very diverse and often complex, and access is quite constrained. As a result, rigorous due diligence and experience in selecting best-in-class managers in this space are crucial.
Beyond manager-level alpha, investors can add alpha at the total portfolio level through fee negotiation, portfolio construction, risk management, and tactical asset allocation. Fee negotiation is obvious—once a strategy is underwritten, a reduction in fees is automatically an increase in potential alpha. (Investors should be sure that they are paying appropriate fees for the expected return.) Effective portfolio construction uses careful analysis of manager investment styles and correlations in various market scenarios to help position the entire portfolio to achieve alpha, with managers providing adequate diversification, and not simply “cancelling out” each other’s contributions. Risk management—including rebalancing, firing and hiring, and management of manager and asset class exposures—reduces portfolio drift and helps capture incremental alpha. Finally, being nimble and applying modest tactical shifts at times of extreme market dislocations, though admittedly challenging to do, can further improve returns.
Implementation, Monitoring, and Governance. A well-crafted investment strategy on its own does not guarantee investment success. Equally critical to achieving required outcomes is execution, not only initially but also continuously, including monitoring and adjustment in light of market movements, manager behavior, plan changes, economic conditions, and the regulatory environment.
Studies have suggested that investors, even institutional investors, invested in a given strategy often do not achieve that strategy’s published investment returns for any number of reasons, including not being fully invested at all times, trading too frequently, and not rebalancing in a timely fashion. This is true especially when employing active strategies due to behavioral biases, such as the inability to maintain conviction in underperforming managers. 7 Multiemployer plans particularly encounter challenges in this area, since committees typically meet quarterly, represent so many different interests, and can deliberate extensively. By the time decisions are made, certain investment opportunities often either disappear (e.g., private equity funds close) or become less attractive (e.g., lowest-fee share classes become unavailable or asset classes become overvalued). Moreover, as crucial as it is to successful execution, risk management—even in the form of simple rebalancing—often becomes less effective, given union plans’ unique governance structures. Consequently, committees must develop a close and trusting relationship with their investment advisor, streamline their meetings, make decisions in a diligent but timely manner, and consciously combat their behavioral biases.
One way to achieve effective execution and avoid these challenges is by appointing the investment advisor as a discretionary manager, either on a fully or semi-delegated basis. 8 In this setup, trustees approve the overall portfolio investment policy, asset allocation, and risk parameters. They also monitor the investment advisor, but delegate to the advisor the day-to-day investment decisions, including the hiring and firing of asset managers, allocation of capital between managers, rebalancing, and other investment-related tasks. In addition to efficient implementation and disciplined risk management, we believe this approach improves the likelihood of generating strong investment returns. Thus, it can help allay some of the member/employer tensions that are inherent in the multiemployer structure, reduce the administrative burdens of the fund staff, enable trustees to focus on the bigger picture, and avoid conflicts of interest that can potentially occur between managers and trustees.
Finally, because the investment strategy is so closely linked with virtually all other aspects of running the plan, we believe that the investment advisor should be broadly involved in committee governance, in partnership with other service providers, including the actuary, auditor, and ERISA (Employee Retirement Income Security Act) attorney. This partnership can take the form of evaluating existing rehabilitation and/or funding improvement plans; selecting realistic capital market assumptions for actuarial modeling (funding standard account projections, zone determinations, and contribution-setting under collective bargaining); assessing whether benefit increases, even if only to account for inflation, are affordable; and applying for MPRA relief, if applicable. This collaboration helps ensure that trustees are receiving comprehensive and consistent advice and are able to make well-informed decisions.
Conclusion
The health of multiemployer plans today hinges on recognizing these plans’ unique features, constraints, and needs; creating responsive and sophisticated strategies to serve them; realizing strong investment returns; and achieving effective plan governance. To address these objectives, investment strategies that focus on the highest-returning segments of the investment universe (particularly private investments) the relentless pursuit of alpha at both manager and portfolio levels, and diligent risk management are fundamental. Achieving strong investment results also may require significant changes to plan governance, particularly to the investment decision-making process and execution. For many plans, appointing an investment advisor with some degree of delegated authority may yield the best results. Ultimately, to secure success, trustees of multiemployer plans will need an advisor who can serve not only as an investment strategist and co-fiduciary, but also as a key strategic partner with respect to the overall plan. ■
Appendix
Asset Allocation—A Tale of Two Plans
We illustrate our approach to asset allocation with two examples, a green zone plan with reasonable demographics and strong contribution potential, yet subject to event risk, and a red zone plan with challenging demographics and a projected accumulated funding deficiency within five years. Key metrics for each of these plans are provided in Appendix Figure 1.
Appendix Figure 1. Characteristics of Sample Plans
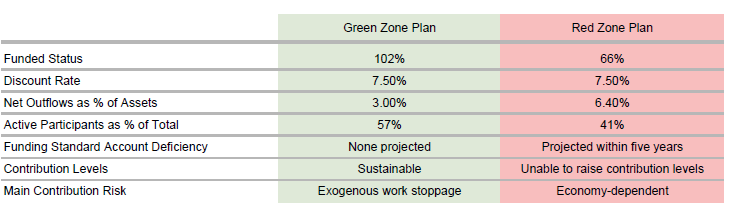
Qualitatively, it is clear that the green zone plan is relatively healthy and can take on both volatility and illiquidity risks. The red zone plan, on the other hand, faces a stark choice between (1) an aggressive asset allocation that has the potential to close the asset-liability gap but may accelerate insolvency in the case of a market downturn, and (2) a conservative asset allocation that will almost surely result in eventual insolvency, albeit at a later date.
A reasonable asset allocation for the green zone plan would consist of 75% in growth assets, including 45% in global equities and 30% in private investments; 10% in hedge funds to dampen volatility; and 15% in fixed income, also to dampen volatility and provide liquidity in times of crisis (Appendix Figure 2). Since the plan clearly can take on illiquidity and drawdown risks, the private investment exposure is aggressive, with one-third each in venture capital, buyouts, and a combination of distressed and opportunistic private credit. This strategy is expected to comfortably achieve expected returns under equilibrium conditions, but in the current market environment, manager value-add (in excess of public market returns and beyond median fund returns in private investments) is clearly necessary to approach the expected return target of 7.5%. Even then, trustees should be prepared for lower returns in the near future.
Appendix Figure 2. Potential Asset Allocations and Return Expectations for the Red and Green Plans
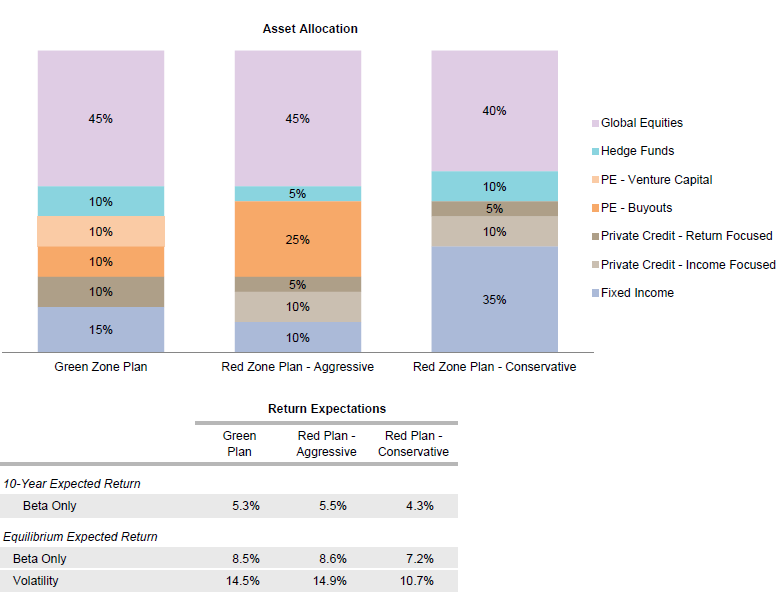
Notes: The ten-year expected returns use our return to normal scenario as of December 31, 2016. This scenario makes assumptions about the market environment including mild inflation; moderate real earnings growth; and low corporate default rates, government bond yields, and credit spreads. Equilibrium expected returns and volatility use our equilibrium assumptions. These assumptions represent a base case of long-term equilibrium real returns that are independent of current valuations, are targeted toward a generic 25-year-plus time horizon, and incorporate a reasonable equity risk premium.
For the red zone plan, two potential “book-end” options are an aggressive allocation with 80% in growth assets and a conservative allocation with 55% in growth assets. Because liquidity is so important for this plan, unlike the green zone plan’s strategy, private investments here must be more conservative; there is no allocation to venture capital, and private credit is composed entirely of a diversified portfolio of senior loans with set maturities. This reduces volatility and drawdown risks and provides larger and more predictable cash flows. Moving toward the more conservative allocation reduces both the return potential and the average time to insolvency, but it also decreases volatility and the probability of insolvency in a sharp economic downturn.
Before deciding on an asset allocation, red zone plan trustees should consider reducing benefits under MPRA, especially if a particular return target appears too risky. An investment advisor, together with the plan’s actuary, can help trustees weigh the trade-off between greater investment risk and lower benefits, and develop reasonable and equitable guidelines around these issues. Over time, the investment policy should be optimized to take into account the magnitude and timing of any plan changes so as to achieve the best possible results for all plan participants.
Index Disclosures
Broad-based securities indexes are unmanaged and are not subject to fees and expenses typically associated with managed accounts or investment funds. Investments cannot be made directly in an index. Past performance is no guarantee of future results.
Bloomberg Barclays US Aggregate Bond Index
The Bloomberg Barclays US Aggregate Bond Index is market capitalization weighted and includes Treasury securities, government agency bonds, mortgage-backed bonds, and corporate bonds. It excludes municipal bonds and Treasury inflation-protected securities because of tax treatment.
Cambridge Associates LLC Global Private Equity Index
Cambridge Associates derives its Global Private Equity Index from the financial information contained in its proprietary database of global private equity (buyout, growth equity, private equity energy and mezzanine) funds. As of September 30, 2016, the database comprised 2,391 global private equity funds formed from 1986 to 2016 with a total capitalization of $2.4 trillion. The pooled returns represent the net periodic rates of return calculated on the aggregate of all cash flows and market values as reported to Cambridge Associates by the funds’ general partners in their quarterly and annual audited financial reports. These returns are net of management fees, expenses, and performance fees that take the form of carried interest.
Citigroup US High-Yield Market Index
The Citigroup US High-Yield Market Index is a USD-denominated index that measures the performance of high-yield debt issued by corporations domiciled in the United States or Canada. Recognized as a broad measure of the North American high-yield market, the index includes cash-pay, deferred-interest securities, and debt issued under Rule 144A in unregistered form.
Citigroup Pension Liability Index—Intermediate Duration
The Citi Pension Liability Index (CPLI) reflects the discount rate that can be used to value liabilities for GAAP reporting purposes. The index also provides an investment performance benchmark for asset-liability management. The intermediate-duration CPLI resembles a plan that is closed to new entrants, with a weighted average life of 21.2 years.
Cliffwater Direct Lending Index
The Cliffwater Direct Lending Index (CDLI) is an index composed of all underlying assets held by public and private business development companies that satisfy certain eligibility requirements. The index is asset weighted by reported fair value.
HFRI Fund-Weighted Composite Index
The HFRI Fund-Weighted Composite Index is a global, equal-weighted index of over 2,000 single-manager funds that report to HFR Database. Constituent funds report monthly net of all fees performance in US Dollar and have a minimum of $50 million under management or a 12-month track record of active performance. The HFRI Fund-Weighted Composite Index does not include funds of hedge funds.
MSCI All Country World Index
The MSCI ACWI Index is a free float–adjusted market capitalization–weighted index designed to measure the equity market performance of developed and emerging markets. The MSCI ACWI consists of 46 country indexes comprising 23 developed and 23 emerging markets country indexes. The developed markets country indexes included are: Australia, Austria, Belgium, Canada, Denmark, Finland, France, Germany, Hong Kong, Ireland, Israel, Italy, Japan, the Netherlands, New Zealand, Norway, Portugal, Singapore, Spain, Sweden, Switzerland, the United Kingdom, and the United States. The emerging markets country indexes included are: Brazil, Chile, China, Colombia, Czech Republic, Egypt, Greece, Hungary, India, Indonesia, Korea, Malaysia, Mexico, Peru, the Philippines, Poland, Qatar, Russia, South Africa, Taiwan, Thailand, Turkey, and the United Arab Emirates.
Russell 3000® Index
The Russell 3000® Index measures the performance of the largest 3,000 US companies representing approximately 98% of the investable US equity market. The Russell 3000® Index is constructed to provide a comprehensive, unbiased, and stable barometer of the broad market and is completely reconstituted annually to ensure new and growing equities are reflected.
Footnotes
- The fraction of US employees who are members of unions declined from 18% in 1985 to 11% in 2015.
- These considerations include Pension Benefit Guarantee Corporation (PBGC) solvency, alternative plan designs, potential legislative relief, intergenerational equity, etc., but they are beyond the scope of this note.
- The Treasury’s denial letters to the Central States, Southeast, and Southwest Areas Pension Plan, and the Teamsters Local 469 Pension Fund address the inadequacy of investment return assumptions, while Iron Workers Local 17 application lays out estimated future returns.
- This prospective return is calculated using our return to normal scenario, which incorporates current valuations and assumes equity valuations revert to fair value over ten years. This scenario makes assumptions about the market environment including mild inflation; moderate real earnings growth; and low corporate default rates, government bond yields, and credit spreads.
- The solvency of the PBGC multiemployer program (or lack thereof) over time may also be part of this decision process.
- The number and type of private credit strategies has been growing steadily since the financial crisis, meaning no good historical long-term benchmark exists for private credit. However, for purposes of comparison, the Cliffwater Direct Lending Index (incepted September 30, 2004) shows excess return of 2.1% and 2.5% relative to the Citigroup High-Yield Index over the ten-year and 12-year periods ending September 30, 2016, respectively.
- See Jason Hsu, Brett W. Myers, and Ryan Whitby, “Timing Poorly: A Guide to Generating Poor Returns While Investing in Successful Strategies,” The Journal of Portfolio Management, Winter 2016, and Bradley A. Jones, “Institutionalizing Countercyclical Investment: A Framework for Long-term Asset Owners,” IMF Working Paper, February 2016.
- In semi-delegated management, trustees retain “veto power” over the advisor’s investment implementation decisions within a short time frame (e.g., a week). For trustees used to a traditional advisory approach, this may be a first step toward discretionary management.
About Cambridge Associates
Cambridge Associates is a global investment firm with 50+ years of institutional investing experience. The firm aims to help pension plans, endowments & foundations, healthcare systems, and private clients achieve their investment goals and maximize their impact on the world. Cambridge Associates delivers a range of services, including outsourced CIO, non-discretionary portfolio management, staff extension and alternative asset class mandates. Contact us today.