Rising from the Ashes: Key Developments Since the Global Financial Crisis
Ten years ago, the failure of Lehman Brothers and rescue of many other financial firms cascaded quickly through the global financial system and then through the real economy. In the ensuing conflagration, the market value of global equities shrunk by nearly $20 trillion from a 2007 peak to the market’s trough on March 9, 2009, and millions lost their jobs. Following that trough, charred asset markets spread their wings, and the market value of global equities has tripled (surpassing pre-crisis levels).
In the intervening decade, central banks and regulators moved to stimulate risk-taking and lending by shell-shocked investors and institutions, while simultaneously preventing banks from causing systemic risks. New technology changed lives—think the ubiquitous iPhone, Facebook, and daily Amazon deliveries—while the sector’s profitability transformed investment portfolios. But not everyone benefited equally from the tech renaissance and economic recovery; populist movements are winning elections in many regions, and are pushing back against free trade and other free-market orthodoxy. And with active managers struggling to keep up in the bull market, the adoption of passive investment management has become a movement unto its own.
In this report, the global investment strategists at Cambridge Associates briefly highlight five key post–global financial crisis (GFC) developments. Our Chief Investment Strategist Celia Dallas then offers her thoughts on how investors might adapt their portfolios to these changes. The six sections are as follows:
- Monetary Policy: From Quantitative Easing to Quantitative Tightening
- A Muted Recovery for Banks Following the GFC
- Tech Is Driving Portfolio Returns
- Populism Rises in Popularity
- Active Equity Management Is Down, But Is It Out?
- Portfolio Implications of Five Key Post-GFC Developments
Monetary Policy: From Quantitative Easing to Quantitative Tightening
The GFC ushered in a dramatic shift in global monetary policy, in the form of rock-bottom interest rates and large-scale asset purchases by central banks known as quantitative easing (QE). These policies have compressed risk premiums across asset classes, but particularly in fixed income and credit markets.
This has also led to a buildup in leverage in the nonfinancial corporate and government sectors globally. In a sense, the goal of QE was to allow the deleveraging of the overstretched financial sector and households by re-leveraging the previously over-saving corporate and government sectors.
Although some would argue low rates reflect the lower growth and inflation seen since the GFC, interest rates in many countries remain divorced from what nominal GDP growth would suggest, and credit spreads do not reflect the deterioration in credit quality. Investor complacency in credit markets remains high.
With the global expansion about to enter its tenth year, central banks are starting to normalize policy. The US Federal Reserve has been hiking rates and shrinking its balance sheet, the Bank of Japan has been slowing its asset purchases, while the European Central Bank is set to end its QE program by the end of the year. If so, 2019 could be when the major central banks stop expanding their balance sheets in aggregate for the first time in ten years.
G3 CENTRAL BANK BALANCE SHEET GROWTH
December 31, 2007 – December 31, 2020 • December 31, 2007 = 100
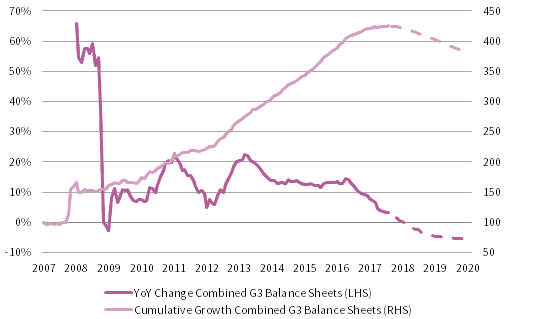
Sources: Bank of Japan, European Central Bank, Federal Reserve, Thomson Reuters Datastream, and Western Asset Management Company.
Notes: The lighter line shows the cumulative growth in the balance sheets of the European Central Bank, US Federal Reserve, and Bank of Japan. Estimates are represented by dashed lines and begin after July 31, 2018.
The end of global QE may very well have adverse impacts for global markets, especially as the yield curve flattens in the United States, signaling an increased risk of recession. A recession would lay bare the distortions and imbalances across asset markets, particularly in the credit markets.
Central banks are shifting from quantitative easing to quantitative tightening not out of a fear of inflation, but because they realize they have limited firepower to fight the next recession. Continued loose monetary policy amid steady economic growth will only further increase distortions in asset markets, increasing systemic risk. Stuck in a catch-22, central banks may very well trigger the recession they are seeking to avoid. At a minimum, the tightening of global liquidity will be a headwind for asset markets, especially credit and emerging markets asset classes.
The decade that followed the GFC can be characterized by constant concern about deflation and the puzzle of low inflation, however the next decade may see the return of inflation. The risk of this would be heightened if the next recession is less severe than the GFC (due to less leverage in the financial sector) and central banks are quick to revert to aggressive monetary easing. In this regard, the inflation fears raised in the GFC’s early aftermath as central banks began engaging in unorthodox monetary policy may eventually come to fruition.
A Muted Recovery for Banks Following the GFC
Ten years on from the financial crisis, the banking sector has significantly changed. Profitability has declined due to new regulations, lower interest rates, and the decline of previous cash cows like investment banking and proprietary trading. Globally the sector has seen an average return on equity (ROE) of around 9% in recent years, well below the 13% average in the years before the crisis. 1 In Europe, profits have been even lower as the sector has also struggled to deleverage and weather sovereign debt crises. Weaker profits mean the sector has shrunk relative to peers; financials are now just 18% of the MSCI All Country World Index (ACWI), down from 22% in early 2008. The difficult question for investors today is deciding which of these forces are secular versus cyclical, and how to characterize the future opportunity.
MEDIAN BANKING SECTOR RETURN ON EQUITY BY REGION
January 31, 2003 – July 31, 2018 • Percent (%)
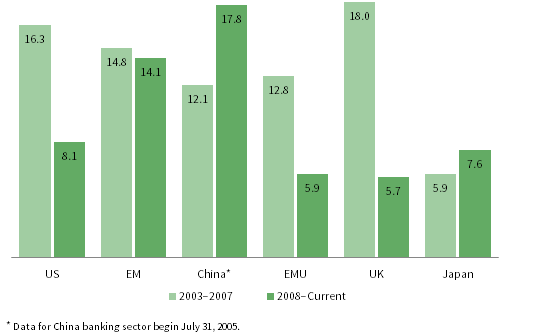
Sources: MSCI Inc. and Thomson Reuters Datastream. MSCI data provided “as is” without any express or implied warranties.
Some headwinds to the sector seem unlikely to abate anytime soon, though the outlook for profits is better in some regions than others. The US banking system has consolidated, and stronger economic growth has encouraged robust loan growth. Recent tax cuts mean the profits of some institutions are near record levels, though dilutive capital raisings during the crisis still mean ROE for some banks is well below pre-crisis peaks. In contrast, Europe remains over-banked and under a tighter regulatory regime, though loan growth and profits are finally starting to bounce back as economic activity rebounds. Meanwhile, Japanese bank balance sheets continue to swell despite near-zero interest rates as savers remain risk averse, so banks increasingly look offshore to find loan opportunities.
Although trends in metrics including loan growth and net interest margins could continue to benefit from a cyclical rebound, especially if less QE pushes interest rates higher, some aspects of business models have changed. Banks now invest less for their own account due to higher capital requirements and post-GFC regulations like the Volcker Rule. Traditional investment banks are also struggling with new competition from boutiques in lucrative areas such as mergers advisory services. So-called shadow banks are increasingly taking market share in leveraged lending and asset-based finance. Funding models are also changing. The “originate to distribute” securitization model has faded due to new regulations, and large banks are more reliant on customer deposits for funding. These trends have boosted stability but also reduced profitability.
An additional unknown for the sector—putting aside questions over rates, economic growth, and regulation—is the potential impact of technology disruption. Costly branches are becoming less relevant as customers move their banking online. Tools like artificial intelligence and big data could improve loan screening and enhance banks’ ability to market new products. The flipside is that technology also creates new competitors for banks in areas like online payments and marketplace lending, increasing options for savers and borrowers while pushing bank margins lower. Nowhere is this more apparent than in Asia, where players including China’s Alibaba and Japan’s Rakuten Ichiba have quickly developed scale and displaced banks in areas like asset management and credit cards. Overall, it seems premature to say banks are down for the count, but the pressure is on for the sector to rapidly innovate or be displaced in many business areas.
Tech Is Driving Portfolio Returns
Although banks have lost their pre-GFC swagger, the opposite is true for technology firms. The information technology (IT) sector has swelled over the past decade to the largest in the MSCI All Country World Index (ACWI), due to both the listing of large tech firms and to the sector’s outperformance. Over the past decade, smartphones, social networks, and e-commerce deliveries have become a daily routine for many. And the strong earnings and rising valuations of the firms involved (both the global firms atop the indexes, and those nested inside venture capital portfolios) have powered investor returns. Looking ahead, investors have high expectations for technologies including autonomous vehicles and artificial intelligence, and they are paying rich multiples for some of the companies that are developing those technologies.
The IT sector was just 11% of ACWI as the financial crisis began to take shape in mid-2007, but today it tops 19% and has taken over the top spot from the financial sector. The increased concentration is the result of flotations (such as the IPOs of Facebook and Alibaba, each of which valued the firms at more than $100 billion), combined with the sector’s strong performance (10.1% annualized since June 2007, compared with a median of 2.1% for the other sectors). Despite starting out the period with only an 11% allocation, the IT sector has contributed more than one-third of the index’s 4.6% return from June 2007 to July 2018.
Investors that watched technology stocks become dominant during the late-1990s tech bubble and then decline by 80% might wonder whether they have seen this movie before. However, today’s era of tech dominance may well end differently than the last one. One key reason is that today’s technology firms generate significant profits. In early 2000, IT stocks accounted for nearly 33% of the MSCI US Index while contributing a measly 15% of the index’s earnings. As of July, the sector is 26% of the index and contributes a healthy 24% of profits.
Indeed, a case can be made that the valuations have remained reasonable even amid stunning returns, as the rapid rise in share prices has simply kept pace with a corresponding rise in profits. However, ROE is also high relative to history, and sustaining both growth and margins over the long term may eventually prove challenging.
Technology’s impact on portfolio returns has not been limited to the large publicly traded firms like Apple and Tencent. Across private investment funds in our database, realizations of the IT companies in their portfolios (such as sales and IPO proceeds) have totaled $428 billion during the post-GFC era. In fact, of the total proceeds of IT company realizations over the past 37 years, two-thirds were generated since the end of 2007.
CUMULATIVE PRICE RETURN AND EARNINGS PER SHARE
June 30, 2007 – July 31, 2018 • June 30, 2007 = 100
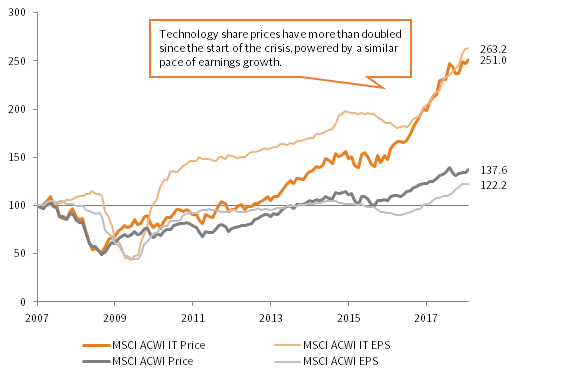
Sources: MSCI Inc. and Thomson Reuters Datastream. MSCI data provided “as is” without any express or implied warranties.
Note: Data are monthly.
Though technology has become dominant in our lives and our portfolios, some dominant firms are facing a regulatory backlash; the sector in coming years may struggle to match the stunning returns and profitability that investors have come to expect during the post-GFC years.
Return to top
Populism Rises in Popularity
The last decade has witnessed a shift in political winds. Populist leaders brandishing nationalist policies have gained traction in a host of seemingly disconnected countries. The styles of these leaders may differ, but they all share a common objective—upend the political establishment. There is no clearer example of this trend than the election of Donald Trump as President of the United States. Yet, examples abound. Consider political developments in Europe, Mexico, and even Turkey, to name just a few. These shifts have had a pronounced impact on domestic and foreign policies, and they raise risks for investors.
In the United States, where establishment Republican politicians warily embraced their party’s presidential candidate, Trump has redefined what it means to be a party standard-bearer. Here, as elsewhere, populist rhetoric about trade, immigration, and growing income inequality have fueled anti-globalization sentiment. Harnessing these concerns, Trump has plunged the United States into an ever-deepening trade war, involving allies and foes alike. Even long-held approaches to North Korea, Russia, and NATO member countries have been shunned, as Trump looks to topple conventional policies and put America first.
In Europe, the trend toward deeper EU integration has stalled, as concerns about the migrant crisis have given new energy to its once-sleepy nationalist movements. Most notably, leaders in the United Kingdom seized on these concerns and other sovereignty anxieties to successfully campaign for Brexit. Likeminded Alternative für Deutschland politicians also made a splash in recent elections, securing their party’s best showing in federal and state elections and putting Chancellor Angela Merkel on shaky ground. Political parties elsewhere—from Italy’s Five Star and Poland’s Law and Justice to Hungary’s Fidesz—have similarly leveraged economic and social divisions to their advantage.
AVERAGE SHARE OF VOTES FOR POPULIST PARTIES IN EUROPE
1980–2018 • Percent (%)
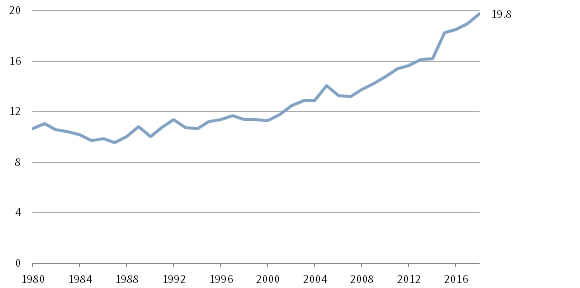
Source: Timbro.
Notes: Data are based on the Timbro Authoritarian Populism Index. The index shows the average support for populist parties across all European countries examined. The number of countries examined rose from 20 in 1980 to 33 in 2018.
In Mexico and Turkey, where populist leaders take a different form, the anti-establishment zeal is unmistakably familiar. In contrast to the right-leaning populist trends in the United States and Europe, the embrace of left-wing policies helped Mexico’s President-elect Andrés Manuel López Obrador supplant two political parties that had governed for the last 90 years. The insurgent campaign in Turkey came counter intuitively from its long-standing leader. Painting rivals and the political establishment as corrupt, President Recep Tayyip Erdogan has remade the presidency and embraced a nationalist form of Islam to appeal to the common man.
These trends represent a break from the pre-GFC orthodoxy. With elevated valuations and data suggesting the United States is likely in the late-cycle phase of its economic expansion, global markets may be more vulnerable now to poorly conceived policy than at any time in recent years. Any considerable retreat in cross-border trade, capital flows, and even migration may feed inflationary pressures and force asset prices lower. But assessing the odds of such an outcome is difficult. What we can say is that political risks are rising, and as with the mythical Hydra, there are many ways to be bitten.
Active Equity Management Is Down, But Is It Out?
Though economic, political, and market developments since the GFC have shaped asset returns, some may have also contributed to a profound investor migration away from actively managed investments and toward low-cost, passive strategies including exchange-traded funds (ETFs). Although this sustained trend (which has seen active equity funds shed $2.5 trillion since the GFC, with passive funds as the primary beneficiary) 2 could suggest that passive strategies are on their way to becoming the preferred approach for the majority of investors, it’s probably early to herald the death of traditional active management.
Active managers as a group have struggled following the GFC. An August 2018 Morningstar study found that of nearly 2,000 equity mutual funds that existed in 2008, fully one-quarter did not survive the next ten years, and of the surviving 1,450 one decade later only one-third beat the performance of a comparable ETF after fees over the last ten years. 3 While the majority of active managers typically underperform indexes, due to the drag of fees and transaction costs, post-GFC economic and market developments may have exacerbated their struggles over the past decade: QE has arguably suppressed the dispersion of asset prices; investors have bid up a handful of disruptive technology stocks (truly long-duration assets, in a low interest rate world); and equity markets have been strongly bullish for most of the decade, particularly in the United States. But underperformance was not the only factor pushing investors toward passive investment: financial regulations (including the Fiduciary Rule 4 ) and a wave of lawsuits against retirement plan sponsors have also spurred demand for low-cost passive products.
Investors are migrating away from fundamental, actively managed strategies and into index funds and ETFs (which have exploded from $608 billion to $3.4 trillion in assets over the past decade), as well as including “smart beta” strategies that target factors identified in academic research using rules-based processes and at low fees. As of June 2017, passive funds (including those fast-growing “smart beta” strategies) commanded 43% of overall US equity fund assets, roughly double their share a decade prior. 5
While passive strategies have vacuumed up market share over the past decade, they still own just a fraction of the overall market. In the United States for example, passive funds controlled approximately 13% of outstanding public equities at the end of 2017, up from 5% a decade ago. Though passive’s aggregate market share could be meaningfully higher when accounting for passively managed equities held in institutional separate accounts, active investors continue to dominate. Futhermore, the market for ETFs could be showing signs of oversaturation, and net flows out of active and into passive strategies have been running at a significantly slower pace in recent months than the record-level migration observed over the past few years.
NET FUND FLOWS TO GLOBAL EQUITIES
August 31, 2007 – July 31, 2018
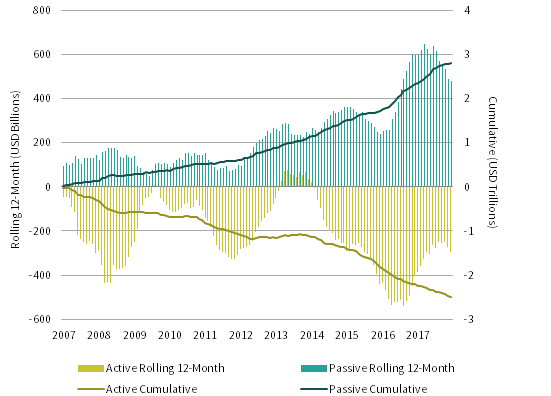
Source: EPFR Global.
Notes: Data represent net fund flows for all equity fund strategies and domiciles. Active refers to funds that are actively managed rather than attempting to replicate an index. Passive refers to funds that seek to replicate an index, including factor-weighted benchmarks. Data are monthly.
Time will tell whether this recent slowdown reflects an inflection point in investors’ preference for passive over active strategies or just a pause in a longer-term secular trend. However, market volatility and asset price dispersion could be set to rise as central banks continue pulling back on QE. Furthermore, current US equity valuations indicate the potential for more moderate market returns over the next decade. Both dynamics could provide a more conducive environment for highly skilled active managers going forward.
Return to top
Portfolio Implications of Five Key Post-GFC Developments
The investment climate has evolved over the last decade as the ripples from the GFC made their imprint on policymakers and investors alike. New financial sector regulations and a search for safe assets that compensate investors beyond the paltry rates offered by high-quality sovereign bonds are hallmarks of the decade. High growth investments have been plentiful, profitable, and disruptive, as the seeds planted in the 1990s in technology investments have bloomed, transforming ecommerce, communications, finance, and touching just about every industry in ways we could not have imagined a decade ago. At the same time, voters across much of the globe, discouraged by sustained income inequality and weary of established party leaders have given rise to a wave of populist leaders, and their policies may increase the risks of higher-than-expected inflation or of debt-related indigestion. Also, market leadership has become concentrated in segments including US equities and tech stocks, putting pressure on active managers at a time when passive investment has been growing in popularity and is available with miniscule fees.
What are the portfolio implications of these post-GFC developments? Investors should seek greater diversification of return sources, recognize that portfolio defense in the next recession may look different than what we have seen in recent decades, and evaluate active managers carefully to understand their stability and their edge in an age of disruption.
The Value of Diversification
As central banks gradually move from quantitative easing to quantitative tightening and migrate away from near-0% policy rates, liquidity will drain from the global economy and, as night follows day, a recession will eventually come. The leaders of the market run-up in which performance has become concentrated (e.g., large-cap tech stocks and US equities) often become laggards as markets correct. At the same time, the risk of inflation is rising from very low levels. A bias toward easy monetary policy may ultimately lead to inflation, with populist policies including fiscal stimulus and import tariffs compounding that risk.
To address rising geopolitical risks, diversification and careful liquidity management are the best lines of defense. Furthermore, in an environment of high debt, deteriorating demographics, and lackluster productivity growth, owning assets that are less reliant on economic growth is valuable.
What Does Diversification Look Like?
Please see the second quarter 2018 edition of VantagePoint, published April 19, 2018.
Attractive diversification solutions are not easy to come by. Sovereign bonds tend to sync with equities in performing poorly when inflation is greater than expectations priced into the market. Real assets, particularly commodities and natural resource equities, have historically provided helpful diversification in the face of unexpected inflation, but as we have discussed, the ability of energy investments to boost portfolios in the event of unanticipated inflation may be compromised given technological developments including fracking and horizontal drilling, improved energy efficiency, and the increased competitiveness of renewable energy sources.
Although long-dated sovereign bonds will likely remain one of the best portfolio diversifiers in a recession, cash and short-maturity sovereigns offer important advantages should inflation expectations increase. From a portfolio construction perspective, an allocation to short-duration sovereigns can serve as an effective liquidity reserve under a variety of negative economic scenarios, providing modest but steady returns across a variety of environments. Because of the multi-purpose nature, investors could arguably cover a couple of years of anticipated spending needs with a smaller allocation to cash than to a more traditional macro-defense combo of long bonds and real assets.
Please see the second quarter 2017 edition of VantagePoint, published April 10, 2017.
Finally, while not for everyone, certain investment strategies have relatively low reliance on economic growth. At the top of our list of candidates are trend-following strategies, hedge funds that have low sensitivities to equity markets or credit spreads, and certain illiquid strategies including royalties and life settlements.
Within equity portfolios, investors should understand their exposures and avoid being overly concentrated in US equities and tech stocks that have been market leaders. When the market cycle turns, which it eventually will, market leaders typically underperform. However, US equities have exhibited defensive characteristics, so they have often outperformed during risk-off environments, particularly in unhedged terms. Given relative valuations, if you are overweight US equities, we would at least rebalance to neutral, if not slightly underweight positions. “Bond substitutes” like minimum volatility and high dividend strategies and some credit strategies have historically proven somewhat defensive in bear markets, but may not shine so brightly in the next downturn, given the diminution of risk premia and their vulnerability to any further increase in bond yields.
Value, typically a laggard during recessions, may ultimately prove to be defensive within equities this cycle. When valuations for value relative to growth dip below their 10th percentile (as they are today), value tends to outperform growth and the broad market, even in a recession. Furthermore, the weakness of bank fundamentals compared to tech fundamentals could moderate or reverse, even as technology continues to influence dynamics across all economic sectors. We are watching for a change in momentum to favor value before overweighting outright. For investors that have seen their portfolios become overweight in growth as the style has outperformed, we would rebalance to at least neutral positioning today.
Manager Due Diligence 2.0
The apparent dearth of alpha opportunities and increased availability of attractively priced passive and factor-based investment options are pressuring managers to differentiate themselves from benchmarks and to reduce fees. Fee pressure, along with capital outflows from active managers into passive strategies, have placed increasing stress on many active managers’ business models. While always an essential part of due diligence, an evaluation of managers’ organizational stability to withstand structural business challenges and appetite to support good funds through cycles of inevitable underperformance are even more critical to evaluate today.
In addition, differentiated active managers with strong businesses can sustainably boost portfolios, while closet index funds cannot. Can the manager’s “alpha” be replicated more cheaply via static allocations to factor-based funds (e.g., smart beta)? For managers that remain, fees paid should be commensurate with value-added return potential and should compensate managers for differentiated skill.
Manager due diligence should also consider how well versed managers are in technological advancements. Managers investing in mature businesses, for example, increasingly need to be in tune with technology developments and the risks and opportunities they pose for current market leaders: Will they adapt by integrating new technologies into their business models, or will they fail? Venture capital investments, particularly the more reasonably valued early-stage segment of the market, may help to position portfolios for the future.
Index Disclosures
MSCI All Country World Index
The MSCI ACWI Index is a free float–adjusted, market capitalization–weighted index designed to measure the equity market performance of developed and emerging markets. As of September 2017, the MSCI ACWI consists of 47 country indexes comprising 23 developed and 24 emerging markets country indexes. The developed markets country indexes included are: Australia, Austria, Belgium, Canada, Denmark, Finland, France, Germany, Hong Kong, Ireland, Israel, Italy, Japan, the Netherlands, New Zealand, Norway, Pakistan, Portugal, Singapore, Spain, Sweden, Switzerland, the United Kingdom, and the United States. The emerging markets country indexes included are: Brazil, Chile, China, Colombia, Czech Republic, Egypt, Greece, Hungary, India, Indonesia, Korea, Malaysia, Mexico, Peru, the Philippines, Poland, Qatar, Russia, South Africa, Taiwan, Thailand, Turkey, and United Arab Emirates.
MSCI Bank Stocks
All securities classified in the Banks industry group (within the Financials sector) according to the Global Industry Classification Standard from the following MSCI indexes were used: MSCI China, MSCI Emerging Markets, MSCI Europe, MSCI Japan, MSCI UK, and MSCI US.
Timbro Authoritarian Populism Index
The Timbro Authoritarian Populism Index examines the growth of populism in European politics and includes all European consolidated democracies: 33 countries including the 28 members of EU plus Iceland, Norway, Switzerland, Serbia, and Montenegro. A further criteria for participation is to be categorized as a “free” society by Freedom House, an American, governmental-funded NGO.
Footnotes
- The average ROE for MSCI ACWI financials was 13% from 2003 to 2007.
- This refers to cumulative net flows into these strategies from mid-2007 to mid-2018, as shown in the figure below. It is impossible to know with certainty whether a net outflow from active strategies is indeed linked to a net inflow into passive strategies.
- Please see Jeffrey Ptak, “Another Lesson in Why Taxable Money in Active Stocks is a Bad Idea,” accessed August 31, 2018, https://www.morningstar.com/articles/880662/another-lesson-on-why-taxable-money-in-active-stoc.html.
- While the Fiduciary Rule was effectively neutered this year, the eight-year path to implementation was impactful.
- Please see Vladyslav Sushko and Grant Turner, “The Implications of Passive Investing for Securities Markets,” BIS Quarterly Review (March 2018): 113–131.
About Cambridge Associates
Cambridge Associates is a global investment firm with 50+ years of institutional investing experience. The firm aims to help pension plans, endowments & foundations, healthcare systems, and private clients achieve their investment goals and maximize their impact on the world. Cambridge Associates delivers a range of services, including outsourced CIO, non-discretionary portfolio management, staff extension and alternative asset class mandates. Contact us today.