Playing Offense


The last major equity market downturn ended more than a decade ago, and today investors worry about slowing growth and worsening trade wars. Whether the next downturn is a few months away or a few years away, this is an excellent time to prepare portfolios to successfully navigate equity stress. We believe the best way to navigate an equity market downturn is to enter it with a plan in place. Thoughtful decisions—not rash actions—during these chaotic environments are what separate the top-performing investors from everyone else. In this series, we review five important topics that should inform any plan to manage portfolios through equity market downturns:
While earlier installments in this series have touched on aspects of preparing for market downturns, this piece is intended to help investors pivot and “play offense” after the downturn has already occurred. In preview, we think market timing is difficult and regularly rebalancing may be all the “offense” most investors need. But sell-offs can be missed opportunities and specifics are important. Investors need investment policy statements (or similar guidelines) in place that include detailed guidance for portfolio rebalancing. Investors should also understand the risk exposures of existing managers and have a view as to which managers and vehicles are best suited to adjust exposures back to desired levels. Playing offense can also involve asset classes that are not part of formal policy allocations but may provide compelling risk-adjusted returns following a downdraft. The overarching goal for portfolios is to maximize returns by taking the desired amount of risk while minimizing tracking error. Investors with more flexibility to make tactical decisions (e.g., those less constrained by targets for asset allocation or volatility) should know the history and do the math regarding how to improve their chances of success.
How to Play Offense?
There is a spectrum of ways in which investors can play offense. For many investors, rebalancing portfolios during a serious equity downturn is itself a serious challenge, and thus a form of playing offense. As discussed in a companion piece, a general guideline for rebalancing might be rebalancing an underweight asset class to around midway between the outer limit of a policy range and the target allocation, striking a balance between valuation and momentum. The goal is to avoid having recency (or other behavioral) biases result in allocations that are below or at the low end of acceptable ranges for an extended period.
More aggressive forms of “playing offense” (which include rebalancing to higher weights than discussed above) may appeal to some investors that have sufficient liquidity and appropriate governance, as well as tolerance for extended tracking error with policy portfolios. For these risk-tolerant investors, the right time to plan is now, rather than in the teeth of the downturn. Portfolios should be stress-tested to ensure they can meet spending requirements and liquidity needs during market downdrafts. Proactively lower intended commitments to illiquid assets if they are too high, and consider lining up backup financing sources. Having a plan to identify funding sources when playing offense or rebalancing is important. The obvious candidates are core fixed income allocations, presuming they have exhibited their traditional inverse correlation to risk assets and weights have risen above or to a high end of allowable ranges. Certain types of hedge funds should also be viewed as funding sources, assuming they too have experienced a lower correlation to risk assets and that terms or gates are not in place that restrict investor outflows.
Having planned for potential liquidity needs and identified funding sources, investors that can tolerate meaningful tracking error should consider playing offense by opportunistically allocating to assets for which there are no formal policy weights. For example, while many investors will have detailed policies in place for maintaining equity allocations, policy descriptions for fixed income may be intentionally vague. Specifically, where portfolios lack existing exposure to credit, investors should have some familiarity with existing (and potential) sub-asset classes and vehicles, and given (then) current valuations be able to reasonably argue that their potential risk-adjusted returns will compare favorably to those of the candidates for underweighting.
Vehicles for Playing Offense
Depending on the asset class, investors may have a variety of instruments and vehicles through which they can play offense. Investors can quickly top up allocations to liquid assets (e.g., US equities) via vehicles like exchange-traded funds (ETFs) or increase commitments to commingled funds already in portfolios. Sell-offs also create an opportunity to upgrade manager rosters, so investors may want to have on hand a shortlist of managers across asset classes to which they desire access.
IMPLEMENTATION VEHICLES
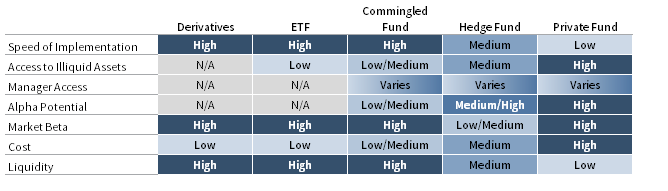
Source: Cambridge Associates LLC.
Derivatives can offer an elegant way to play offense, but effective implementation requires tight guidelines and specialized expertise. For example, an investor could design an ongoing put-selling program that would entail increasing index stock exposure at different price levels (e.g., -15%, -20%, etc.). These systematic options-based strategies can help automatically rebalance portfolios back to targets during downdrafts and avoid behavioral issues.
There are trade-offs. Selling put options requires keeping dry powder on hand to cover them, which can introduce tracking error and weigh on returns. During a sell-off, attractive opportunities may arise in asset classes other than the one on which options were sold; the result may be that investors add exposure to assets (e.g., US stocks) that held up well on a relative basis and thus to which they were already overweight. Buying call options while holding more cash magnifies some of these issues (e.g., tracking error) and creates behavioral risk. It may become tough to swallow paying soaring option premiums just as falling stock valuations make such options more likely to pay off.
Equity long/short (ELS) hedge funds may not be an ideal vehicle for rebalancing shrunken equity exposures during a market downturn. ELS hedge fund exposure to equities fluctuates, and as a group their average beta to the market is around 0.4 and rarely exceeds 0.6. Managers attempting to control volatility may in fact lower their equity exposure during sell-offs. While this can provide protection if markets fall further, it creates the risk that allocations to such funds will not help achieve the investor’s desired equity exposure when markets recover. More generally, ELS funds face headwinds such as the lack of a meaningful short rebate during periods of low policy rates.
ROLLING 6-MONTH BETA OF LONG/SHORT HEDGE FUNDS TO GLOBAL EQUITIES
September 30, 2003 – June 30, 2019
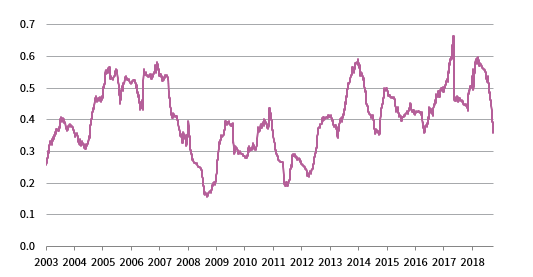
Sources: Hedge Fund Research, Inc., MSCI Inc., and Thomson Reuters Datastream. MSCI data provided “as is” without any express or implied warranties.
Notes: Data are based on daily total returns in USD terms. Long/short hedge fund and global equities data are represented by the Hedge Fund Research (HFRX) Equity Hedge Index and MSCI All Country World Index (Net), respectively.
Corrections in credit markets can be played by either hedge funds or long-only vehicles, depending on the sub-asset class in question. For example, certain parts of the structured credit market are hard to access via public open-ended vehicles given liquidity issues; hedge funds targeting these assets tend to have high betas to the underlying exposures. In contrast, investors can play technically driven sell-offs in asset classes like leveraged loans or high-yield bonds via mutual funds or ETFs, but situations where fundamentals are also weakening are best accessed via active managers. For these and other non-policy assets, the investor must be able to bear the tracking error of overweighting these versus an underweight like equities or ELS funds.
Closed-end private investment funds can offer access to potential manager alpha, as well as harder-to-access markets, but investors need to consider market technicals, such as how much dry powder is already allocated to these strategies. Distressed managers are currently sitting on $72 billion of dry powder, and would likely raise more during a downdraft. Investors that funded distressed investments by reducing allocations to other assets where valuations had cheapened might be disappointed if funds were slow to put new money to work even as the opportunity set ebbed. Drawdown vehicles that promise not to call capital (and thus charge fees) until attractive opportunities present themselves are one possible solution, presuming the manager can be relied upon to draw capital at the right time (as well as wind down such vehicles in a timely fashion). Including so-called “triggers” (e.g., valuation levels at which capital will be drawn) in fund documentation can help mitigate these risks.
When to Play Offense
Investors should be prepared to regularly rebalance, as drawdowns are a frequently occurring event. Since 1980, the median annual intra-year drawdown for the MSCI US Index is -10%, and many years (including 2018) see even deeper sell-offs. Playing offense (assuming you have the policy freedom and stakeholder support to do so) in the hopes of scoring an immediate gain may be disappointing, as historically there is little relationship between the size of an equity market drawdown and magnitude of the short-term recovery. But historical returns also speak to the potential costs of waiting too long after a sell-off to rebalance. The median monthly historical return for the MSCI US Index is around 1.1%, but the top ten individual months saw an average return of around 12.2%. Missing just these ten months would have dropped the annualized return on the index from 9.2% to 6.7%.
DISTRIBUTION OF HISTORICAL MONTHLY US EQUITY RETURNS
December 31, 1969 – June 30, 2019 • Number of Monthly Periods
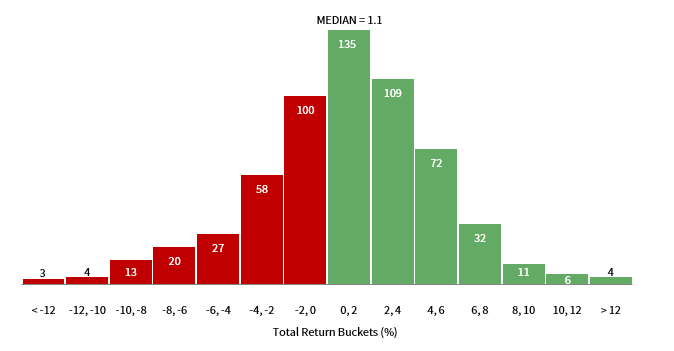
Sources: MSCI Inc. and Thomson Reuters Datastream. MSCI data provided “as is” without any express or implied warranties.
Notes: US equity represented by MSCI US Index total returns in USD terms. Total returns are net of dividend taxes.
While we advise against trying to time the market, investors can improve their odds of obtaining higher future returns by buying at the right valuations. But investors waiting for bargains in certain asset classes should also be realistic. Today’s normalized P/E of 27x (as of July 31) for US stocks would need to drop by around 35% to fall back to the median historical P/E multiple (17x); there have only been a handful of declines near this level in the MSCI US Index in the past 50 years. Even waiting until valuations fall back to the 75th percentile is not much of a better bet, as the commensurate decline (a return of around -25%) has only occurred during 3% of all 12-month periods.
DISTRIBUTION OF SUBSEQUENT REAL RETURNS FROM STARTING COMPOSITE NORMALIZED P/E DECILES: US
December 31, 1969 – July 31, 2019 • Subsequent Real Return AACR (%)
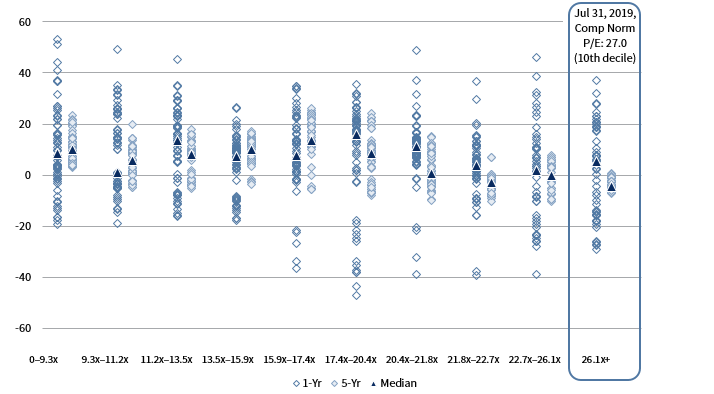
Sources: MSCI Inc. and Thomson Reuters Datastream. MSCI data provided “as is” without and express or implied warranties.
Note: The composite normalized price-earnings (P/E) is calculated by dividing the inflation-adjusted index price by the simple average of three normalized earnings
metrics: ten-year average real earnings (i.e., Shiller earnings), trend-line earnings, and return on equity–adjusted earnings.
When deciding how quickly to rebalance during a sell-off, it is worth examining if the signaling power of valuations (which as implied above are often imprecise) can be enhanced by also looking at other signals. The utility of macro data varies across markets and time periods, but buying when stocks are inexpensive and when macro data (business confidence, PMIs, etc.) are depressed can help generate better results than solely relying on valuations. Macro data, like valuations, are also often mean-reverting (expansion follows contraction, and so on), in part because economic activity can’t shrink forever and policymakers loosen monetary or boost fiscal stimulus when macro data are depressed.
Before assuming macro data will rebound and boost risky assets, investors should ask if anything may have changed. For example, while valuations for European banks looked attractive in the middle of 2016 and macro data looked abysmal, the remedy used by authorities (zero interest rates) combined with existing headwinds like higher regulation and elevated competition did not allow for an extended recovery. Similarly, the ability of authorities to stimulate through further interest rate cuts is now much in question, as base rates are already below zero in regions including the Eurozone, and many debate whether low interest rates are doing as much harm as good.
What Investors Should Do Next
Investors should review existing policies regarding portfolio rebalancing and tactical asset allocation and ensure they have a strategy to play offense during the next downturn. This plan should lay out a reasonable timeframe over which the portfolio will be rebalanced and include an analysis of liquidity needs and possible funding sources. For investors that can tolerate meaningful tracking error and being wrong for a substantial period, being ready to play offense also entails an awareness of asset classes where there is no policy weight but where tactical opportunities may arise, such as credit, as well as an assessment of how existing and potential managers may adjust market exposures during and after sell-offs. Investors that have more discretion in playing offense should rely on valuations and a comparison of expected returns on the target asset class versus the potential funding source, but be realistic about trying to time the market. History suggests sell-offs are frequent and market snapbacks can be violent; returns can be front-loaded when sentiment changes. Depending on the asset class, investors are likely to have a choice of several different vehicles through which to add exposure. To the extent that investors will consider lock-up or drawdown vehicles, they should consider opportunity costs, dry powder already in that strategy, and whether the vehicle’s tenor (the duration of the investment period and harvest period) matches the length of the expected opportunity. Derivatives programs can be an elegant way to force a portfolio to add risk during drawdowns but can entail high tracking error.
Index Disclosures
HFRX Equity Hedge Index
The HFRX Equity Hedge EUR Index is euro-denominated. Hedge Fund Research, Inc. uses a UCITSIII- compliant methodology to construct the HFRX Hedge Fund Indexes, including multi-level screening, cluster analysis, Monte Carlo simulations, and optimization techniques.
MSCI ACWI Index
The MSCI ACWI is a free float–adjusted, market capitalization–weighted index designed to measure the equity market performance of developed and emerging markets. The MSCI ACWI consists of 46 country indexes comprising 23 developed and 26 emerging markets country indexes. The developed markets country indexes included are: Australia, Austria, Belgium, Canada, Denmark, Finland, France, Germany, Hong Kong, Ireland, Israel, Italy, Japan, the Netherlands, New Zealand, Norway, Portugal, Singapore, Spain, Sweden, Switzerland, the United Kingdom, and the United States. The emerging markets country indexes included are: Argentina, Brazil, Chile, China, Colombia, Czech Republic, Egypt, Greece, Hungary, India, Indonesia, Korea, Malaysia, Mexico, Pakistan, Peru, Philippines, Poland, Qatar, Russia, Saudi Arabia, South Africa, Taiwan, Thailand, Turkey, and the United Arab Emirates.
MSCI US Index
The MSCI US Index is designed to measure the performance of the large- and mid-cap segments of the US market. With 617 constituents, the index covers approximately 85% of the free float–adjusted market capitalization in the United States.
Wade O’Brien - Wade O’Brien is a Managing Director for the Capital Markets Research team at Cambridge Associates.
About Cambridge Associates
Cambridge Associates is a global investment firm with 50+ years of institutional investing experience. The firm aims to help pension plans, endowments & foundations, healthcare systems, and private clients achieve their investment goals and maximize their impact on the world. Cambridge Associates delivers a range of services, including outsourced CIO, non-discretionary portfolio management, staff extension and alternative asset class mandates. Contact us today.