Behavioral Roadblocks

The last major equity market downturn ended more than a decade ago, and today investors worry about slowing growth and worsening trade wars. Whether the next downturn is a few months away or a few years away, this is an excellent time to prepare portfolios to successfully navigate equity stress. We believe the best way to navigate an equity market downturn is to enter it with a plan in place. Thoughtful decisions—not rash actions—during these chaotic environments are what separate the top-performing investors from everyone else. In this series, we review five important topics that should inform any plan to manage portfolios through equity market downturns:
- Market History
- Portfolio Liquidity
- Diversification Challenges
- BEHAVIORAL ROADBLOCKS
- Playing Offense
Investing is difficult enough in normal times, even for the most seasoned investors, given the underlying emotions and mental biases inherent in human decision making. Downturns can exacerbate these behavioral challenges, increasing the risk of mistakes that can permanently impair portfolio value. For these reasons, developing and maintaining a sound investment process is as much about effective risk management as it is about setting an appropriate investment strategy and asset allocation. Ahead of the next downturn, investors should (re)familiarize themselves with the behavioral biases that inevitably rear their ugly heads during sustained market declines. Ensuring a “prepared mind”—that is, understanding what a downturn looks and feels like 1 and having a playbook for mitigating behavioral risks when the market cycle eventually turns south—is even more critical. When it comes to the human component of investing, self-awareness regarding behavioral biases certainly can help, but the best defense against common behavioral pitfalls is developing a plan to help navigate a bear market with buy-in from relevant stakeholders and then sticking to it.
In this piece, we discuss the behavioral biases to which investors could be most susceptible in the next market downturn. We then review some hard lessons we and many clients learned during the global financial crisis (GFC). Specifically, rebalancing equity exposure back to policy targets following a major correction is very difficult, but is critical for maintaining total portfolio beta, limiting tracking error vis-à-vis policy benchmarks, and achieving long-term investment objectives. Finally, we provide some simple, yet practical strategies for mitigating the behavioral risks that often arise during bear market environments, the most important of these being the establishment of a formal rebalancing policy that all investment stakeholders agree to in advance.
Beware of Behavioral Biases
Like all animals exposed to danger, human beings are hard-wired with “fight or flight” survival instincts that have enabled our species to endure. Yet, our innate risk aversion can be problematic when it comes to investment decision making during a market downturn. As we noted a few years ago, “investor risk tolerance is not static, but instead shifts with asset prices.” Paradoxically, human instinct gives investors the impression that risks are rising when markets are falling, which can prompt them to cut exposures precisely when the risk/reward proposition is often moving in their favor. Conversely, a prolonged bull market such as we have experienced can lull investors into a false sense of security, when, in fact, risk premiums are compressed and financial asset prices are vulnerable to correction. As a result, executing a rebalancing policy during a sustained market correction requires investors to boost exposure to risky assets in the face of rising fear. Easier said than done!
Behavioral economists have identified, analyzed, and documented dozens of behavioral biases, many of which can negatively influence investment decisions. 2 Our earlier paper on this topic summed up how such dynamics can manifest themselves during an equity bear market.
“Slammed by financial shock, the same instincts result in heightened risk aversion (gimme cash!), a dramatic foreshortening of our normal investment time horizon, an overwhelming impulse to flee with the herd, a tendency to extrapolate current trends all the way to Armageddon, and a deep desire to latch on to anyone who seems able to explain what is going on and what will happen next—that is, to alleviate the misery of our deep uncertainty.”
Said more directly, long-term investors facing a downturn are most susceptible to loss aversion, herding, recency bias, and availability bias. When downside volatility picks up, so does loss aversion. Investors often lose sight of the strategic investment objective (often to maintain or grow the portfolio’s real purchasing power) and instead become preoccupied with the “nominals” as mark-to-market portfolio losses mount, as well as with saving their own careers, preferring the safety of the herd. The goal swiftly becomes to stem the bleeding, at any cost. Investors also tend to exaggerate the importance of recent information and to forget the longer-term historical context during times of market stress. As market uncertainty rises, investors can lose their objectivity and begin grasping onto any available information and advice, regardless of its strategic relevance and particularly if the source is perceived as a market expert. Experienced in combination, and without effective strategies to mitigate them, these natural human reactions to short-term financial pain and loss can be devastating to the long-term investment mission.
What Not To Do in a Downturn: Learning from the GFC
Decisions taken by institutional investors during the GFC of 2008–09 provide useful case studies of how behavioral biases can infect investment decision making and lead to sub-optimal outcomes. During the depths of the crisis, many investors considerably shortened their investment time horizons upon being deluged with a steady stream of negative financial headlines and weak economic data, as well as in response to daily mark-to-market portfolio losses. Other investors had simply misjudged their liquidity needs and/or had taken on leverage that exposed them to margin calls, forcing them to part with beaten-down growth assets (i.e., listed equities and, in some cases, private investments) at the worst possible time. The combination of panic selling and forced liquidations raised correlations among risk assets, rendering portfolio diversification less effective, as many so-called “long-term strategic” investors simultaneously rushed for the exits alongside more short-term oriented market participants. Loss aversion then prevented many institutional investors from buying back in and participating fully in the market recovery.
We didn’t have to look any further than our own quarterly asset allocation surveys to quantify the extent to which institutional investors (many of which we advise—Cambridge Associates investment teams are certainly not immune from behavioral biases) were slow to rebalance their portfolios’ equity exposures in the aftermath of the GFC. We compared the cumulative change since June 2007 in the median allocation to equities, as well as to “equity-like” assets (i.e., high-yield bonds and distressed credit strategies), with what an investor would have experienced from buying and holding (i.e., without rebalancing) a pure passive portfolio comprising 70% global equities and 30% US bonds. The data show that, while clients’ allocations to equities and “equity-like” assets fell less than for the buy-and-hold portfolio, the median “equity” exposure still fell by more than 10 percentage points cumulatively as of the March 2009 market trough and remained at least 5 percentage points below its pre-crisis level over the ensuing five years. The relatively milder drawdown versus the purely passive portfolio is perhaps partly explained by exposures to private investments whose market values were not marked down as much or as quickly as publicly listed equities. In addition, on our advice heading into and during the crisis, many clients also increased allocations to high-yield bonds and boosted commitments to distressed credit strategies to capitalize on market dislocations where the risk/reward opportunities appeared most asymmetric, thereby helping to maintain exposures to equity-like assets. Yet, the data also suggest institutions did not sufficiently rotate back into listed equities once the distressed credit cycle had run its course. As a result, the median equity allocation did not return to its pre-crisis level any faster than an “unrebalanced” simple 70/30 portfolio would have.
CUMULATIVE CHANGE IN MEDIAN ALLOCATION TO EQUITY AND “EQUITY-LIKE” ASSETS
Third Quarter 2007 – Second Quarter 2018 • Percentage Points
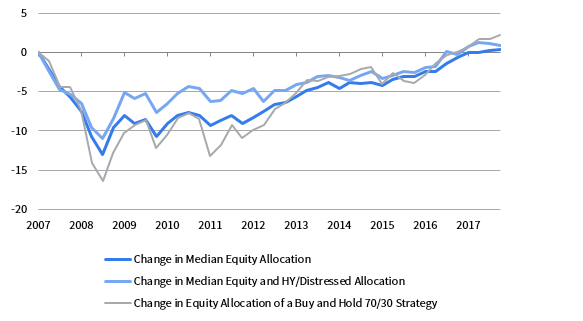
Sources: Bloomberg Index Services Limited, Cambridge Associates LLC, and MSCI Inc. MSCI data provided “as is” without any express or implied warranties.
Notes: Median allocations based on quarterly data from a constant universe of 151 institutions. Equity allocation includes long-only public equity, venture capital, and non-venture private equity. HY/Distressed allocation includes high-yield bonds and distressed credit strategies. Buy and Hold strategy is represented by the MSCI All Country World Index (Net) in LC terms and the Bloomberg Barclays US Aggregate Bond Index in USD terms.
Following the “Great Recession” and its associated bear market, many institutions further diversified their portfolios by increasing policy allocation targets to private investments, hedge funds, and real assets at the expense of long-only equities, fixed income, and cash. These changes were likely driven by long-term strategic objectives and with liquidity considerations in mind. Yet, a prolonged bull market in both equities and bonds, combined with historically low volatility, have helped simple stock/bond portfolios deliver risk-adjusted returns against which diversified portfolios have struggled to compete. As a result, some investors may have come to question their decisions to increase portfolio diversification, yet such buyer’s remorse could be setting them up to abandon diversification at the wrong time. Those who dial back portfolio diversification now risk compounding their regret and leaving their portfolios whipsawed by a pick-up in downside market volatility whenever the cycle ultimately turns.
CUMULATIVE CHANGE IN MEDIAN TARGET ALLOCATION BY ASSET CLASS
2007–16 • Percentage Points
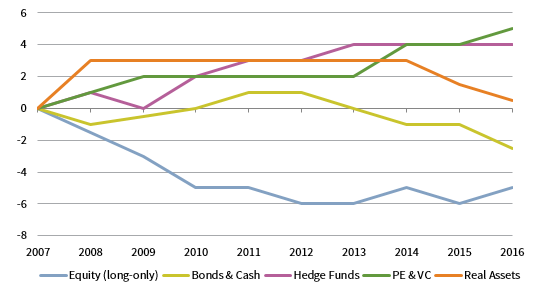
Source: Cambridge Associates LLC.
Notes: Median target allocations based on data from a constant universe of 69 institutions. Data for each year are as of June 30.
Measuring the performance impact of these asset allocation moves since the GFC would be a complicated and very imprecise exercise, and we have not attempted to do so for this piece. Yet, from an anecdotal standpoint, again based on our own institutional asset allocation survey data, the divergence in asset allocation trends between the top- and bottom-performing cohorts is stark. The top performers from September 2007 through June 2018 were those whose equity exposures had declined the least at the March 2009 market trough and had returned to their pre-crisis levels the soonest. In contrast, the bottom performers were those whose equity exposures dropped the most at the depth of the crisis, either because they didn’t meaningfully rebalance back into equities during the subsequent market recovery or because they chose to permanently cut portfolio risk from a long-term policy standpoint.
CUMULATIVE CHANGE IN MEDIAN EQUITY ALLOCATION BY PERFORMANCE QUINTILE
Third Quarter 2007 – Second Quarter 2018 • Percentage Points
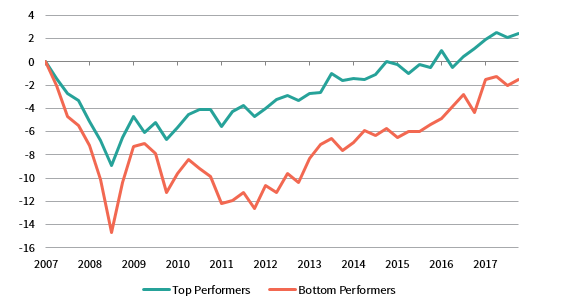
Source: Cambridge Associates LLC.
Notes: Median allocations based on quarterly data from a constant universe of 151 institutions. Equity allocation includes long-only public equity, venture capital, and non-venture private equity. Universe is divided by performance quintile based on cumulative returns from third quarter 2007 to second quarter 2018.
The role of private investments allocations is also a key factor distinguishing the performance leaders from the laggards. The top-performing institutions since the GFC have been those that started with and maintained the highest exposures to venture capital and non-venture private equity. As we recently discussed, exposure to illiquid private investments vehicles whose managers call down committed capital for investment over time can help institutional investors mitigate behavioral risks associated with market cycles, both by forcing them to stay more invested and by taking some of the investment timing decision out of their hands. Without needing to be fully invested at all times or being required to mark-to-market their portfolios daily, experienced and disciplined private investments general partners can take advantage of market downturns to use uncalled dry powder to purchase valuable assets at undemanding prices. They can also exploit bull market cycles to monetize the value created in their portfolio companies at attractive exit points when capital is abundant and markets are most receptive. Thus, private investments strategies, though their performance tends to be pro-cyclical, 3 potentially offer a natural countercyclical buy/sell discipline that may help counteract the tendency for investors to make pro-cyclical asset allocation decisions.
MEDIAN ALLOCATION TO PRIVATE INVESTMENTS BY PERFORMANCE QUINTILE
Third Quarter 2007 – Second Quarter 2018 • Percent (%)
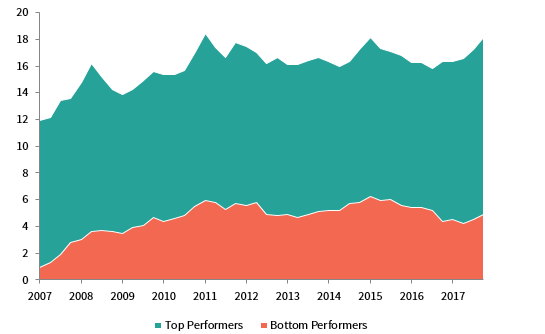
Source: Cambridge Associates LLC.
Notes: Data are sourced from a constant universe of 151 institutions. Private investments include venture capital and non-venture private equity. Institutions are broken down by performance quintile based on cumulative returns from third quarter 2007 to second quarter 2018.
Our long-standing capital markets research philosophy—“Read the history, do the math, understand what is different this time (and it’s usually nothing)”—pairs well with some practical strategies for neutralizing the dangerous behavioral biases that often arise during market downturns. As we discussed in a companion piece, the first step in surviving a bear market is periodically reviewing capital markets history to understand prior market downturns (how long they typically last, as well as how deep are the market declines). Armed with this knowledge, investors may be better able to remain grounded and rational in their decision making. As part of this exercise, investors should regularly stress test their portfolios to evaluate whether they can tolerate the extent of the paper losses their portfolios would likely suffer during a bear market. Mitigating the psychological impact of a market sell-off is certainly important, but maintaining sufficient liquidity for spending needs (including potential private investment vehicle capital calls) under a downside scenario is also critical to the long-term mission.
Successful long-term investors are those that, in the event of a major market dislocation, are able to meet their spending requirements, while still keeping strategic portfolio exposures near their policy targets to meet the portfolio’s long-term investment objective. To maintain strategic exposures, investment fiduciaries should delineate a specific rebalancing policy, as well as delegate execution responsibility to a specific subset of stakeholders, be it the investment committee or an execution sub-committee, investment office staff, or their outside investment advisor.
Importantly, when it comes to a portfolio rebalancing policy, the decision to rebalance is more important than the particulars of the underlying strategy. That is because the strategic objective of rebalancing is not performance optimization, but rather overall portfolio risk management. Any fixed weight asset allocation benchmark automatically incorporates periodic rebalancing and thus inherently embeds a contrarian value discipline, and therefore opting not to rebalance would be an active decision to underweight the value factor and to overweight momentum by allowing outperforming asset classes to run, and vice versa. It also would translate into greater tracking error and volatility and less diversification relative to the policy portfolio. When determining the optimal rebalancing frequency, investors should consider the benefit of holding their market exposure steady as well as the transaction costs associated with rebalancing.
Our research supports a rebalancing policy combining range (or deviation) rebalancing with cash flow rebalancing. Policy ranges should be set in proportion to both the target weighting and the underlying historical volatility, both on an absolute basis and relative to other portfolio exposures. Historical cross-asset correlations should also be considered. As a practical example, equities are substantially more volatile than bonds, and prices for equities and bonds have typically been negatively correlated during equity bear markets. Therefore, the equity policy range should be set wider as a percentage of the target weighting than the bond policy range. Related to this, rebalancing between equities and bonds will impact portfolio tracking error and volatility far more than rebalancing between, say, US and non-US equities.
A sound rebalancing policy should also stipulate how much to buy once the actual allocation moves outside the target range, and there are a few options to consider. Some simple rules would involve rebalancing the allocation back to the range threshold, halfway to the policy target, or fully back to target. We recommend rebalancing to halfway between the outer limit of the policy range and the target. Such an approach, in combination with policy ranges calibrated to target levels and underlying asset class volatilities and correlations, strikes a balance between value and price momentum, as well as reduces transaction costs by limiting the frequency of rebalancing. Aside from rebalancing moves driven by market volatility and policy ranges, investors should also look to take advantage of any cash inflows or outflows to move allocations closer to target to help minimize the drag from trading commissions and market impact associated with the overall rebalancing strategy.
Conclusion
As discussed, bear markets often trigger emotional responses that can sometimes lead investors to act contrary to their long-term objectives, which is why investors need simple strategies to help them to overcome their worst instincts. Recency bias caused by a steady drip of negative developments can shorten investors’ investment horizons and allow loss aversion to creep in, causing investors to cut risk at exactly the wrong time, or at the very least preventing them from rotating portfolios to maintain strategic risk exposures. Following such moves (or lack thereof), further market declines can make investors feel falsely vindicated and therefore further prone to act in conflict with their strategic interests.
Such behavioral pitfalls were on full display during the GFC, as many investors did not keep the expected risk/return characteristics of their portfolios adequately in line with the long-term financial goals embedded in the policy asset allocation. Some were slow to rebalance fully back into equities once the economic recovery was underway, others cut portfolio risk more permanently by reducing equity targets and increasing policy allocations to hedge funds, distressed credit, and other asset classes with less equity beta exposure.
In preparing for the next downturn, whenever it may occur, investors should certainly keep these behavioral tendencies and the hard experiences and lessons of the GFC (as well as from prior bear markets) top of mind. More importantly, they should also have in place a simple, but sound rebalancing policy—a plan that has full buy-in from all investment stakeholders—to serve as a risk management tool for surviving a prolonged market downturn.
Index Disclosures
Bloomberg Barclays US Aggregate Bond Index
The Bloomberg Barclays US Aggregate Bond Index is a broad-based bond market index representing intermediate-term investment-grade bonds traded in the United States.
MSCI ACWI Index
The MSCI ACWI captures large- and mid-cap representation across 23 developed markets and 26 emerging markets countries. With 2,844 constituents, the index covers approximately 85% of the global investable equity opportunity set. Developed markets countries include: Australia, Austria, Belgium, Canada, Denmark, Finland, France, Germany, Hong Kong, Ireland, Israel, Italy, Japan, the Netherlands, New Zealand, Norway, Portugal, Singapore, Spain, Sweden, Switzerland, and the United Kingdom. Emerging markets countries include: Argentina, Brazil, Chile, China, Colombia, Czech Republic, Egypt, Greece, Hungary, India, Indonesia, Korea, Malaysia, Mexico, Pakistan, Peru, the Philippines, Poland, Qatar, Russia, Saudi Arabia, South Africa, Taiwan, Thailand, Turkey, and the United Arab Emirates.
Footnotes
- As a stark reminder of the pervading sense of doom felt by even the most seasoned investment professional at the depths of the GFC, consider the following quote that appeared in a Financial Times article “Market crash shakes world” on October 10, 2008: “The events we’ve seen this week represent a once-in-a-generation increase in risk aversion and total lack of faith in the financial system surviving in its current state,’ said Graham Secker, equity strategist at Morgan Stanley in London.”
- For a more detailed discussion, please see Hersh Shefrin, Beyond Greed and Fear: Understanding Behavioral Finance and the Psychology of Investing, Harvard Business School Press, 1999. Additional book recommendations on this subject include Daniel Kahneman, Thinking, Fast and Slow, Farrar, Straus and Giroux, 2011, and Richard Thaler, Misbehaving: The Making of Behavioral Economics, W. W. Norton & Company, 2015.
- This is particularly true of buyout strategies.
About Cambridge Associates
Cambridge Associates is a global investment firm with 50+ years of institutional investing experience. The firm aims to help pension plans, endowments & foundations, healthcare systems, and private clients achieve their investment goals and maximize their impact on the world. Cambridge Associates delivers a range of services, including outsourced CIO, non-discretionary portfolio management, staff extension and alternative asset class mandates. Contact us today.