Pension Risk Management


Asset management and investment banking firms across the globe continue to develop a variety of liability driven investing (LDI)–focused products and solutions for the pension plan community; however, there remains broad confusion over the meaning of LDI. While most of these products and customized solutions attempt to hedge liability-related interest rate and inflation risks, such hedging is only a piece, albeit an important one, of a robust LDI framework.
Cambridge Associates views LDI as a holistic risk-budgeting framework useful to many types of institutions in overseeing asset pools that support institutional liabilities. An effective LDI framework allows an institution to evaluate asset allocations and portfolio implementation in the context of its relevant liability and unique organizational circumstances and risk tolerance.
A robust LDI framework seeks primarily to generate portfolio returns sufficient to fund the contractual liability and, in most cases, generate some excess return, but to do so in a risk-controlled manner. Theoretically, this framework will result in a more efficient investment solution and superior risk management, allowing institutions to better balance the potential rewards of higher returns with investment and organizational risks. LDI approaches focus on managing the relationship between the size of the asset pool and the related liability. This relationship is often referred to as surplus and the volatility of this relationship is referred to as surplus risk. The foundation of an LDI approach is assessing the sensitivities of the assets and liabilities to a variety of factors such as changes in interest rates, inflation, and a broad range of capital market environments. It also considers an institution’s financial health and the economic sensitivity of an institution’s operations or business. A wide variety of institutions, including banks, insurance companies, settlement trusts, and pension plan sponsors, have used LDI frameworks. This paper focuses on the application of LDI frameworks to defined benefit pension plans, but the broad framework and strategies discussed can be adapted to effectively address asset-liability management for other retirement plans and institutions.
Surprisingly, relative to insurance companies and other institutions, pension plans have been rather slow in adopting LDI risk frameworks. However, over the past decade, the global pension industry has more widely embraced LDI due to changes across global regulatory regimes that sought to increase institutional transparency and force sponsors to maintain more fully funded plans. 1 These changes required plans to value assets and liabilities using methods that more closely resemble mark-to-market measurement and, in most instances, also reduced smoothing mechanisms previously allowed in measuring plan assets and liabilities. Moving toward economic measurement of plan funded status resulted in greater volatility of reported funded status and thus increased volatility of periodic contributions, pension expense, and balance sheet measures.
Historically, many defined benefit pension plans employed a classic asset allocation strategy using asset-only frameworks where cash represents the theoretical zero-volatility asset class. For many institutions, including defined benefit pension plans, this framework ignores a large part of the risk equation—the risk relative to liabilities. Ignoring this risk leaves institutions inherently susceptible to sharp declines in equity markets. When accompanied by declining market-based liability discount rates, plans can find their asset values declining just as their liability values are increasing. The combination of sharp market declines and declining discount rates seen in the 2001–03 and 2007–09 periods resulted in a serious degradation of pension plan funded status. These events, which some have termed “perfect storms,” were neither perfect nor unlikely to occur. Although the timing of such squalls is always uncertain, historically they have occurred with some regularity.
Additionally, market declines that result in sizeable shortfall contributions often occur during periods of economic stress, when sponsors experience declining cash flows and have limited or expensive access to the capital markets. During these periods, increased contributions resulting from a decline in a plan’s funded status are particularly painful. Since plan contributions are typically contractual or legal obligations, the ramifications of not making required or planned contributions via operating cash flows or accessing the capital markets can have ominous consequences for the sponsoring entity. Regulatory changes over the past decade in the United States, Western Europe, and other parts of the world exacerbated the difficulty during these periods by shortening or eliminating the smoothing that was historically allowed in the calculation of a plan’s funded status and moving a plan’s surplus onto its sponsor’s balance sheet.
For these reasons, interest in LDI strategies has significantly increased. Many defined benefit plans have modestly adjusted their asset allocation and implementation based on LDI frameworks, yet few have fully employed more robust frameworks.
LDI Implementation and Pension Risk Management
To begin implementing an LDI process, a sponsor must identify its return objective and explicitly identify its ability and willingness to assume risk (risk tolerance). Sponsor risk tolerance, return goals, liability characteristics, and plan terms are the key parameters around which an LDI risk-budgeting framework is designed.
For defined benefit plan sponsors, the concept of risk tolerance generally focuses on identifying an acceptable range of funded status volatility, which derives from institutional tolerance for contribution and balance sheet volatility. An acceptable level of volatility can be defined either in percentage or monetary terms. Within an LDI process, funded status volatility is often referred to as surplus risk. A simple way to frame the issue of risk tolerance is to determine whether to make contributions more regularly but with a smaller range of potential contributions, or to make larger contributions in the hope of making them less frequently. A simple way to frame the issue of risk tolerance is to determine whether to make contributions more regularly but with a smaller range of potential contributions, or to make larger contributions in the hope of making them less frequently. 2 If a plan sponsor is more comfortable with a smaller range of potential contributions, then it would operate with a lower risk budget. However, sponsors would seek to maximize returns within the parameters of the relevant risk tolerance.
For a sponsor to understand its ability to take risk, it needs to understand how the plan’s surplus risk interacts with its operating risk (Exhibit 1) . In most cases, this entails understanding the relationship between the sponsor’s operations, capital market returns, and changes in market-based interest rates. Therefore, it is helpful to keep in mind the circumstances under which defined benefit pension plans experience the largest negative tail events—deflationary recessions or depressions when interest rates or discount rates decline significantly, and risk assets generally perform poorly. A number of plan characteristics can lower a sponsor’s risk tolerance (and the more of these characteristics that an institution has, the lower the risk tolerance is likely to be).
- Size of plan liability relative to the size of sponsor’s balance sheet. The larger the size of the defined benefit plan liability relative to the sponsor’s balance sheet, the lesser the sponsor’s ability to assume surplus risk.
- Potential size of future contributions relative to the organization’s projected free cash flow. This factor should be evaluated by considering the projected annual cost that results from participants accruing additional service time and understanding the range of potential payments that might be required to resolve potential underfunding. If an organization consistently generates minimal amounts of free cash flow across economic cycles, it decreases its ability to assume risk.
- Correlation of operations to the return of risk assets and changes in interest rates. Sponsors that have high levels of operating leverage and economic sensitivity may find that poor operating environments and increased cost of capital are undesirably correlated with negative tail events in pension surplus. Thus, sponsors with this operating profile will likely elect to implement plan oversight at lower risk levels
- Correlation of potential lump sum payments to drawdowns in plan surplus and sponsor financial health. Lump sum payments made when plans are underfunded will exacerbate the situation, resulting in further degradation in plan funded status and thus increased contributions. Lump sum payments are normally triggered by retirement or layoffs, which, unfortunately for many organizations, occur during periods of economic stress and negative plan returns.
- Funding time horizon of plan. Many regulatory regimes prescribe the maximum time allowed to rectify underfunding via additional contributions. Additionally, in some regulatory regimes, if a plan is fully frozen there may be little incentive for it to take risks, particularly a fully funded or overfunded plan. Gaining access to the excess assets generated from the higher returns can often take decades; however, if the risk results in a drawdown of plan surplus, the sponsor has to make additional contributions. This asymmetric risk-reward does not favor the sponsor. Funding time horizon is different from the horizon of liability payouts and is determined by funding regulations and whether participants continue to accrue benefits.
A sponsor’s risk tolerance is also defined by institutional willingness to assume risk and derives from the psychological and behavioral dynamics of the sponsor and the individuals responsible for plan oversight. Risk tolerance can be quantified simply as the monetary amount of surplus volatility an institution is willing and able to assume, with the constraint being the lesser of the ability or willingness to assume risk. This includes evaluating tolerance over various time horizons (e.g., annually, rolling three years, etc.) or focusing on tail event surplus risk.
Exhibit 1 MSCI World Index Performance and Sector Earnings per Share
December 31, 1995 – September 30, 2010
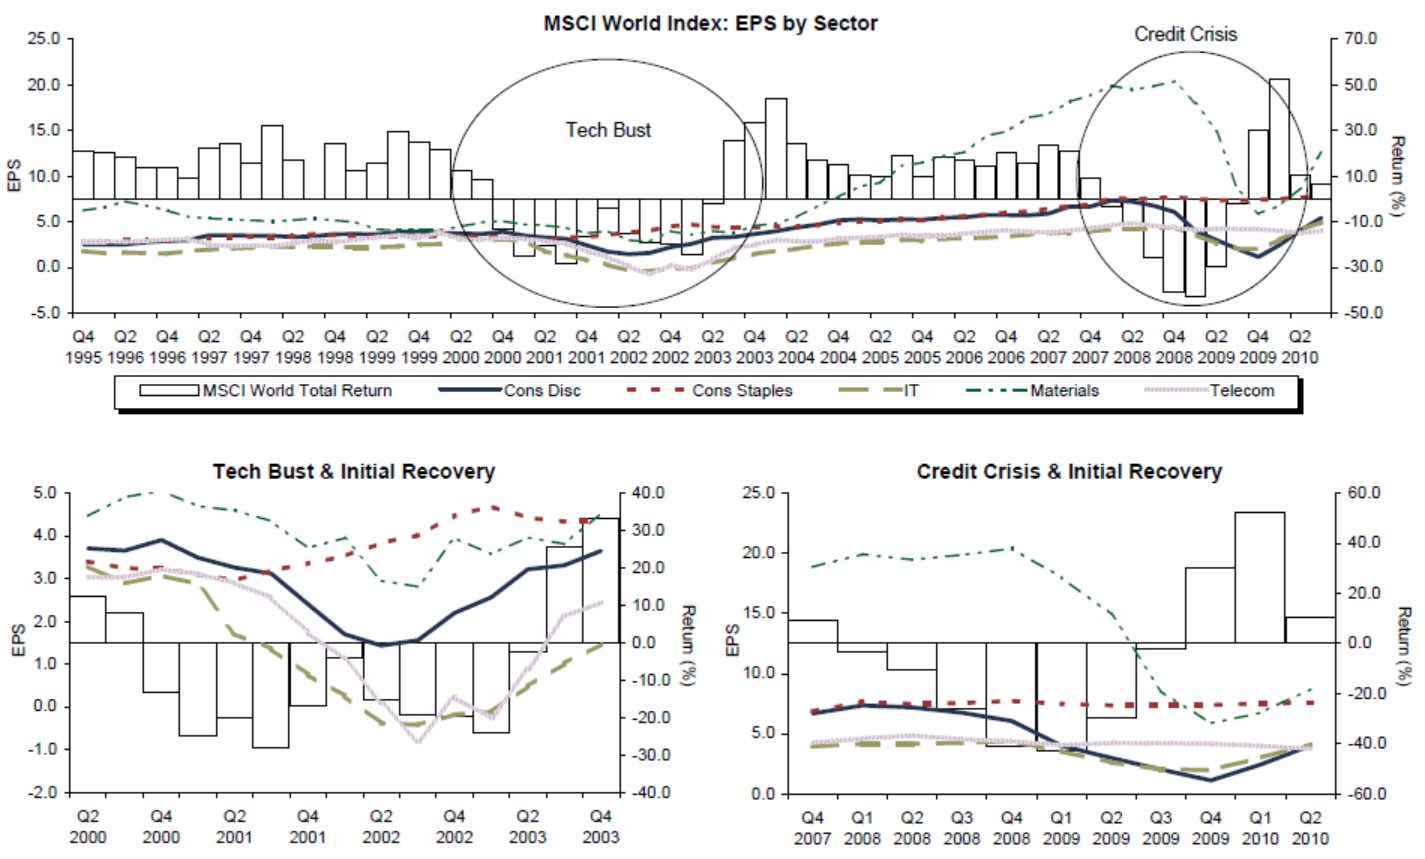
Sources: MSCI Inc. and Thomson Datastream. MSCI data provided “as is” without any express or implied warranties.
Note: MSCI World returns are cumulative trailing one year, and are net of dividend taxes.
Risk Budgeting
After defining risk tolerance, the focus shifts to connecting the assets and liabilities within the investment process. There are significant uncertainties associated with the future value of both the plan’s assets and the plan’s liability. Over time, changes in the value of the liability, excluding the effects of future accrued benefits, will be driven in large part by changes in interest rates, inflation, and variability around mortality assumptions. Investment decisions should be made using a comprehensive risk framework that evaluates asset returns and volatility relative to changes in a plan’s liability.
To create a framework that allows for an evaluation of risk relative to a liability, sponsors must understand the “risk-free,” or risk-neutral, position. The simplest way to define the risk-free asset pool is generally to identify the theoretical asset pool that “perfectly” hedges the liability. This theoretical risk-free asset is the zero relative volatility asset for an investment portfolio, which differs from a purely asset-based perspective where the theoretical risk-free asset is often considered high-quality sovereign cash. By using the liability, or risk-free asset, as a benchmark for plan assets, investment decisions become a risk-budgeting process that evaluates the trade-off between expected return and risk relative to the risk-free asset pool.
In very simple terms, forming a strategic asset allocation for a defined benefit plan involves a risk-budgeting process that weighs the decision of allocating assets between the following two theoretical portfolios:
- Hedging Portfolio. This portfolio attempts to minimize surplus risk.
- Growth Portfolio. This portfolio attempts to generate excess returns that sponsors target to reduce contributions. In essence, the excess return is used to offset a portion of future accrued benefits, thus reducing sponsor contributions. A significant portion of a plan’s risk-budgeting process will focus on creating a diversified growth portfolio of beta and active risk exposures. Importantly, the active risk exposures should be relatively uncorrelated to capital market betas and changes in interest rates. These active exposures include tactical asset allocation, manager selection, and manager structure.
A holistic pension risk-budgeting process should also focus on the levers within the two portfolios to create a capital- and surplus risk–efficient portfolio. For instance, simpler LDI frameworks assume that all growth portfolios have the same characteristics (e.g., exposures, excess return, and risk), which is obviously not necessarily true. By using levers within the growth portfolio, such as diversifying across beta and alpha sources and allocating more or less risk to beta and active components, growth portfolio surplus risk can be altered, thus changing the size of the hedging portfolio required to obtain a given level of risk. This allows for an array of plan portfolios that look distinctly different, but have similar expected liability relative to risk profiles. In the end, this process should focus on maximizing expected excess return for portfolios based on a sponsor’s acceptable level of surplus and institutional tail risk.
Hedging Portfolio
As the name suggests, the role of the hedging portfolio is to minimize the volatility of the plan’s assets relative to changes in the value of the plan’s unique liability, thereby reducing the volatility of plan funded status. The hedging portfolio in isolation may be the risk-free asset; however, for reasons discussed shortly, when implemented in conjunction with the growth portfolio, the ideal composition of the hedging portfolio may change. Unfortunately, the hedging portfolio is the primary area of focus for most practitioners of LDI and it only allows for a portion of the total risk reduction that can be achieved using a total portfolio risk-budgeting framework. In many cases, focusing solely on the hedging portfolio unnecessarily reduces long-term expected returns. There are typically two main risks that the hedging portfolio addresses: (1) changes in the liability value resulting from changes in interest rates, and (2)changes in the liability value resulting from changes in inflation. There are more nuanced hedges to consider. For instance, there is an evolving, yet immature market in mortality swaps, and most sponsors continue to focus on hedging inflation and interest rate risk.
One of the largest sources of funded status volatility is a plan’s sensitivity to interest rates. In theory, to create a “perfect” hedge with either the entire asset pool or a portion of the asset pool, a sponsor would buy physical and synthetic fixed income instruments with interest rates that have the same derivation as the discount rate. For instance, if the discount rate is based on the sovereign bond yield curve, then the “perfect hedge” would be a port-folio of sovereign bonds purchased in amounts equal to the present value of the future benefit payments for each year. For a fully funded plan with a sponsor willing to contribute amounts equal to all future accrued benefits, the plan could completely de-risk by investing all assets in this manner, thus minimizing interest rate and surplus risk.
The preceding example is simplified. Often the required discount rate incorporates other factors such as a credit spread, either market derived or prescribed (i.e., sovereigns + 150 basis points). Additionally, many defined benefit plans provide benefits that are indexed to inflation. In this case, the need to hedge out inflation risk in conjunction with interest rate risk makes global inflation-linked bonds and inflation swaps appropriate instruments to consider for a portion of the hedging portfolio. These are just a few of the variables and nuances in plan terms and regulatory regimes across the globe; however, the presence of other variables does not change the importance within this framework of identifying the theoretical risk-free asset.
While the hedging portfolio may sound straight-forward, in practice the actual implementation takes on a variety of approaches (of varying complexity) that can be used on a standalone basis or in a hybrid approach to mitigate a plan’s unique liability risk. Hybrid approaches use a combination of the strategies outlined below, which are ordered from least to greatest complexity and precision. 3
- Duration Matching. This approach attempts to match the real or nominal duration of the fixed income portfolio to the liability duration, typically using a single, more generic fixed income mandate. Although the approach is simple, there is significant basis risk relating to changes in the shape of the yield curve and possible credit spread mismatches.
- Segmented Duration Matching. Seeking to mitigate some of the yield curve risk, sponsors attempt to match the real or nominal duration of the fixed income portfolio and the liability, but do so using physical fixed income instruments in different maturity buckets (e.g., short, intermediate, long).
- Matching Cash Flows. A customized approach that pairs the projected cash outflows from the plan with physical securities that have similar cash flow characteristics. The sponsor creates a customized portfolio of zero coupon bonds, or strips, that mature at the time of all future payments in amounts equal to those payments. Implementing a strategy of this nature is difficult due to a lack of appropriate instruments, particularly on the longer part of the yield curve.
- Overlay. An overlay strategy uses derivatives (and sometimes leverage) to supplement a plan’s physical fixed income portfolio and to provide a more capital-efficient way to increase asset duration and inflation-hedging benefits. This is the primary manner in which a plan can increase its allocation to the hedging portfolio without decreasing the allocation to the growth portfolio, which implicitly reduces the expected return on plan assets. Overlay strategies also present an opportunity to use port-able alpha/beta platforms and synthetic equity.
Plans should also evaluate various derivative-based equity and interest rate tail risk hedging strategies due to the serious impact that some tail risk events have on plan funded status and a sponsoring organization’s financial stability. Tail risk hedges designed to protect against large declines in equity markets and interest rates may be of particular interest to plan sponsors.
Complications arise in creating a hedging portfolio when regulations prescribe non-market-based, or quasi-market-based, discount rates or inflation factors. For instance, sponsors are often allowed to use smoothed rates or required to use sovereign rates, plus some spread for risk (e.g., credit spread).Although these conditions present challenges, they do not eliminate the need for sponsors to understand plan risk or work to hedge unwanted risk exposures.
Ultimately, the approach used to build a hedging portfolio will depend on access to effective hedging instruments, the hedging portfolio’s tracking error target, permissible financial instruments, market conditions, and the structure of the growth port-folio. Hedging portfolio strategies are often isolated from growth assets and evaluated on a standalone basis. We disagree with this approach because there is often a significant interaction effect between the growth portfolio and the hedging portfolio, and the construction of each affects the magnitude of this interaction, as we discuss later in the paper.
Growth Portfolio
To reduce the amount of future contributions they are required to pay for future accrued benefits and/or to make up for plan deficits, sponsors are often willing to assume surplus risk in an attempt to capture excess returns. Growth portfolios are typically designed to generate returns in excess of the risk-free asset, and thus in excess of liability growth; however, we emphasize that these returns cannot be achieved without taking incremental risk.
For the purpose of this discussion, we will define surplus risk as the incremental units of risk generated by moving assets away from the “risk-free” asset, which in many cases is represented by the hedging portfolio. This risk is typically quantified by measuring the deviation of changes in the value of the asset pool and changes in the value of the liability, and is commonly referred to as surplus volatility or tracking error.
In an LDI framework, a significant amount of the surplus volatility can be attributed to the tracking error of the growth portfolio relative to the liability. For many sponsors and consultants, efforts to manage surplus risk focus almost exclusively on customizing and increasing the size of the hedging portfolio—construction of the growth portfolio is often an afterthought in the LDI process. Yet a “smarter” growth portfolio can, in many cases, reduce plan surplus risk by a similar magnitude as a custom hedging portfolio. Implementing a risk-controlled growth portfolio requires customization with a focus on maximizing expected return without taking unnecessary liability relative risk. Specifically, sponsors should focus on controlling the tracking error that certain market betas and exposures cause.
Historically, long-only equity exposure, along with a sprinkling of real estate and private equity, has dominated the growth portfolios of defined benefit pension plans. Furthermore, many sponsors have equity exposure that has not been effectively diversified across equity betas. Diversifying the growth portfolio across various betas and active exposures by employing a variety of strategies can create a portfolio that generates higher expected returns at a given level of expected risk. These strategies include passive and active long-only equity strategies, long/short equity hedge funds, excess return–oriented credit strategies, public and private real estate and natural resources investments, arbitrage-related hedge funds, and private equity.
Recall that economic and market environments that historically result in negative tail events for defined benefit plans tend to be characterized by deflationary periods of slow or no economic growth, declining interest rates (rising liabilities), poorly performing equity markets, and difficult operating environments for plan sponsors. In these environments, returns from equity betas often decline significantly at the same time that liability discount rates decline, thus magnifying negative tail events for defined benefit sponsors. It is not hard to see that returns generated from betas that are less correlated to global equities and uncorrelated active sources of return are preferred exposures. Of course, this assumes that these exposures have attractive expected return and risk characteristics. All things equal, plan sponsors will prefer a unit of return generated from an active exposure over a unit of return generated from equity beta exposure and should allocate their risk budgets accordingly.
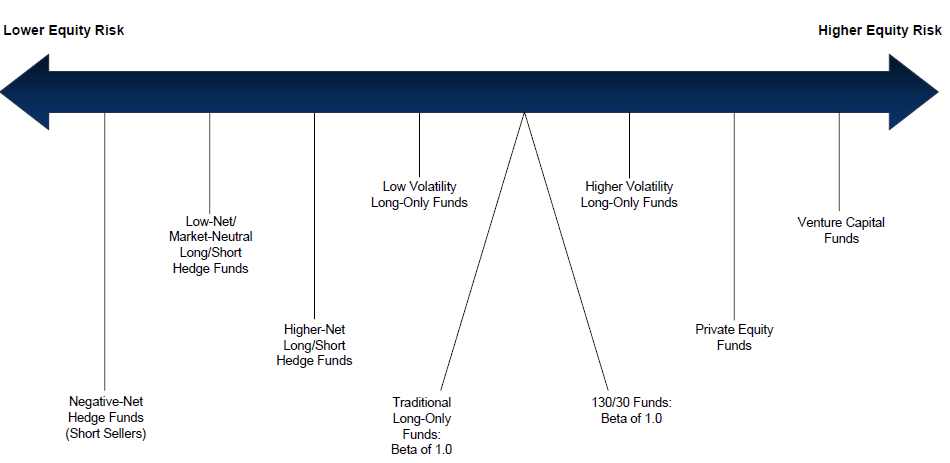
We are not implying that sponsors should allocate no risk to beta sources; however, within an LDI framework, there is a higher natural hurdle for including equity beta in a defined benefit plan’s growth portfolio. Within this framework of evaluating exposures, even considering this higher hurdle, sponsors should focus on maximizing their risk-adjusted return from various sources of equity beta. Allocations to private equity and real estate can provide diversified sources of beta and potential active manager value added, and thus higher expected returns. Additionally, allocations to private natural resources strategies may provide return enhancement, additional protection against unexpected inflation, a diversified source of beta, and potential alpha (Exhibit 2).
Exhibit 2 Risk Spectrum for Equity-Type Investments
Assuming institutions believe that they, or their advisors, have the skill and resources to identify active strategies and managers that add value, sponsors should create targets for various beta exposures and for active risk exposures. Successfully allocating additional risk to active sources of return or to betas that are less correlated to changes in interest rates allows for the creation of a more efficient surplus risk/return portfolio (Exhibits 3–7). 4 Creating portfolios with a more efficient surplus risk/return profile allows sponsors to increase the size of the growth portfolio and decrease the size of the hedging portfolio, thus increasing returns at a given level of surplus risk. Importantly, this more efficient portfolio also allows sponsors to maintain the same allocation to their growth and hedging portfolios, thus maintaining a similar level of expected return at a lower level of surplus risk. We would emphasize that a plan oversight strategy that allocates a significant amount of risk to active exposures must extensively diversify sources of active risk, or total plan surplus risk may increase.
Exhibit 3 Funded Status Stress Test Simulation: Summary of Inputs
This exhibit summarizes the composition of the four portfolios used in Exhibits 4–7.
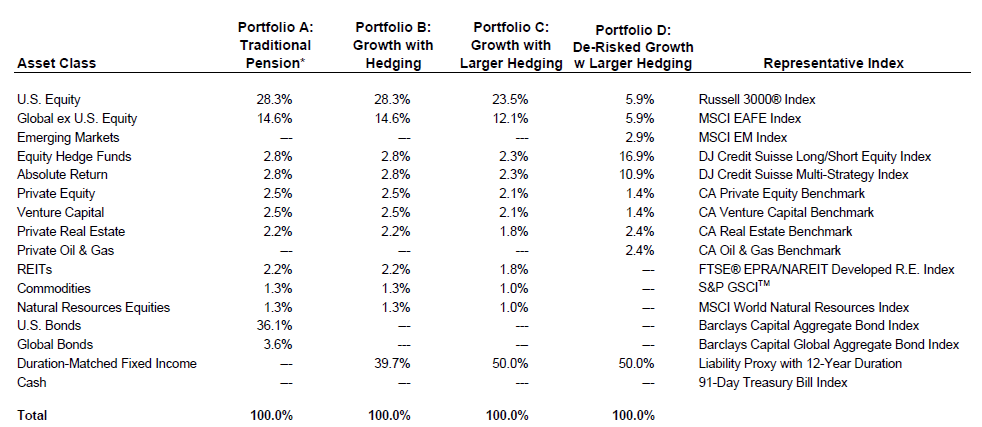
Sources: Barclays Capital, BofA Merrill Lynch, Cambridge Associates LLC, Credit Suisse, Dow Jones & Company, Inc., Frank Russell Company, FTSE International Limited, Greenwich Associates, MSCI Inc., Standard & Poor’s, and Thomson Datastream. MSCI data provided “as is” without any express or implied warranties.
Notes: Assumes quarterly rebalancing. The liability proxy shown in Exhibits 4–7 is simulated for 12-year duration. Proxy is created using a blend of the following fixed income indices: 27% BofA Merrill Lynch AA-AAA US Corporate 1-5 Year Index, 44% BofA Merrill Lynch AA-AAA US 10+ Year Index, and 29% 20-Year Zero Coupon Bond Index.
* Allocation of traditional pension portfolio is based on the 2009 Greenwich Associates Corporate Fund Dollar-Weighted Asset Mix of Defined Benefit Plans. Certain changes have been made to that asset mix to allow for more granularity at the asset class level in our analysis: the 4.4% in the Greenwich “Equity Real Estate” asset class is split equally between private real estate and REITs; the 5.0% in the Greenwich “Private Equity” asset class is split equally between private equity and venture capital; the 5.5% in the Greenwich “Hedge Funds” asset class is split equally between absolute return and equity hedge funds; and the 2.5% in the Greenwich “Other” asset class is split equally between commodities and natural resources equities.
Exhibit 4 Funded Status Stress Test: Technology Bust
April 1, 2000 – March 31, 2003 • U.S. Dollar

Notes: See Exhibit 3 for sources and portfolio compositions. Liability proxy is created using a blend of the following fixed income indices: 27% BofA Merrill Lynch AA-AAA US Corporate 1-5 Year Index, 44% BofA Merrill Lynch AA-AAA US 10+ Year Index, and 29% 20-Year Zero Coupon Bond Index.
Exhibit 5 Funded Status Stress Test: Recovery Example
April 1, 2003 – December 31, 2007 • U.S. Dollar
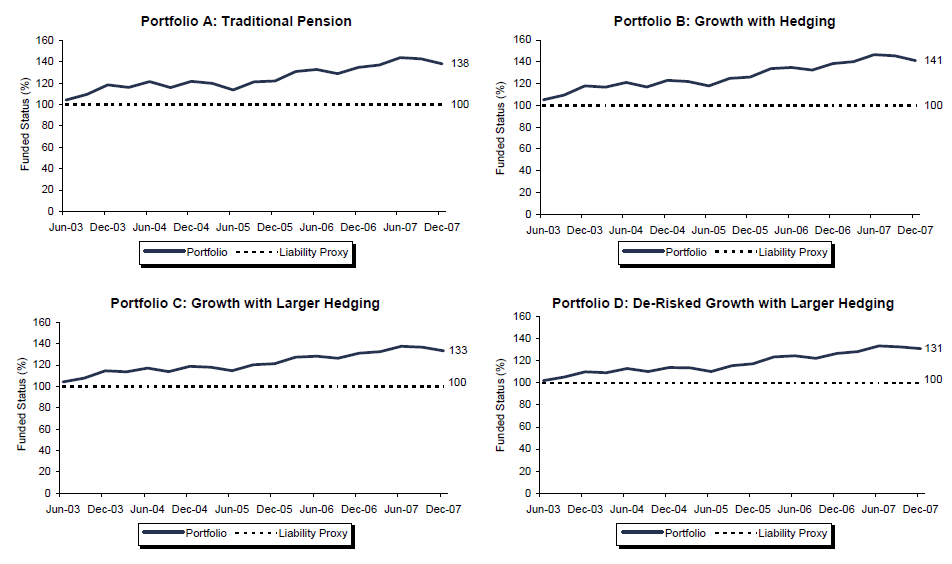
Notes: See Exhibit 3 for sources and portfolio compositions. Liability proxy is created using a blend of the following fixed income indices: 27% BofA Merrill Lynch AA-AAA US Corporate 1-5 Year Index, 44% BofA Merrill Lynch AA-AAA US 10+ Year Index, and 29% 20-Year Zero Coupon Bond Index.
Exhibit 6 Funded Status Stress Test: Full Cycle
April 1, 2000 – December 31, 2007 • U.S. Dollar
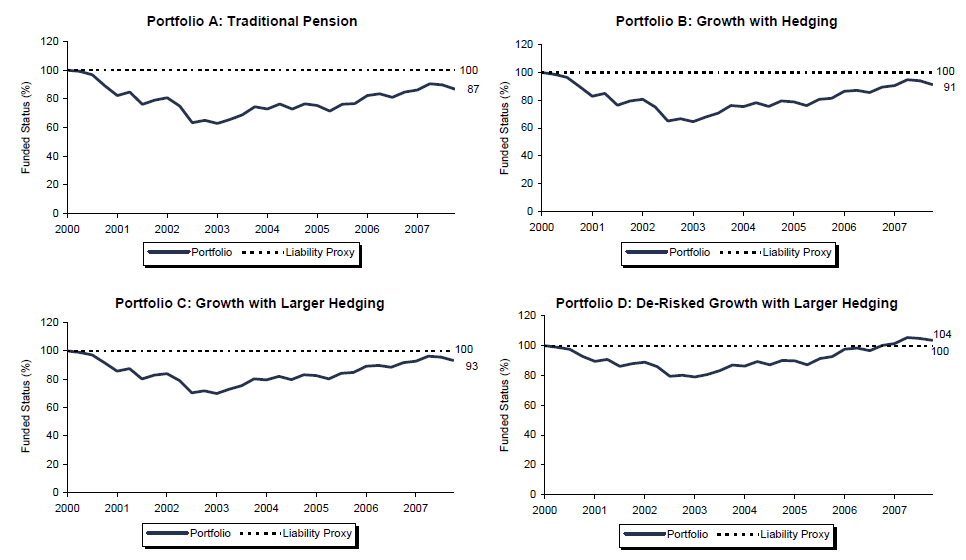
Notes: See Exhibit 3 for sources and portfolio compositions. Liability proxy is created using a blend of the following fixed income indices: 27% BofA Merrill Lynch AA-AAA US Corporate 1-5 Year Index, 44% BofA Merrill Lynch AA-AAA US 10+ Year Index, and 29% 20-Year Zero Coupon Bond Index.
Exhibit 7 Funded Status Stress Test: Credit Crisis
October 1, 2007 – March 31, 2009 • U.S. Dollar
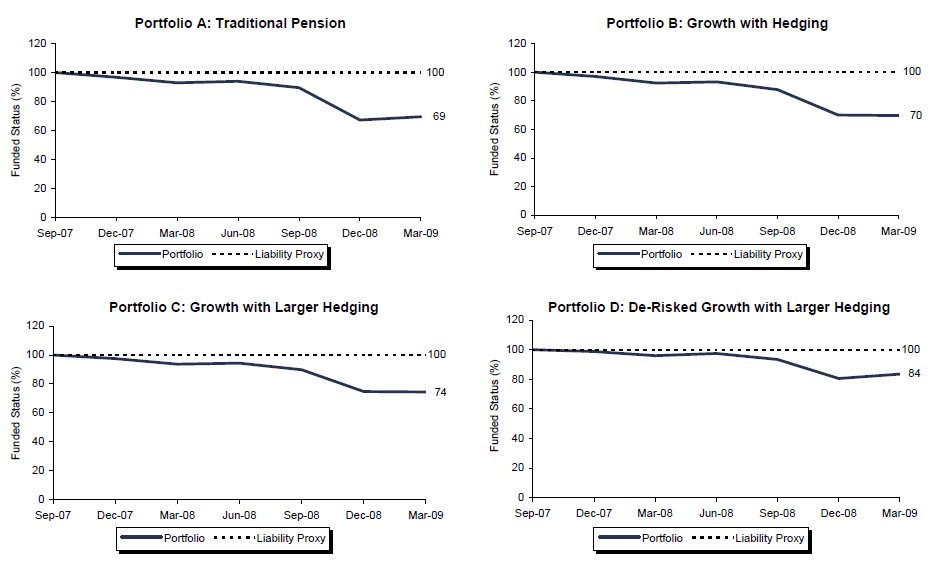
Notes: See Exhibit 3 for sources and portfolio compositions. Liability proxy is created using a blend of the following fixed income indices: 27% BofA Merrill Lynch AA-AAA US Corporate 1-5 Year Index, 44% BofA Merrill Lynch AA-AAA US 10+ Year Index, and 29% 20-Year Zero Coupon Bond Index.
The Dynamic Nature of Plan Oversight
Holistic pension plan portfolio oversight is a dynamic process due to a number of factors. The plan’s funded status, market valuations, and active opportunities are constantly evolving. After setting an appropriate range of surplus risk, plan sponsors will need to adjust portfolio exposures, as these factors change to allow a plan to stay within the range of acceptable risk. Adjusting exposures can be a challenging, multidimensional process that benefits from a robust risk-budgeting framework. An effective framework enables plan sponsors to assess and adjust their exposures in one part of their portfolio with an appreciation for the implications on other parts of the portfolio and the total portfolio in aggregate.
A sponsor can create desired exposures and risk profiles by changing the size and composition of both the growth and the hedging portfolio. When changing the composition of either, a sponsor must be sensitive to how the profile of one interacts with the other—the interaction effect. The risk of the growth portfolio affects the amount that should be allocated between the hedging and growth portfolios to maintain desired risk parameters. A secondary interaction effect occurs if the discount rate, and thus the risk-free asset, contains an embedded risk premium, such as a credit spread. For instance, if the liability discount rate is based on investment-grade credit rates, a pool of investment-grade bonds of similar maturity to the liability is only the theoretical risk-free asset when implemented in isolation (Exhibit 8). Equity beta is often strongly correlated with credit spread and, in some ways, behaves like high-octane credit. Therefore, if the size of the growth portfolio is large and contains significant equity beta, then a hedging portfolio made up entirely of investment-grade credit instruments will over hedge the plan’s spread risk. A more effective hedge would include sovereign instruments, although this will create some negative carry.
Exhibit 8 Interaction Effect: Five-Year Annualized Tracking Error Versus Liability Benchmark
April 1, 2005 – March 31, 2010
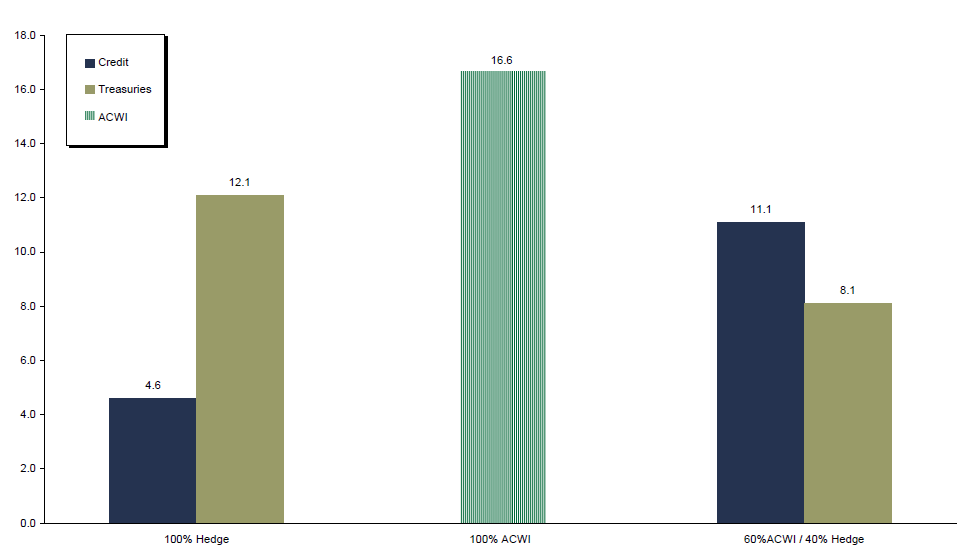
Notes: Credit is represented by the performance of the Barclays Capital Long Credit Bond Index and Treasuries is represented by the performance of the Barclays Capital Long Government Bond Index. The liability benchmark reflects the monthly change in a defined benefit pension plan’s liability resulting from the impact of changing interest rates and the passage of time.
The appropriate allocation across risk exposures will vary based on market valuations. If certain betas are very overvalued, thus increasing beta risk (Exhibit 9), sponsors should re-allocate that risk to other, more attractively valued beta sources, transfer the risk to active exposures, or, in extreme cases, de-risk and move exposures to the hedging portfolio. Taking these actions will allow the plan to maintain a targeted level of surplus risk. In contrast, if certain betas are unusually inexpensive, thus positively skewing the risk/return ratio of investing in that beta, it may be reasonable to increase the allocation to that beta-related risk and decrease other beta exposures, or reduce the budget to active sources of risk.
Exhibit 9 Relationship Between Normalized Real S&P 500 Price-Earnings Ratios and Subsequent Ten-Year Real AACR
1910–2009
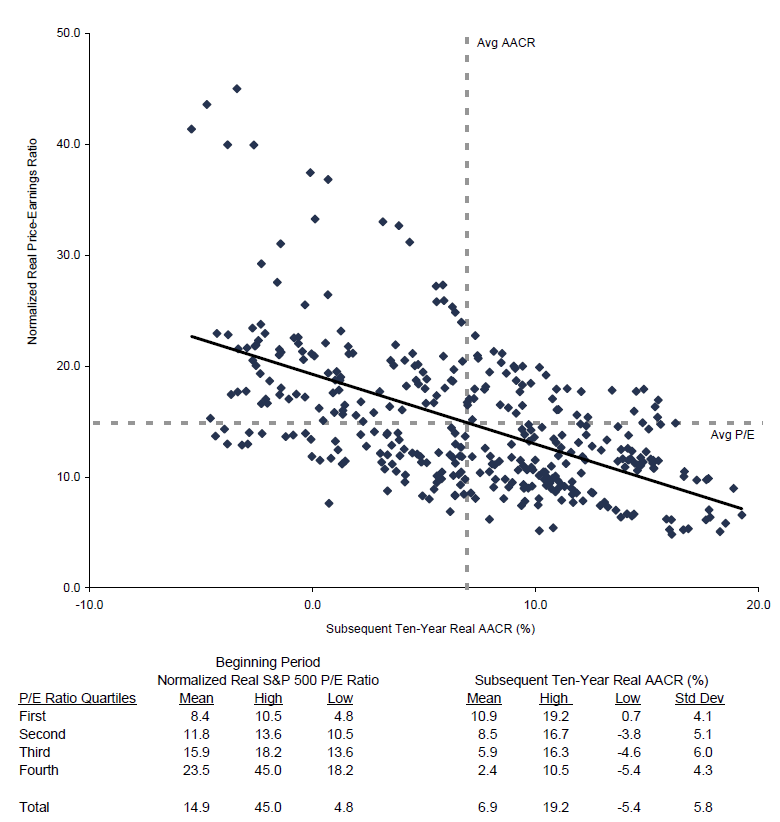
Sources: Calculated from data provided by Standard Poor’s, Standard Poor’s Compustat, Thomson Datastream, and The Wall Street Journal.
Notes: Based on quarterly data. The last full ten-year period was 1990 to 1999. Normalized real P/E ratios for the S&P 500 are calculated by dividing the current index value by the rolling ten-year average of inflation-adjusted earnings.
To maintain consistent risk parameters, asset exposures also have to be adjusted as changes in funded status occur. If the asset allocation and risk exposures are set when a plan is 100% funded based on a targeted level of risk, they will need to be adjusted if the plan moves to 120% funded or else the expected surplus risk of the plan will increase (Exhibit 10). In basic terms, the increase in surplus risk is a result of a leveraging effect that occurs when the value of assets exceeds the value of liabilities. The opposite effect occurs to a lesser magnitude when a plan moves from fully funded to underfunded.
Exhibit 10 Strategic Asset Allocation and Funded Status

Source: Cambridge Associates LLC calculations.
Notes: Asset allocation remains 60% growth portfolio/40% duration matched fixed income at all funded levels. The growth portfolio is made up of 25% U.S. equity, 25% global ex U.S. equity, and 10% emerging markets equity.
Conclusion
Rigorous plan oversight requires a holistic approach to risk management that starts with a plan’s financial goals and incorporates an institution’s unique risk tolerance. Identifying the theoretical risk-free asset, as well as acceptable levels of plan surplus and tail risk, allows for the creation of a robust risk-budgeting framework. A total portfolio risk-budgeting framework views the growth and hedging portfolios individually and as a whole. This framework is a powerful tool for allocating risk across various beta and active exposures and for hedging out undesirable risks. It can result in a portfolio that generates a significantly more attractive risk/return profile relative to liabilities. However, implementing this framework is not without its challenges.
- In many regulatory regimes, the sponsor is responsible for establishing and funding pension plans as well as fiduciary oversight of plan assets. In this paper, the term sponsor applies to both the institution responsible for plan funding as well as the trustees responsible for plan oversight. However, it should be noted that in many regulatory regimes, the two functions are viewed as having conflicting goals and the funding and fiduciary oversight of plan assets are legally segregated functions with distinct organizations or people responsible for fulfilling the role of each.
- In the latter scenario, these contributions are more likely to take place at peak periods of stress for the plan sponsor’s operating business.
- The precision of these hedges attempts to address various basis risks that occur due to imprecise hedging (e.g., curve risk, credit spread).
- Due to varying rules across pension regulatory regimes, it is necessary to select one framework on which to base all exhibits. For the purpose of the historical simulation exhibits, we elected to use assumptions related to the U.S. pension regulatory framework and thus all asset class returns are stated in dollars. Despite the nuanced differences in global pension rules and regulations, the concepts depicted in the exhibits are broadly applicable across regions.
Footnotes
- In many regulatory regimes, the sponsor is responsible for establishing and funding pension plans as well as fiduciary oversight of plan assets. In this paper, the term sponsor applies to both the institution responsible for plan funding as well as the trustees responsible for plan oversight. However, it should be noted that in many regulatory regimes, the two functions are viewed as having conflicting goals and the funding and fiduciary oversight of plan assets are legally segregated functions with distinct organizations or people responsible for fulfilling the role of each.
- In the latter scenario, these contributions are more likely to take place at peak periods of stress for the plan sponsor’s operating business.
- The precision of these hedges attempts to address various basis risks that occur due to imprecise hedging (e.g., curve risk, credit spread).
- Due to varying rules across pension regulatory regimes, it is necessary to select one framework on which to base all exhibits. For the purpose of the historical simulation exhibits, we elected to use assumptions related to the U.S. pension regulatory framework and thus all asset class returns are stated in dollars. Despite the nuanced differences in global pension rules and regulations, the concepts depicted in the exhibits are broadly applicable across regions.
David Druley, CFA - David Druley is the Chief Executive Officer at Cambridge Associates.
Michael Dunleavy, CFA - Mike Dunleavy is a Managing Director for the Retirement, Insurance & Government Practice at Cambridge Associates.
About Cambridge Associates
Cambridge Associates is a global investment firm with 50+ years of institutional investing experience. The firm aims to help pension plans, endowments & foundations, healthcare systems, and private clients achieve their investment goals and maximize their impact on the world. Cambridge Associates delivers a range of services, including outsourced CIO, non-discretionary portfolio management, staff extension and alternative asset class mandates. Contact us today.