Overestimating Liquidity Needs Can Undercut the Return Potential of US Pension Plans


Many defined benefit plan sponsors may be denying themselves valuable opportunities to generate additional returns by overestimating their liquidity needs. Although market crises are generally short lived, they serve as a reminder to plan sponsors of the need to be prepared for any eventuality. Sharp equity drawdowns and periods of bond market illiquidity can highlight the importance of adopting an overall liquidity framework that properly balances capital requirements with return goals.
While each plan sponsor requires unique investment solutions, all plans would be well served by actively considering supply and demand curve dynamics as they manage their liquidity needs. Targeting a liquidity supply to liquidity demand ratio of 2x–3x can help ensure a conservative portfolio profile that is well suited to tolerating periods of market stress.
Defining Liquidity
Liquidity is defined as the ease with which an asset or security can be sold for cash within a reasonable period of time without causing a drastic change in price. Expanding on this definition, markets themselves can be more liquid or illiquid, depending on the number of market participants that are willing buyers and sellers. In highly liquid markets, an ample number of willing buyers are looking to purchase what sellers are making available. In less liquid markets, sellers have fewer willing buyers. In the latter circumstance, sellers can either postpone a sale until market liquidity improves or sell to the highest current bidder at a price below their initial expectations. Notably, market liquidity can vary across asset classes; the market for US Treasuries, for example, is considered highly liquid, whereas the market for interests in privately held companies is less liquid.
Portfolio Liquidity and Pension Plans
For plan sponsors, the term “liquidity ratio” refers to a defined benefit plan’s sources of liquidity versus its demands on liquidity. As in all other portfolios, overall liquidity in pension portfolios is a function of asset allocation. A portfolio composed of 50% private equity and 50% venture capital, for example, would incur exceptionally higher trading costs when looking to reposition relative to a more diversified portfolio containing more liquid holdings.
Given this dynamic, a simple—and very liquid—portfolio may seem appealing to plan sponsors, particularly those nearing termination or a large risk transfer. However, this is typically not an optimal solution. In fact, many sponsors overestimate their required amount of portfolio liquidity, which can cause them to incur significant opportunity costs by excluding more illiquid or semi-liquid investment strategies. According to Cambridge Associates research, investors have the potential to gain 50–75 bps in additional total portfolio returns for every 10% of global equity capital that is reallocated to private investments such as private equity and venture capital. 1
The Liquidity Supply Curve
As they consider the liquidity constraints of their portfolio, plan sponsors can think about liquidity in terms of a supply curve. Put another way, they can consider the supply and the marginal cost of creating liquidity. In a typical market environment, a defined benefit portfolio that is diversified across asset classes can maintain a relatively low marginal cost of liquidity as long as market-wide buying and selling dynamics are generally healthy and the plan is receiving a regular inflow of contributions. In this positive market environment, the supply curve is very flat, with the portfolio’s growth assets providing liquidity.
Yet in strained market environments, the marginal cost of generating liquidity rises sharply and the time needed to generate liquidity may extend. This is because even the most liquid assets can experience liquidity crises during periods of market stress. Stressed markets are less liquid markets (Figure 1). That is, a sharp decline in one market creates capital constraints and results in a rush to liquidate assets, often in unrelated markets. It follows that prices continue to decline as bid/ask spreads and borrowing costs increase. Historically, numerous examples of this scenario have occurred. Since 1970, the median peak-to-trough drawdown of US equity bear markets is 18 months, with the longest drawdown lasting 25 months. Figure 1 depicts the general impact these periods of market stress can have on portfolio liquidity.
FIGURE 1 MARKET STRESS IMPACTS THE LIQUIDITY SUPPLY CURVE

Source: Cambridge Associates LLC.
Note: For illustrative purposes only.
Although equities are considered a reliable source of liquidity, a sell-off in equity assets can make them more attractive from a valuation standpoint, and selling equities at a low point can be particularly harmful to a plan’s long-term returns. Importantly, stressed market environments may also delay or reduce a plan sponsor’s ability to make plan contributions. It follows that during periods of market stress, cash and fixed income are the primary sources of liquidity for many pension plan portfolios.
In down markets, plans with well-calibrated portfolio liquidity have a greater capacity to reposition in a timely manner without incurring significant trading costs. Figure 2 illustrates the overall liquidity of a hypothetical pension portfolio relative to its asset allocation in a reasonably normal market environment. Using this framework, consider a plan that is 80% funded with $800 million allocated between growth assets (70% of the portfolio) and liability-hedging assets—or assets that are less liquid but can provide additional growth and risk protection (30% of the portfolio). In this example, a liquidity ratio of 2x–3x, combined with a conservative risk profile, leaves the portfolio positioned to endure market stress while remaining poised to pursue opportunities made available by market dislocations.
FIGURE 2 LIQUIDITY AND ASSET ALLOCATION OF HYPOTHETICAL PENSION PORTFOLIO IN TYPICAL MARKET ENVIRONMENT
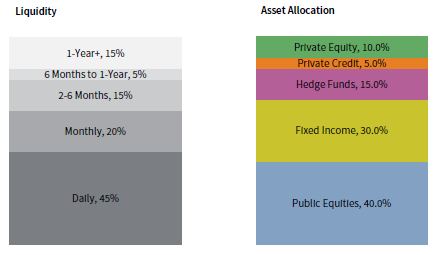
Source: Cambridge Associates LLC.
Note: For illustrative purposes only.
Sponsors can think of the liquidity needs of their portfolio in parallel to potential liquidity constraints by considering a liquidity demand curve, formed by obligations that they must meet (or non-discretionary demands) and secondary (discretionary) demands (Figure 3). Not surprisingly, benefits payments typically constitute the largest legally mandated demands on liquidity for a defined benefit plan. In relatively normal market environments, the timing and magnitude of these payments are largely known. However, in a stressed market scenario, sponsors may need to be prepared for heightened calls for liquidity, including potential increases in lump sum benefits payments resulting from layoffs.
FIGURE 3 LIQUIDITY DEMAND CURVE
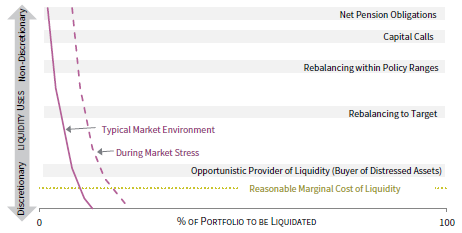
Source: Cambridge Associates LLC.
Note: For illustrative purposes only.
Private investment capital calls can represent an additional, less predictable, and legally required demand on liquidity. The nature of capital calls will depend on factors such as the composition and maturity of the private investment portfolio and market conditions. Historically, we have seen a decline in contributions as general partners assess the portfolio impact of volatile markets and adjust to the new environment. This can result in a lag for new deals as buyers and sellers find new price equilibriums. These capital calls are typically 25%–35% of normal levels.
In cases where policy target ranges are in jeopardy of being breached, the need to rebalance will represent another non-discretionary demand on liquidity. In more normal market environments, rebalancing needs are often supported through the plan’s liquid assets in the growth sleeve of the portfolio. In this scenario, a plan can expect that between 3% to 7% of total assets will be used for rebalancing purposes in a given year. In a stressed market environment, plans should allocate a portion of their available liquidity back to growth assets so as to participate in any subsequent market recovery. This amount will vary based on the size of the growth portfolio and severity of the market drawdown. By way of illustration, Figure 4 depicts in percentage terms the amount a 70/30 bond/equity portfolio would need to rebalance to cover a divergence in returns.
FIGURE 4 SIMPLE PORTFOLIO REBALANCING NEEDS
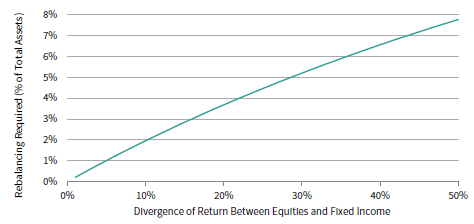
Source: Cambridge Associates LLC.
Combining Curves
Ideally, a pension plan’s liquidity supply and demand curves will intersect around the low end. This is depicted in Figure 5 as the dotted line labeled “reasonable marginal cost of liquidity.” Well-designed plan portfolios can meet liquidity demands as they occur without suffering exceptionally higher costs. Plan portfolios with insufficient supply to meet demand run the risk of incurring a cash crunch that could prove highly detrimental to long-term returns and plan objectives. At the same time, plans with excess liquidity (or those with supply greater than 2x–3x demand) bear a significant opportunity cost by excluding higher return-generating assets despite having the capacity to invest in them. This can result in plan sponsors making larger contributions over time than they otherwise would with a more capital-efficient portfolio. Targeting a liquidity ratio of 2x–3x can help plans maintain a reasonable cost of liquidity while enhancing overall portfolio returns and reducing contributions.
FIGURE 5 INTERSECTION OF LIQUIDITY SUPPLY AND DEMAND CURVES
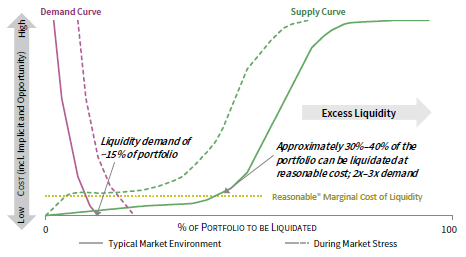
Source: Cambridge Associates LLC.
Note: For illustrative purposes only.
Pension Plan Liquidity Across Market Conditions
There is a meaningful difference between normal market liquidity and liquidity levels during periods of market stress. As volatility increases, liquidity can quickly fade for short periods, even across asset classes typically considered to be highly liquid.
Figure 6 depicts how liquidity supply can differ across more normalized market environments versus periods of market stress. The primary supply in the illustrative plan comes from cash and higher-quality fixed income. Equities are excluded because in a sell-off equity assets will be underweight in the portfolio and more attractive from a valuation standpoint. This makes the use of those assets unattractive for liquidity purposes. These figures also assume that distributions from private investments are zero and contributions remain comparable to more normal environment levels.
FIGURE 6 ILLUSTRATIVE PLAN – LIQUIDITY SUPPLY
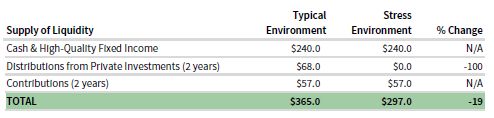
Source: Cambridge Associates LLC.
Note: For illustrative purposes only.
Figure 7 demonstrates how demands on liquidity can differ across more normal market environments versus down-market periods. In this example, annual benefit payments are assumed to be $60 million per year and capital calls are $21 million per year, which reduce to one third of that amount in a “stress” environment. The stress environment column assumes a down-market duration of two years.
FIGURE 7 ILLUSTRATIVE PLAN – LIQUIDITY DEMANDS

Source: Cambridge Associates LLC.
Note: For illustrative purposes only.
In this scenario, our illustrative portfolio would have rebalancing needs of approximately $85 million resulting from the stressed market scenario, keeping in mind that asset price volatility increases the frequency and magnitude of rebalancing. 2
Discretionary or optimistic demands on pension portfolio liquidity occur most often during periods of market stress—when anxious and forced selling behavior increases the attractiveness of available liquidity. Thus, it’s possible for plan sponsors to establish the goal of explicitly pursuing liquidity provision opportunities as part of their overall liquidity framework. This kind of liquidity demand planning requires that plan sponsors establish situational projections of non-discretionary demand as accurately as possible. Demands such as benefits payments, capital calls, and rebalancing will vary depending upon market conditions.
Even over the course of a hypothetical two-year period of bear market conditions, the example defined benefit pension plan above demonstrates an ability to meet obligations while maintaining a consistent asset allocation and risk profile.
Conclusion
Effective liquidity management is a key risk management function for plan sponsors and can help ensure that they meet their contractual obligations to participants and external managers across all market environments. This is particularly important for those plans that are looking to maximize risk-adjusted returns by employing less liquid investments such as private investing strategies. To avoid a potential cash crunch during periods of market stress that would be detrimental to a plan and its long-term performance, targeting a liquidity supply-to-demand ratio of 2x–3x is recommended.
Footnotes
- Based on Cambridge Associates’ return-to-normal assumptions as of September 30, 2021. Private investments include a 50/50 blend of private equity and venture capital. Global equity includes US, Developed ex US, and emerging markets equities.
- For rebalancing purposes, plan sponsors may want to consider public and private equity holdings together as total equity exposure. This can allow for the total allocation to be better managed as the portfolio’s equity composition changes.
Michael Dunleavy, CFA - Mike Dunleavy is a Managing Director for the Retirement, Insurance & Government Practice at Cambridge Associates.
About Cambridge Associates
Cambridge Associates is a global investment firm with 50+ years of institutional investing experience. The firm aims to help pension plans, endowments & foundations, healthcare systems, and private clients achieve their investment goals and maximize their impact on the world. Cambridge Associates delivers a range of services, including outsourced CIO, non-discretionary portfolio management, staff extension and alternative asset class mandates. Contact us today.