Constructing a Liability Hedging Portfolio: A Guide to Best Practices for US Pension Plans


Executive Summary
- To construct an effective liability hedging portfolio, a key first step is to evaluate the variety of ways liabilities can be calculated and discounted and to identify the most relevant liability metric for a plan sponsor’s circumstances. Plan sponsors should also define the acceptable level of surplus risk and carefully consider the appropriate duration of the liability hedging assets—shorter duration assets often have a meaningful mismatch to most defined benefit pension liabilities.
- Plan sponsors should not construct a liability hedge in isolation, as the size and composition of both the growth portfolio and liability hedge will have important implications for each other. Since the end goal is to maximize portfolio return at a controlled level of risk, the liability hedging portfolio should not attempt to perfectly immunize a cash flow stream—an extremely difficult task when considering real world constraints of corporate bond issuance, transaction costs, and liquidity—but rather optimize duration, curve, and credit spread exposures within the broader context of the total plan’s risks related to both its assets and liability.
- We recommend plan sponsors consider the use of more complex fixed income structures to manage their liability hedge programs. Most notably, we believe prudent use of derivatives (and, implicitly, some degree of portfolio leverage) should be considered, as bond futures, interest rate swaps, swaptions, and other techniques provide far more flexibility to optimize the portfolio when compared to a plain vanilla physical bond portfolio. Derivatives may also allow for a more capital-efficient liability hedging allocation, which we believe is paramount when looking at the low level of return provided by fixed income in the current environment. Still, even with these derivatives-based strategies, a “perfect hedge” is not attainable.
- Plan sponsors should think carefully about the active management implications of constructing the liability hedge, particularly for those plans that target low surplus volatility and maintain heavy allocations to fixed income. In normal environments, a plan with the majority of its liability hedging assets devoted to bond managers (typically with moderate tracking error) will not be able to generate the same level of value add as a plan with a more diversified portfolio invested in higher active risk strategies such as equities, hedge funds, and private investments.
- Best practices when developing a liability hedging framework include:
- Understanding and defining the liability,
- Quantifying acceptable surplus risk,
- Acknowledging the basis risks in replicating the liability hedging benchmark,
- Monitoring the interaction of credit and equities,
- Emphasizing capital efficiency given the lower returns of liability hedging assets, and
- Considering derivatives as part of the toolkit.
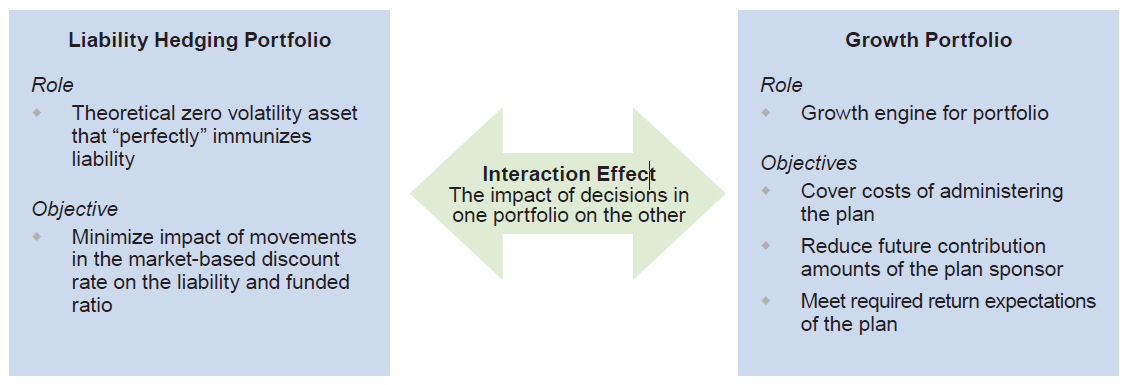
The construction and calibration of a liability hedging portfolio is integral to effective risk management of a pension portfolio. As we discussed in our report Pension Risk Management, liability hedging portfolios should not be developed in a vacuum, as the growth portfolio will have an interaction effect on the risks and returns of the liability hedge (Figure 1). Further, as we described in Pension De-Risking—A Better Solution, the size of the liability hedge may be impacted by an overarching “glide path.” This report focuses exclusively on the liability hedge allocation, delineating what we believe are key considerations and best practices for this rate- and spread-driven portfolio.
Figure 1. A Holistic Approach to Plan Assets: Decisions in One Portfolio Impact the Other
This report has five main sections. The first reviews the role of the liability hedging portfolio and discusses the importance of plan sponsors understanding and identifying the most relevant liability metric for their circumstances. Quantifying the acceptable level of surplus risk for the plan is also important, and we discuss the calculation of a hedge ratio to provide plan sponsors with a more accurate understanding of how much of the liability is hedged. We next examine pitfalls of matching the liability given the real world constraints of corporate bond issuance, transaction costs, and liquidity. Given these constraints, we share our view on the construction of the liability hedging portfolio, which should not attempt to perfectly immunize a cash flow stream, but rather optimize duration, curve, and credit spread exposures within the broader context of the total plan’s risks related to both its assets and liability.
In the section on implementation options, we review benefits and drawbacks of physical fixed income, the more traditional approach, and synthetic fixed income. Finally, we examine alpha considerations within the liability hedging portfolio and the implications of maintaining a large allocation to the liability hedge.
Role of Liability Hedge Portfolios
Pension plan assets are invested with the objective of meeting current and future payouts to plan participants. The annual cash flows that represent the plan’s future obligation to participants often span a number of decades, which necessitates the calculation of a discounted present value that can be compared to a marked-to-market asset value, enabling evaluations of how healthy (or funded) a plan might be at a given point in time. The discount rate, which is based on the level of interest rates, is one of the most critical factors affecting the liability. US pension plans subject to ERISA have generally used corporate bond yields for the discounting calculation. However, plans have long adopted allocations that seek not only to protect the plan from moves in interest rates, but also to generate superior returns to help offset the cost of the plan’s future accrued benefits. Pension assets thus need to be invested in a holistic manner to ensure growth to help cover the cost of future liabilities, while still hedging to some extent against discount rate movements. These two, sometimes competing, objectives result in an asset allocation approach with two main categories:
- Growth Portfolio. The goal of the growth portfolio is to generate excess returns to strengthen the plan’s funded status over the long term and to help pay for future benefit accruals, mitigating the size of needed contributions to the plan. The growth portfolio is typically composed of public and private equity, hedge funds, commodities, and high-yield credit (among other assets). The common thread that ties these assets together is their equity market risk, or “beta.” Under normal market conditions these assets are expected to produce positive returns, contributing to the growth of the plan assets.
- Liability Hedging Portfolio. The goal of the liability hedging portfolio is to minimize the volatility of the plan’s assets relative to changes in the value of the plan’s unique liability. While the composition of the optimal liability hedging portfolio varies and will be discussed in more detail later in this report, fixed income assets and related derivatives almost always serve the role given the interest rate sensitivity of both fixed income assets and the discount rate applied to pension obligations. The rate sensitivity can be decomposed into changes due to general interest rates (as proxied by US Treasuries) as well as the level of credit spreads (amount by which corporate bond yields exceed Treasury yields).
Defining the Liability
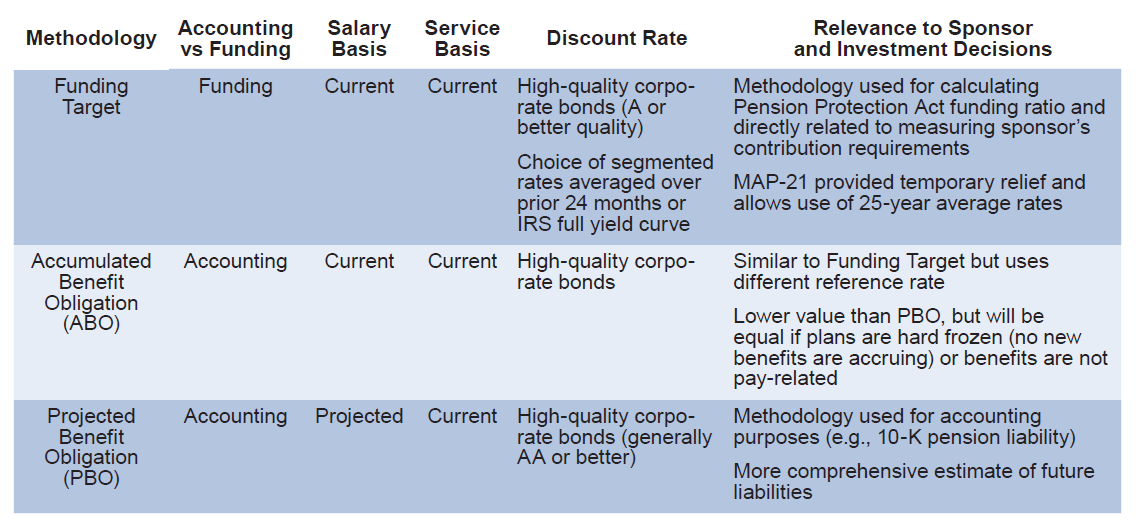
To construct an effective liability hedging portfolio, a key first step is to evaluate the variety of ways liabilities can be calculated and discounted. The three primary methods for calculating plan liabilities are accumulated benefit obligation (ABO), projected benefit obligation (PBO), and funding target.
The ABO and PBO methodologies are accounting-related, generated to show the impact of changes in the plan on a plan sponsor’s financial statements. ABO embeds current salary and current service levels in the calculation while PBO creates a higher threshold by assuming future salary increases in its calculation. Many plans favor the ABO methodology to define their “target” liability while the PBO calculation is a higher threshold. However, the PBO methodology underpins values shown on many financial statements, particularly the balance sheet, and influences pension-related expenses.
The funding target methodology is a funding-related calculation generated to determine the plan’s health as measured by a threshold for acceptable funding levels. The funding target methodology uses similar cash flows and assumptions as in the ABO calculation and impacts the sponsor’s cash contribution requirements. Recent legislation known as MAP-21 has materially impacted funding target calculations by allowing plan sponsors to use higher reference rates (based on a 25-year moving average) in the calculation. This lowers the present value of pension liabilities and required contributions, providing some relief to sponsors (the relief is temporary as the effects of MAP-21 will fade away over the coming years). However, because MAP-21 has created a more favorable treatment of liability present values that deviates greatly from a “mark-to-market” approach, some plans have shifted to accounting-based methods (ABO or PBO) when evaluating the movement and risks associated with their liability to better account for necessary future contributions after the expiration of MAP-21 relief.
Table 1 summarizes the variety of liability methodologies that are disclosed in a typical actuarial report. Plan sponsors should identify for themselves which methodology is most pertinent when thinking about the risks of the plan. For instance, if a sponsor’s primary concern is to mitigate the volatility of the plan’s liabilities on the balance sheet, the sponsor would pay close attention to the PBO estimate of its liabilities. But if the sponsor wants to reduce the volatility of its annual cash contribution, the funding target liability would be the right metric to monitor and manage.
Table 1. Identifying the Most Relevant Liability for the Sponsor’s Needs
Although inflation has an indirect influence on the PBO in terms of assumed salary growth, inflation typically does not meaningfully influence liability measurement for most US plans. Unless explicitly stated in the plan’s provisions, US defined benefit pension benefits are usually defined as a nominal dollar value (e.g., based on a percentage of an employee’s salary level). Since benefits are usually not subject to a cost of living adjustment, US plans emphasize nominal corporate and Treasury bonds in their liability hedging portfolios. The present value of plan’s liabilities, however, will change in response to changes in perceived or expected inflation to the extent that interest rates are affected.
As referenced in Table 1, the particular definition of the liability determines what discount rate the plan must use, and the choice of discount rate impacts the present value of the liability. Figure 2 displays the various discount rates that could be used and their impact on the present value of the funding rate liability. The value of the liability increases moving from the top of the table in Figure 2 to the bottom, as there is an inverse relationship between the discount rate and the present value of the liability. For example, there is an approximately $33 million difference in the value of the liability between the MAP-21 Discount Curve and IRS Full Yield Curve, as the MAP-21 legislation results in higher discount rates than the IRS Full Yield Curve. This example highlights the funding status and subsequent required contribution relief that defined-benefit plans have received since the introduction of the legislation.
Figure 2. The Value of Liabilities Is Different Under Each Discount Rate
As of December 31, 2013
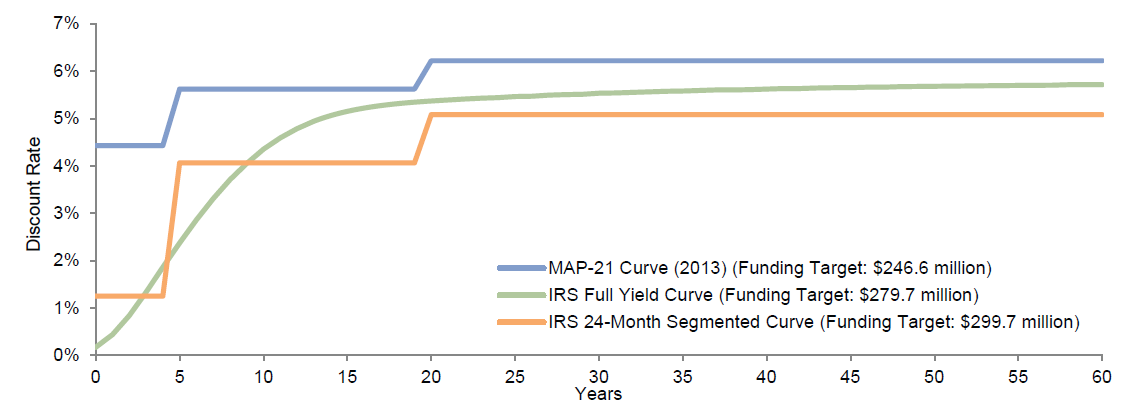
Sources: Internal Revenue Service and US Treasury.
Capital Allocation and Hedging Ratio
For most plans, the strategic asset allocation is a customized mix between the growth and liability hedging portfolios, taking into consideration the sponsor’s tolerance for surplus risk. Surplus risk refers to the expected volatility of funded status, measuring the extent to which fund assets and liabilities will deviate from each other (a theoretical portfolio with no surplus risk would be “immunized” as assets perfectly match liabilities). It can be used to measure the risk of failing to attain adequate long-term returns consistent with the plan’s expected return—inability to mitigate surplus risk means the sponsor will ultimately have to make up the difference and kick in higher contributions to keep the plan’s funding at a healthy level. Generally, open and soft closed plans, as well as hard frozen plans that are underfunded, will assume some level of surplus risk to generate excess return (above and beyond the liability’s return) to increase funded status and reduce future contributions.
Analysis is possible to quantify the size of surplus risk (or surplus volatility), but on a more simple and intuitive level, hedge ratios can be computed to assess how much the market value change for plan assets captures the change in pension liabilities. Liability values and related hedges are significantly driven by the level of interest rates, as well as changes in the credit spread of corporate bond yields in excess of US Treasuries. Sponsors can compute a rate hedge ratio that provides an estimate of how “protected” the plan would be given a move in interest rates (Figure 3).
Figure 3. Liabilities Hedge Ratio Formula
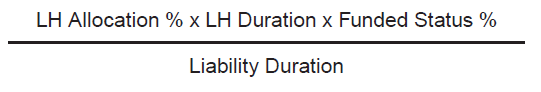
For example, assume a defined benefit plan with the following characteristics:
- Funded Status: 85%
- Liability Hedging Allocation: 50%
- Liability Hedge Duration: 5.5 years
- Liability Duration: 12 years
Despite a 50% allocation to fixed income, this hypothetical plan maintains an effective interest rate hedge ratio of 20%, suggesting the plan is hedged on less than a quarter of its rate exposure related to the liability. The rate hedge ratio is lower than the liability hedging allocation due to the plan being underfunded (not enough assets available to match the size of the liability) and the shorter duration of the assets relative to the liabilities.
This example reveals an inherent weakness of using “core” or “core plus” approaches as liability hedges. Though core bond benchmarks, such as the Barclays Aggregate, serve as an all-inclusive universe of investment-grade bonds, the Aggregate has a meaningful mismatch in duration compared to most defined benefit pension liabilities. Even larger allocations to an Aggregate-based portfolio will embed significant surplus risk—potentially more than the sponsor realizes. Lesser but still important considerations of using core bond benchmarks are their significant holdings in mortgage-backed and asset-backed securities, which are a poor hedge for a liability marked on the basis of corporate yields. Core bond benchmarks also introduce additional tracking error as they include securities with negative convexity.
Similar calculations can be made for credit spread metrics, as a credit hedge ratio estimates how “protected” the plan is from tightening (falling) credit spreads relative to the credit sensitivity of the liability. As an extreme example, a plan with a 100% allocation to duration-matched Treasuries would be effectively 100% hedged to general rate sensitivity, but the plan would have a 0% credit hedge position, given no exposure to credit spreads.
Duration of the Liability Hedge
Figure 4 ties the concepts of rate and credit hedging together and indicates the benchmark’s importance to the effectiveness of a liability hedge. The chart displays the cumulative performance of a sample liability stream (with duration of 13 years—approximating typical pension plan duration), the Barclays US Long-Term Credit Corporate Index, and the Barclays Aggregate Bond Index during a period of falling interest rates (January 2010 through December 2013). The Long Credit index does a significantly better job of keeping up with the growth in liabilities, as its duration and yields are closer to those of the liability.
Figure 4. Long Credit Bonds Can Keep Up With Liabilities Better Than Core Bonds
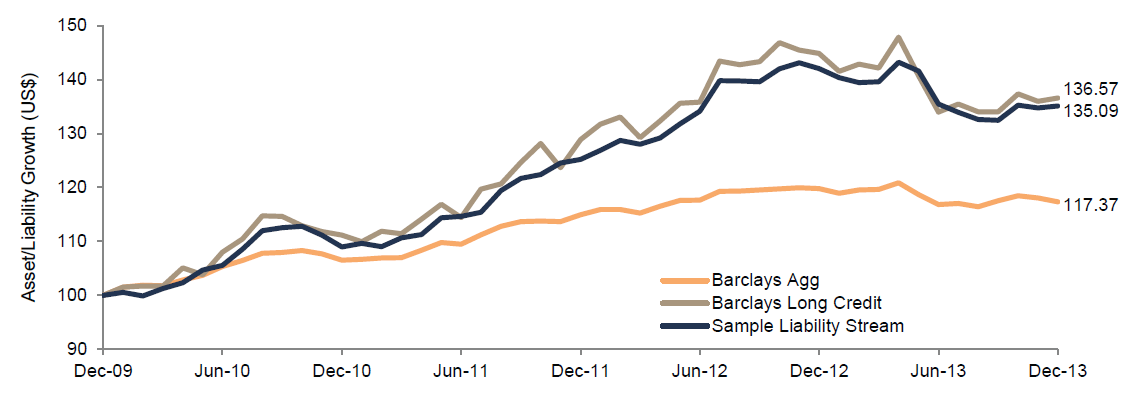
Sources: Barclays and Cambridge Associates LLC.
The Aggregate’s inability to hedge the liabilities can be very painful for pension plans. As shown in Figure 5, a plan with a 50/50 allocation (growth/liability hedge), where the liability hedge is the Aggregate, would have a funded status of 80% at the end of the simulation period. This contrasts with a terminal funded status of 87% for the portfolio whose liability hedge is invested in long duration bonds. Said another way, a pension portfolio with total assets of $1 billion whose liability hedge is invested in long duration bonds would end up with approximately $100 million more in funded status than the portfolio using the Aggregate during this period of falling interest rates.
Figure 5. Liability Hedge Portfolio Using Core Bonds Can Erode Funded Status in Periods of Steady or Falling Interest Rates
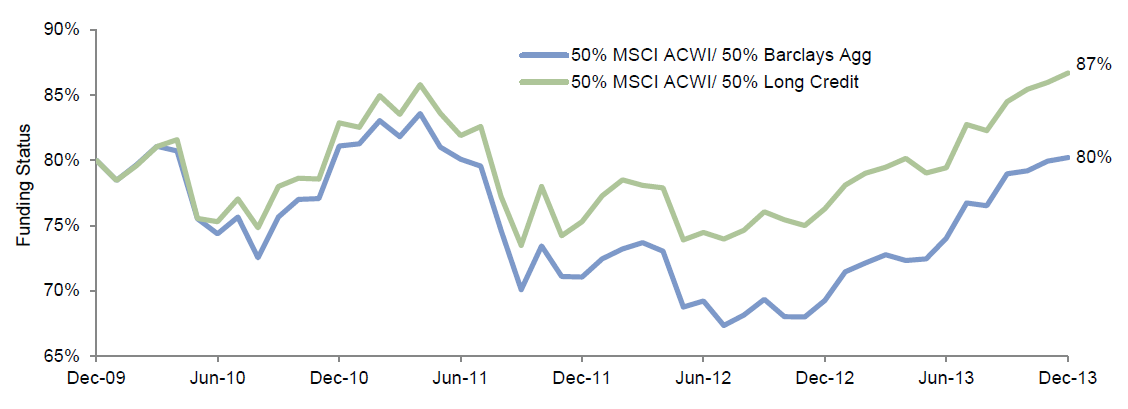
Sources: Barclays and MSCI Inc. MSCI data provided “as is” without any express or implied warranties.
Pitfalls of “Matching” the Liability
A plan’s liability present value calculation is subject to many complexities, and as a result, plans will encounter numerous implementation challenges and trade-offs. It is virtually impossible to perfectly mimic the behavior of a discounted liability stream through an investable bond portfolio. The assumption is a discrete set of annual cash flows discounted at a corporate bond rate could be perfectly “immunized,” but in reality, the achievement of complete liability replication is elusive. In this section, we discuss the most notable challenges—some of which can be controlled and mitigated, but several of which are not possible to eliminate. 1 Specifically, we note the following chief challenges in perfectly hedging a liability stream: curve matching, credit spread constraints, high-quality concentration, and downgrade decay. Because many of these challenges are unsolvable, we advise plans to devise the most effective liability hedge that mitigates these trade-offs and manage surplus risk to an acceptable level, rather than try to attain a false sense of precision at a greater cost.
Curve Matching
Interest rate duration, the sensitivity of a bond portfolio or liability to a change in interest rates, is a key consideration in a robust liability hedging approach. The vast majority of plan liability durations, though long, tend to be at levels that are technically investable (even in the high teens or low twenties, where Treasury STRIPS can be used). To provide an example, Figure 6 compares a liability cash flow stream with duration of 14 years, identical to the duration of the Barclays Long Government/Credit Index. If a parallel interest rate shift occurs (holding spreads constant), the liability and fixed income investments would be expected to generally move in tandem.
Figure 6. Distribution of Benefit Payments Creates Curve Risk
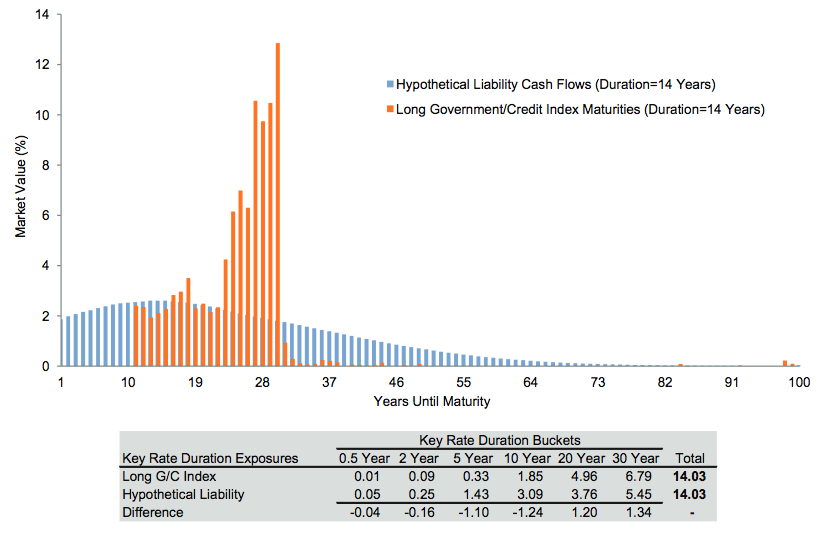
However, such duration positioning comes with a significant amount of curve risk. The liability exhibits the familiar “bell curve” shape spanning a number of decades, while the Long Government/Credit index (by design) is heavily clustered in the ten- to 30-year maturity space. As a result, this implementation results in a meaningful overweight to the longer end (20+ years part of the curve) and an underweight to the front end of the interest rate curve. Such positioning is therefore susceptible to the flattening, steepening, and kinking that can result in a term structure of rates over time. Depending on the behavior of the curve, the liability hedge could materially deviate from the liability as a result. It is possible to mitigate these curve exposures through some of the techniques we will discuss later (including derivatives), but it is imperative to understand the size and nature of the curve positions that may be assumed, particularly if the liability hedge is a meaningful part of the overall asset allocation.
Credit Spread Constraints
Whether using an accounting or funding target methodology, the pension liability is discounted using a corporate interest rate, which embeds both a risk-free (government) interest rate, as well as an additional yield related to credit risk associated with corporate bonds. This credit spread component creates at least four challenges for liability hedging purposes.
- Corporate bonds tend to be much less liquid and more expensive to transact than Treasury bonds, which makes customization more difficult. Such liquidity and cost constraints also create challenges in making needed adjustments over time as the portfolio and liability change.
- Few derivatives options to simulate corporate bond exposure are available (unlike swaps and futures, which can be readily available for government bond exposure), further limiting liability hedge customization. The most readily available corporate derivatives, credit default swaps, tend to trade in the five-year maturity (too short for most liability hedges) and also embed a fair amount of “basis risk” (differences between cash and synthetic valuation).
- Corporate spreads provide a “carry” of excess yield for the liability that may be difficult for the liability hedge to mimic. For example, if a plan relies on 30-year Treasury STRIPS to maintain needed duration exposure, the liability hedge return will lag the percentage change in liability each day that transpires by virtue of not earning the credit spread in that duration bucket.
- Liabilities based on corporate bonds possess sensitivity to movements in spreads referred to as “spread duration.” Especially in longer duration bonds, this exposure can become heightened. Again using the example of 30-year Treasury STRIPS, if credit spreads were to tighten (rally) substantially, the plan liability would increase by virtue of the lower spreads, but the plan’s liability hedge would miss out on the benefit, impairing the hedge’s effectiveness.
Similar to the challenges on managing curve exposures, the plan sponsor must arrive at the best solution that manages the problems of corporate exposure in the most effective manner possible. However, as we will discuss in the next section, a liability hedge should be constructed holistically with the characteristics of the growth portfolio in mind. Plans with higher levels of equity beta may be better served maintaining lower corporate exposure and higher government exposure, given the correlation of corporate spreads and equity risk.
High-Quality Concentration
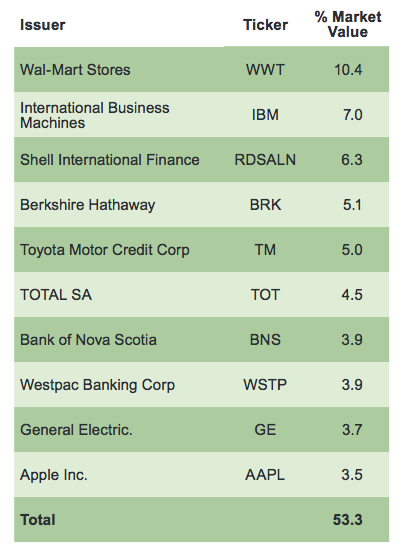
The liability’s corporate bond–based discount rate is generally derived from market yields on higher-quality corporates. Although this higher-quality focus would seem conservative on the surface, plans that elect to perfectly mimic this high-quality exposure may assume a substantial amount of issuer concentration risk in their corporate bond portfolio. Table 2 demonstrates the highly concentrated nature of the Barclays AA Corporate Bond Index, in particular. The top-ten issuers make up more than half of the index, with an allocation in excess of 10% for Wal-Mart alone. The level of concentration is generally inappropriate for a corporate bond portfolio even if it is intended to be a “perfect” liability hedge, and the lack of diversification also leaves a plan more vulnerable to downgrade risk.
Table 2. Top Ten Constituents of Barclays AA Corporate Index
As of December 31, 2013
Downgrade Decay
One of the most challenging aspects of managing a liability hedge against a cash flow–oriented liability benchmark is that the liability uses a very different methodology in being marked to “market.” On the liability side, the plan is obligated to pay discrete annual cash flows in the future, and as time transpires, there is little to no downward slippage in these cash flows, as any failure to pay would trigger default for the sponsor. With these cash flows relatively little changed over time (excluding the effect of service cost, demographic experience, and actuarial assumption changes), the sole mechanism of change in the liability present value is driven by applying a dynamic discount rate.
However, the asset side is not blessed with such a static cash flow structure—individual underlying bonds held by the plan may fall in value. Even worse, if an issuer is downgraded below the minimum quality permitted by index rules (or defaulted in a worst case scenario), the plan sponsor sustains losses, while the index eventually ejects the downgraded/defaulted bond(s) and re-prices the discount rate as if the index never held the bonds in the first place.
The recent downgrade of Verizon and Verizon Wireless illustrates this disconnect. Verizon and Verizon Wireless constituted about 3% of the Barclays A or Better Index until their recent downgrade. As indicated in Figure 7, after Verizon announced plans to issue debt and acquire the Verizon Wireless interests it did not already own from Vodafone, Verizon bonds widened substantially (widening spreads mean the yield of a bond rises and the price of the bond falls, all else equal) due to investor concerns. Ultimately, Verizon and Verizon Wireless bonds were downgraded from low A to BBB in September 2013.
Figure 7. The Impact of One Issuer on a Bond Index Can Be Significant
November 30, 2012 – September 30, 2013
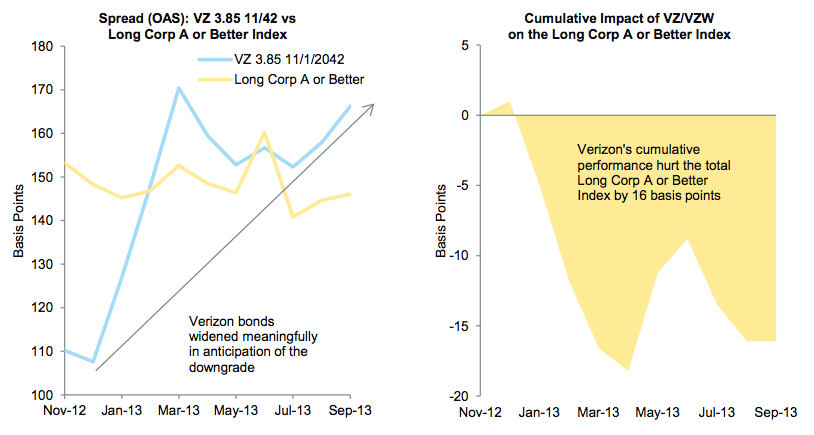
Source: Barclays.
From November 30, 2012 (when Verizon had issued its previous benchmark bonds) to September 30, 2013 (the effective date of Verizon’s removal from the A or Better Index), Verizon’s underperformance caused a drag of 16 bps on the total index. But more importantly, Verizon’s ultimate removal from the A or Better Index (a proxy for many liability valuations) caused the index yield to compress by about 2 bps. Thus, the liability proxy was not affected by Verizon’s lowered quality, but investors in the real-life index incurred all of Verizon’s underperformance.
Since the market usually recognizes issues before rating agencies, all downgrades tend to follow this same pattern—investors sustain losses up until the credit’s ejection from the index, but the liability discount rate ultimately kicks the credit out. When these effects are compounded over time across a wide variety of downgrades, the “drag” from this issue becomes extremely meaningful. Unfortunately, there is no counterbalance to this downgrade headwind—corporate bonds that get upgraded will usually have realized much of the upgrade’s benefit well before inclusion in the higher-quality index. In addition, a literal interpretation of a bond’s conformity with a high-quality restriction may force investors to sell newly downgraded bonds (such as Verizon) at one of the worst moments, when the credits often encounter their greatest selling pressure.
Construction of the liability hedge must account for this effect carefully. Account guidelines can be modified to handle downgrades of securities more practically. Plan sponsors may also be better rewarded by broadening the permissible credit quality of holdings (into securities rated BBB, for example) to mitigate the effect of downgrades, better diversify holdings across more issuers, and, ultimately, earn returns that can help offset the headwinds of liability management that have been described thus far. Although each liability hedging situation is unique, we generally advise plans to permit investment in all investment-grade corporate ratings, as allowing for BBB investments helps mitigate the downgrade slippage.
Liability Hedge Construction
The previous section touched on the constraints of being able to perfectly match a liability proxy calculated based on actuarial methods. We now address a key aspect of liability hedge portfolio construction. We believe plan sponsors should not construct a liability hedge in isolation, as the size and composition of both the growth portfolio and liability hedge will have important interaction effects upon each other. The end goal is to maximize portfolio return at a controlled level of risk. Thus, a liability hedge should not attempt to perfectly immunize a cash flow stream, but rather optimize duration, curve, and credit spread exposures within the broader context of the total plan’s risks related to both its assets and liability.
Equity Interaction Effect
Credit spreads are clearly a key driver of plan discount rates, but a plan should be cautious in assuming that heavy or exclusive use of credit-related securities is appropriate in all cases. Performances of credit spreads and equity markets are modestly correlated (Table 3). Typically, in strong equity markets, credit spreads tend to “tighten” and in weak equity markets, credit spreads tend to “widen.” The credit/equity alignment is intuitive, as the healthy economic/profit conditions that drive equity returns are also conducive to better performance among corporate bonds, as well as improved risk sentiment.
Table 3. Equities Are Modestly Correlated to Credit Spreads
As of December 31, 2013
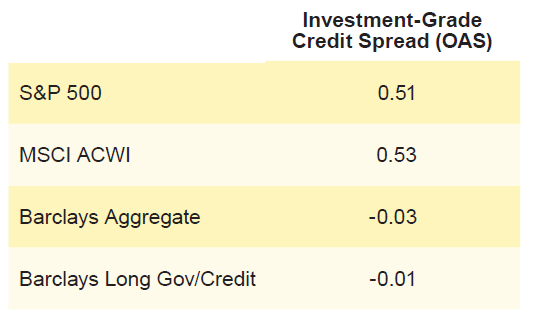
As a result of this relationship, plans must take into account the relative level of equity beta (market sensitivity) in their growth portfolio when determining the right mixture of corporate and Treasury bonds in their liability hedging portfolios.
Figure 8 demonstrates equity risk can have substantial implications for implementing a liability hedge, plotting the appropriate government/credit ratio against surplus volatility for a few sample portfolios. The “60 Growth /40 Liability Hedge” plan is better served, from a surplus volatility perspective, with higher government bond allocations. Conversely, the “0 Growth /100 Liability Hedge” (fully hedged) plan is helped by maximizing credit, as the portfolio is devoid of equity risk, which reduces surplus volatility by better mimicking the behavior of the liability on a much larger slice of the portfolio. If a plan maintains significant equity exposure, devising a complex customized credit solution that tries to imitate the liability may actually accentuate existing equity risks rather than help manage overall portfolio risk. For the “60 Low Beta Growth / 40 Liability Hedge” portfolio, greatly reducing equity beta (in this example, assumed to be 0.4) controls surplus volatility with a consistent amount across the government/credit spectrum. Such an allocation comes with a return trade-off. In most long-term periods, credit will typically outperform Treasuries (when adjusted for duration), given the excess credit spread earned over time.
Figure 8. With a Large Growth (Equity) Portfolio, Additional Exposure to Credit May Increase Risk.
Duration Matched Plan with ACWI Equity Exposure
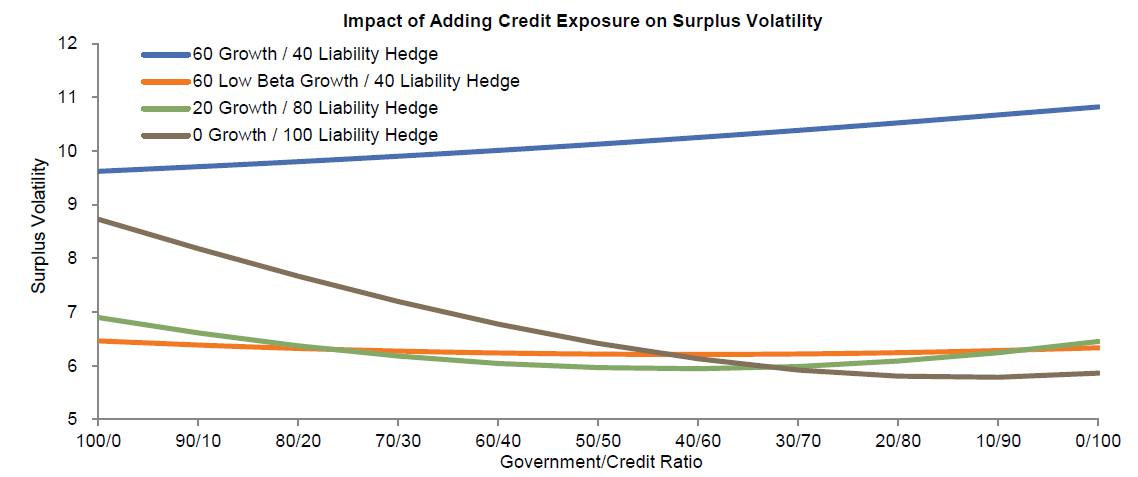
Sources: Barclays and MSCI Inc. MSCI data provided “as is” without any express or implied warranties.
Notes: Low beta growth portfolio assumes a 0.4 beta to the MSCI All Country World Index. Returns from October 2003 to October 2013.
Avoiding False Precision
How precise the liability hedge’s mechanics need to be depends on the size of a liability hedge allocation. In the most extreme example, a plan that hedges 10% or 20% of its liability will leave a fair amount of its rate exposure unhedged. In this case, assuming significant implementation complexity makes little sense as the impact of the unhedged surplus risk would dwarf efforts to fine-tune the hedge. Conversely, a plan that invests all of its assets in a liability hedge would have a very low tolerance for surplus volatility, raising the onus for liability hedge precision.
Most plans are likely somewhere between the two end points described above. In determining the appropriate definition and implementation of a liability hedge, plans should consider the trade-offs associated with:
- Customization. A plan that elects to become more precise with the curve, rate, and spread dynamics of its liability in terms of implementation will be taking a step that is far more complex. Management fees, oversight, and account structure should all be evaluated relative to the benefit of improving the precision of a liability hedge.
- Benchmarking Complexity. Selecting Barclays Long Government/Credit or other widely known indexes as the benchmark for the liability hedging portfolio can be an attractive option. It ensures a straightforward benchmark to measure program success. But it is also possible to follow a more customized approach to hedging the liabilities by constructing a bond portfolio comprising of STRIPS and derivatives (as we discuss in the next section).
- Permissible Quality. More “literal” interpretation of a liability benchmark could cause mandates to focus purely on high-quality corporates. Such a narrow scope entails the concentration and downgrade risks described earlier. Allowing for lower-quality (but still investment-grade) securities can help mitigate downgrade headwinds and, in the long run, provide enhanced returns and reasonable correlation to the liability benchmark.
- Permissible Securities. When considering the inclusion of securitized holdings, municipals, floating-rate paper, and high-yield bonds, such bonds are “out-of-index” securities when compared to a corporate-focused liability benchmark. However, active managers with skill may be capable of accentuating returns on the fixed income portfolio with these holdings. Potential return enhancement should be evaluated relative to the tracking error being assumed (i.e., on a risk/return basis).
- Portfolio Leverage. As we will discuss, fixed income derivatives can be very useful in managing specific rate and curve risks for a plan relative to its liability. But such exposures can involve the assumption of portfolio leverage, and adequate parameters should be crafted to ensure leverage is employed appropriately.
Liability Hedging Implementation Options
After incorporating all of the duration, curve, and credit nuances described to arrive at an optimal liability hedge, plans can implement the portfolio in a variety of ways. In this section, we review the key benefits and drawbacks of commonly used approaches. The implementation options provide differing degrees of liquidity, tracking error, and complexity—as each approach has its own pros and cons, the suitability of each approach is dependent on a plan’s specific circumstances.
Physical Fixed Income
“Physical” implementation refers to purchasing a portfolio of actual fixed income securities, with targeted duration either set in line with a benchmark or equal to a plan’s liability in a customization strategy. The composition of bonds in the physical portfolio would be calibrated based on the plan’s liability hedge characteristics. In most cases, defined benefit plans invest only in nominal fixed rate corporate and government securities in their liability hedging portfolios as plans are not usually subject to a cost-of-living-adjustment provision (COLA). For plans with such provisions it makes sense to hold assets (e.g., Treasury Inflation-Protected Securities, hard assets) that can offset the cost of rising liabilities in event of rising inflation.
An approach that emphasizes physical bonds has several advantages. The implementation is relatively straightforward, which mitigates execution risk for less well-resourced investment organizations. Performance of a simple physical portfolio is simple to measure, and the performance and portfolio characteristics can be easily compared to a reference benchmark. The physical approach can be undertaken in either a passive or active format, with the potential for value add via credit selection, curve posture, duration adjustment, opportunistic out-of-index positions, or other techniques.
Corporate bond investments are, practically speaking, only investable in the physical format, as no liquid and investable format exists to replicate corporate exposure other than credit default swaps, which introduce a significant basis risk and are not appropriately calibrated in terms of duration. Thus, plans that wish to maintain meaningful credit exposure will have to rely on physical corporate bond exposure significantly. An attempt to replicate duration synthetically in Treasury/swap markets (as we will discuss) will underperform the liability benchmark over time due to a lack of carry from the inherent credit spread.
A physical approach does have drawbacks. Depending on the nature of the liability hedge, a physical portfolio is not capital efficient because it traps a fair amount of plan assets in the role of hedging liabilities. This capital could have been put to work in other parts of the portfolio, where expectations for returns are higher. Thus, holding a large, physical hedge portfolio whose expected surplus return is theoretically zero could have a significant opportunity cost.
Physical portfolios are likely to present curve mismatch relative to a liability, even if significant effort is spent matching duration on a total portfolio basis. Furthermore, corporate bonds are less liquid, at times difficult to source for specific maturity profiles, and often embed a meaningful bid/ask spread in transactions costs.
Synthetic Fixed Income
The capital efficiency of derivatives offers unique benefits in managing exposures for the liability hedging portfolio, but derivatives also present unique risks and considerations (including treatment under FAS 157). Plans should ensure these risks and complexities are well articulated and managed at a policy level, and implementation of derivatives may very often need to reside with an external manager or provider. Below, we cover three key derivative types: Treasury futures, interest rate swaps, and swaptions.
Treasury Futures. Treasury futures are similar to futures on other assets (commodities, equities, etc.)—parties to a Treasury futures contract agree on the forward price of the referenced Treasury bond at a certain date in the future. If the spot price at the expiry of the contract is above the agreed-upon (forward) price, the party short the contract will pay the long party the difference, adjusted for the notional of the contract. If the spot price is below the forward, the long party pays the difference to the short party. The payout is therefore very similar to owning the Treasury security physically.
Pension investors can hedge their interest rate exposure by purchasing (“going long”) Treasury futures of appropriate maturities. Given the long duration nature of pension liabilities, plans typically hedge exposure by purchasing the ten- and 30-year Treasury futures (adjusted as needed for curve parameters). Treasury futures are very actively traded, and the market is very deep, making futures an attractive option for plans reluctant to take on significant liquidity risk and to pay a lot in transaction costs to construct their liability hedge. As exchange-listed derivatives with daily margin settlement, counterparty risk is eliminated as a consideration, and complexities tied to ISDAs or other over-the-counter (OTC) procedures are not applicable.
One key drawback of Treasury futures is the fact that initial and variation margin is required, though such amounts are still far more capital efficient than a physical bond portfolio. A plan must also maintain the proper operational resources to handle the funding and maintenance of margin, as well as understand duration sensitivity and risk introduced by Treasury futures positions. Similar to the other synthetic approaches, Treasury futures also fail to match the interest expense on a plan’s liability given no embedded corporate spread, which would lead to deteriorating funded status if it is not earned elsewhere in the portfolio, and a mismatch on credit spread duration as well.
Interest Rate Swaps. An interest rate swap is a contract whereby one party agrees to pay the other party a fixed amount in exchange for a floating amount periodically for a pre-determined amount of time. For instance, in a 30-year interest rate swap, party A agrees to pay party B a fixed amount (equal to a fixed rate times a notional amount determined in advance) in exchange for a floating amount (equal to a short-term rate, typically Libor plus a spread, times the same notional amount). The life of this hypothetical swap would span 30 years, and every quarter (or, depending on the terms of the contract, every month) during that time cash flows would be swapped between the counterparties (Figure 9).
Figure 9. Interest Rate Swap Example
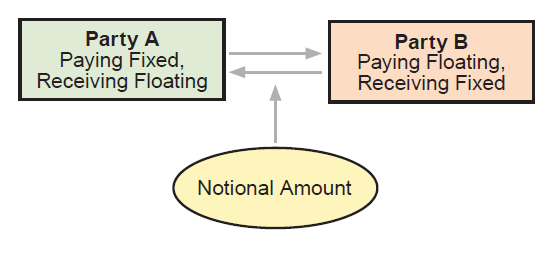
In this transaction, party B has effectively purchased a fixed-term bond with a fixed coupon rate (without the principal payment at the end) and has therefore assumed increased interest rate duration consistent with owning a bond. Thus, a pension investor may be inclined to assume a position similar to party B if it needs to add duration for a liability hedge, or may take a position similar to party A if it needs to lighten up duration in a specific instance.
A significant advantage of employing swaps for duration/curve management approach is the capital efficiency of the position. Since neither party in an interest rate swap is required to pay any upfront amounts, investors can increase the duration of their portfolios without having to tie up a significant amount of capital. Since neither party in an interest rate swap is required to pay any upfront amounts, investors can increase the duration of their portfolios without having to tie up a significant amount of capital. 2 Another positive is that there is a large and liquid market for swaps of varying maturities (e.g., five-year, ten-year, 30-year), and as such they can be cheap to trade, particularly when compared to physical corporate bonds. In particular, the market for ultra-long swaps (above 30 years) is more liquid and active than that for long-term bonds.
Plans must be aware of key considerations related to swaps. First, swap position sizing, sensitivity analysis, trading, and reporting can all be more complex than plain vanilla bond portfolios. Second, since interest rate swaps are OTC derivatives, investors must negotiate and sign ISDA agreements with counterparties and establish adequate back-office procedures to handle the swap implementation. For specific swap transactions, plan investors are required to sign trade confirmations and understand all terms of the contract. These processes (particularly the ISDA) can be lengthy and also involve a fair amount of legal and administrative expense.
We would be remiss not to mention the element of counterparty risk associated with swaps. To the extent a plan has earned profit on a swap, it is vulnerable (and is taking “credit risk”) with the financial institution that acts as the counterparty to the swaps. While this risk can be mitigated by proper collateral and netting agreements, it must be monitored very closely. Operationally, the plan must have the proper resources and procedures in place to handle the periodic payments. Particularly in volatile rate environments, ample cash or very liquid assets should be set aside to meet such payments. Also, most swaps contracts have strict collateral provisions and investors must be able to manage any potential collateral calls.
Since the underlying reference rates in swaps are heavily tied to US Treasury rates, a liability hedging portfolio constructed solely out of swaps has no exposure to credit spreads. This mismatch exposes the plan to tightening spreads, as liabilities grow in value while the hedging portfolio’s value remains unchanged. The lack of exposure to credit spreads also exposes the plan to credit slippage, as the hedging portfolio misses out on the extra yield earned by the liabilities. This effect causes the funded status to deteriorate since the hedging portfolio is not earning the liability’s annual interest expense.
Finally, swaps (like bonds) are discrete investments that inherently target one point of the maturity spectrum; thus, a plan would take on significant curve risk if it only purchased swap exposure to a single reference point. The curve mismatch risk can be mitigated by entering into multiple swaps with different underlying rates (i.e., five-year, ten-year, etc.), though this approach introduces additional operational complexity into the portfolio.
Swaptions. Swaptions are essentially options on interest rate swaps, allowing plans to obtain asymmetric payoff profiles in differing rate environments. Swaptions can either be a receiver swaption or payer swaption, with the word “receive” or “pay” referring to what happens with the fixed rate leg of the swaption. For instance, a receiver swaption gives the buyer the right to enter into an interest rate swap (whose terms have been specified at purchase of the swaption) as the receiver of the fixed rate at the expiry of the swaption. Alternatively, the buyer of a payer swaption has the right to enter into an interest rate swap as the payer of the fixed rate on the expiration date.
If structured properly, payer swaptions can provide a plan some protection from funded status deterioration if rates were to fall. Specifically, a plan could hedge against a decline in funded status due to falling rates by purchasing out-of-the-money receiver swaptions. Because the swaption is customizable, the plan can determine the rate at which it would like to have protection by setting the strike equal to that rate. If rates fall below the strike, the swaption becomes “in-the-money” and will have a positive payout to the buyer—in this case, the pension plan. Therefore, while the plan’s liability grows due to a drop in rates, its assets grow along with it since the swaption has a positive payout. There is no free lunch, of course, and the plan must pay a premium to obtain this beneficial optionality.
Another application of swaptions for a pension plan is the possibility of earning extra income on the portfolio by monetizing a decision to increase the plan’s hedge ratio if rates rise. For instance, suppose a plan currently has a 40% hedge ratio, and the plan intends to increase its hedge ratio to 50% if discount rates rise by 100 bps. The plan can express that objective today by selling a payer swaption, with the strike price set to the rate at which the plan wishes to increase the hedge ratio. The plan collects a premium in expressing this view, which creates an additional yield for the portfolio while still staying consistent with the strategic objectives of the plan. Effectively, the plan can take advantage of its structural need for duration by “selling” that action in advance and generate additional funds for the portfolio.
Though the plan could pocket the premium from selling a payer swaption, it can alternatively use the premium to fund purchases of receiver swaptions as previously discussed. For instance, suppose a plan sells payer swaptions, collecting premiums worth $1 million. The funds generated can be used to buy receiver swaptions that would give plans extra protection if interest rates fall. This strategy is known as a swaption collar. The collar’s pricing, payoff profile, and other characteristics will vary widely based on the level of rate volatility in the marketplace, as well as the level and shape of the spot and forward yield curves.
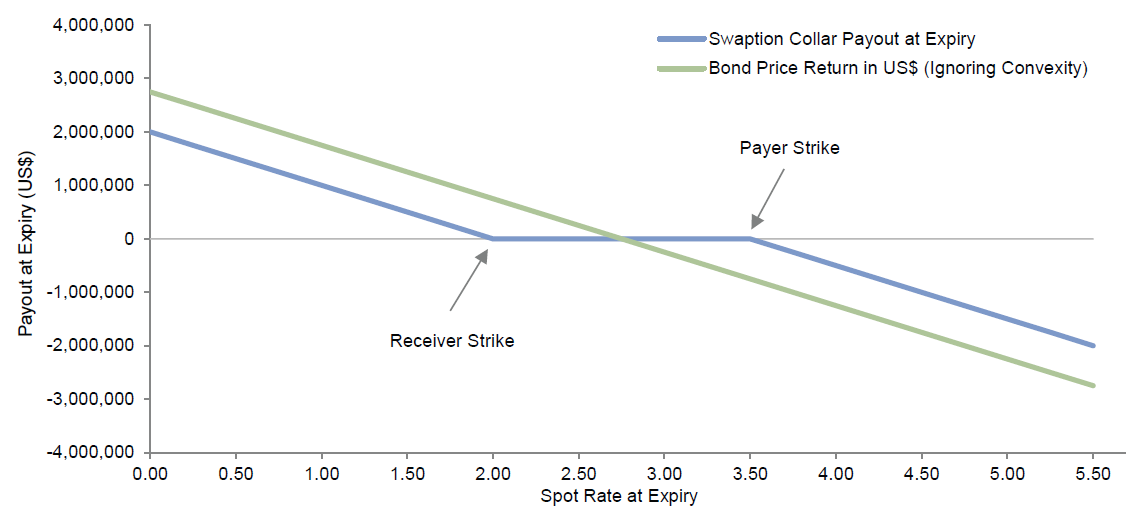
Similar to plain vanilla interest rate swaps, swaptions are capital efficient and allow plans to hedge their interest rate exposure without having to tie up a large amount of their capital in the liability hedging portfolio. To better illustrate this point, Figure 10 depicts the instantaneous change in value of a physical bond and a swaption collar payoff in response to changes in interest rates at expiry. Both instruments give investors exposure to interest rates with certain duration (in this case $7.2 million of exposure with duration of 14 years). For every 50 bp change in interest rates both the swaption’s final payout at expiry (once in the money) and bond’s market value change by $500,000. With the swaption collar, however, the entire principal amount does not have to be used up to gain exposure and the investor is free to use the funds elsewhere in the portfolio. This figure is only an estimate as it ignores changes in the swaption’s market value as it reaches expiry. Furthermore, the swaption collar has no payoff if interest rates at expiry fall in between the strikes (i.e., both legs are out of the money), whereas bonds would.
Figure 10. The Marginal Payoff of Swaptions Mirrors That of Bonds
Source: Cambridge Associates LLC.
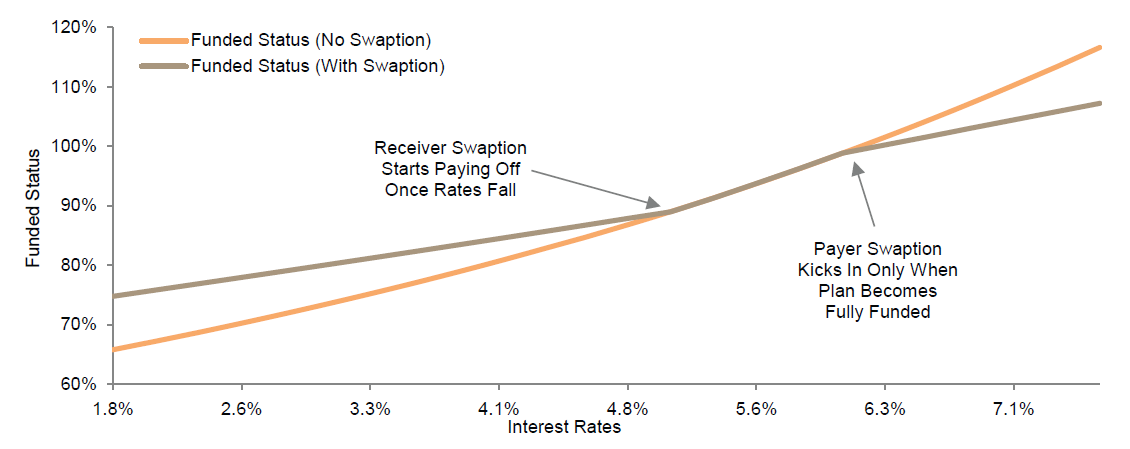
Swaptions can be particularly attractive to plans not too far from becoming fully funded. Such plans can put on swaption collars, with the payer leg struck at rates that result in funded status being at or above 100%. Since the plan’s sponsor cannot access excess assets (i.e., the portion of assets in excess of the present value of the liabilities), any upside gains from rising rates beyond fully funded can be sold and the proceeds can be used to increase protection against falling rates. Figure 11 shows the funded status of a plan with swaption collar structured so that the payer leg kicks only when funded status is anticipated to go above 100%. At that point or above, the sponsor’s utility (or use) for any further gains is limited, and any further potential upside gains in funded status can be used to fund downside protection.
Figure 11. Swaption Collar Can Increase Protection at Reduced Costs
Source: Cambridge Associates LLC
The swaption approach has similar drawbacks to interest rate swaps, including potential counterparty risk, collateral and cash flow management, ISDA negotiation, and trade confirmations. Swaptions also encounter the same caveats of swaps in terms of potential curve mismatch and a lack of corporate yield spread. One additional drawback is the high level of complexity of swaptions (even relative to swaps). Since swaptions combine elements of both options and interest rate swaps, plan investors may need time to become comfortable with their risks and benefits.
Alpha Considerations
Maintaining high levels of active risk (defined as an investment’s tracking error relative to its benchmark multiplied by the size of the investment) in bond portfolios is difficult given the lower volatility and higher diversification priorities of the asset class. While some bond managers may have a history of generating solid risk-adjusted returns (as measured by their Sharpe ratio), the absolute level of value add may be lower than the expected contribution provided by other asset classes, simply because bond managers tend to operate at a lower tracking error (ex ante deviation from the applicable benchmark).
The most potent way to ramp up tracking error for a bond manager involves taking aggressive duration or curve bets. Especially in a volatile rate environment, being long or short an index by a number of years is a surefire way to ramp up active risk. However, many bond managers tend to avoid making explicit duration bets, as the ability to forecast absolute changes in interest rates is difficult at best. 3 Typically, most bond managers prefer credit selection, sector allocation, opportunistic investments (i.e., emerging markets debt in an Aggregate mandate), lower-quality holdings (high-yield investments that may be limited as a percentage of the portfolio), and other techniques to beat a benchmark. The latter approach is more consistent with the purpose of a liability hedge portfolio as it avoids any unintended changes in the plan’s surplus risk.
The ability of bond managers to generate alpha is limited by the fact that other asset classes can operate at much higher levels of active risk. A plan with a large allocation to the liability hedging portion of the portfolio will consequently have a lower expected alpha at the total portfolio level.
Conclusion on Best Practices
We have discussed a number of nuances and complexities related to both the asset and liability side of employing a true “liability hedge.” Articulating a coherent liability framework and revisiting it frequently will serve plans well in maintaining an effective liability hedge exposure. Below, we summarize what we believe are the most important considerations when developing the liability hedge framework:
-
- Understand and Define the Liability. With a wide variety of cash flow and discount rate methodologies, the plan sponsor must ultimately identify which metric (accounting or funding?) is most relevant in the context of risk for the overall organization, and perform liability hedge analysis once that determination has been made.
- Quantify Acceptable Surplus Risk. Although “LDI” (liability-driven investing) has become a very hot topic in the pension community, we caution against any plan defaulting to a stance of minimizing surplus volatility at all costs. Organizational and plan-specific circumstances will influence the setting of risk objectives, but surplus risk and contribution risk should be explicitly defined when calibrating the growth and liability hedge components of the asset allocation.
- Emphasize Capital Efficiency. Liability hedging assets, particularly in the current environment, provide lower returns to a plan, and efforts to make the allocation more capital efficient can be extremely helpful. In almost all cases, shorter duration mandates like the Barclays US Aggregate are poor benchmarks for a liability hedge. Longer duration mandates can attain higher hedge ratios with equivalent capital and can better match the yield of the liability benchmark.
- Avoid Over-precision. Perfectly replicating a liability benchmark is extremely difficult. We recommend employing strategies that can manage the lion’s share of risks related to duration, curve, and credit spread, but avoid assuming additional complexity or implementation cost to attain only marginal benefits. Also, do not let an inappropriate focus on high-quality corporate indexes result in poorly diversified credit portfolios, and be willing to allow BBB corporates as a way to mitigate slippage from downgrades and other liability benchmark imperfections.
- Monitor the Interaction of Credit and Equities. Credit exposure can be correlated with equity exposure, and the formulation of a liability hedge should be adjusted continuously to ensure optimized risk and return when considering these two interrelated asset exposures.
- Use a Complete Toolkit. Fixed income derivatives provide many advantages, particularly in terms of their ability to fine tune exposures with relatively little capital, as well as their high degree of liquidity. But the complexity of derivatives should be taken into account. Opportunities to generate alpha should be considered carefully when investments become heavier in a liability hedge allocation, but more complex and capital-efficient structures may allow for alpha sources to be allocated outside the realm of fixed income.
Footnotes
- In this section, we focus on liability precision challenges related to interest rates and credit spreads, but we note additional challenges exist such as those generated by changes in mortality tables, future demographics gains and losses, actuarial changes, etc.
- As the swap position valuation moves based on the passage of time and change in interest rates, the position may require mark-to-market infusions.
- For a liability hedge portfolio, aggressive active bets in duration would be particularly problematic, as from a portfolio construction standpoint the manager’s duration posture could impair the efficacy of the pension’s liability hedge, and relatedly, overall pension risk.
Ming Yan - Ming Yan is a Managing Director at Cambridge Associates, a global investment firm.
About Cambridge Associates
Cambridge Associates is a global investment firm with 50+ years of institutional investing experience. The firm aims to help pension plans, endowments & foundations, healthcare systems, and private clients achieve their investment goals and maximize their impact on the world. Cambridge Associates delivers a range of services, including outsourced CIO, non-discretionary portfolio management, staff extension and alternative asset class mandates. Contact us today.