Global ex US PE/VC Benchmark Commentary: Calendar Year 2020

In 2020, the Cambridge Associates LLC Developed Markets (ex US) Private Equity 1 and Venture Capital (PE/VC) Index® returned 33.1% in USD terms. The index suffered in first quarter during the onset of the COVID-19 pandemic but recovered quickly and ended the year with the fourth-highest quarterly return since the inception of the benchmark. Because the index’s return is measured in US dollars, the currency’s value vis-à-vis the euro impacts its performance. The US dollar lost significant value against the euro in second half 2020, which strengthened performance measured in USD terms (Figure 1); for the year, the index’s return in euros was 22.0%. The Cambridge Associates LLC Emerging Markets Private Equity and Venture Capital Index® earned 25.6% for the year, elevated by its second-best quarterly return ever in the fourth quarter. The developed markets PE/VC index has handily outperformed its public market counterparts across time based on modified public market equivalent (mPME) returns. The same is true for the emerging markets PE/VC index, although its mPMEs earned better returns over the last six months. Cambridge Associates’ mPME calculation is a private-to-public comparison that seeks to replicate private investment performance under public market conditions.
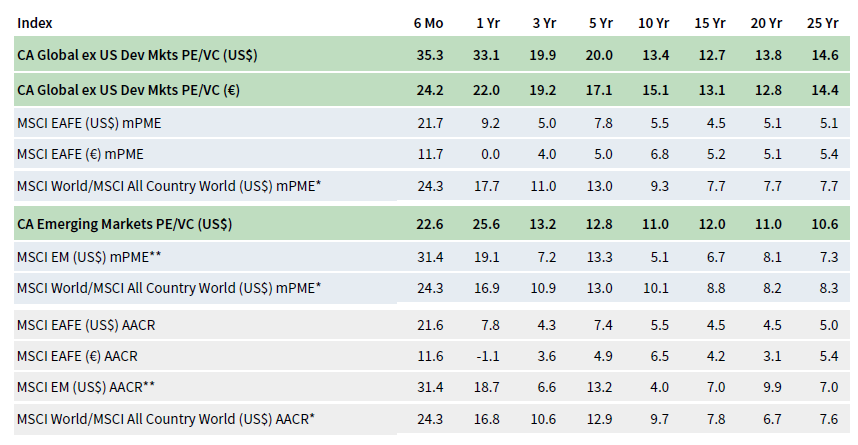
FIGURE 1 GLOBAL EX US PRIVATE EQUITY AND VENTURE CAPITAL INDEX RETURNS
Periods Ended December 31, 2020 • Percent (%)
* MSCI All Country World Constructed Index: Data from 1/1/1986 to 12/31/1987 represented by MSCI World Index gross total return. Data from 1/1/1988 to present
represented by MSCI ACWI gross total return.
** MSCI EM Constructed Index: Data from 1/1/1986 to 12/31/1987 represented by GFD Emerging Markets price return. Data from 1/1/1988 to present represented by MSCI
Emerging Markets total return gross.
Sources: Cambridge Associates LLC, Global Financial Data, Inc., MSCI Inc., and Thomson Reuters Datastream. MSCI data provided “as is” without any express or
implied warranties.
Calendar Year 2020 Highlights
- Developed markets (ex US) PE/VC had one of its strongest years ever in 2020, which further increased the index’s dominance over the comparable public benchmark (MSCI EAFE Index) in all time periods listed in Figure 1. The emerging markets benchmark outperformed its public market peer (the MSCI Emerging Markets Index) in the last year and regained its lead as the better-performing index across almost every time period.
- As of December 31, 2020, public companies accounted for a much larger portion of the emerging markets index than of the developed one (more than 28% for emerging and just under 5% for developed).
- In 2020, performance of information technology (IT) and consumer discretionary was head-and-shoulders above the other large sectors, although all earned double-digit returns for the year within the developed markets index. In the emerging markets PE/VC benchmark, IT, healthcare, and consumer discretionary returned more than 45%, while financials was the only sector that didn’t break 10% for the year.
Developed Markets (ex US) PE/VC Performance Insights
After a steep sell-off in the beginning of the year as the COVID-19 pandemic shut down large parts of the global economy, public equities rebounded and finished 2020 with positive returns. The economic recovery varied by region depending on the spread of the virus, national fiscal stimulus spending, and government policy for business re-openings. The developed markets index (MSCI EAFE Index) underperformed emerging markets (MSCI Emerging Markets Index) driven by lower returns from IT and consumer discretionary companies. The developed markets PE/VC index had a stellar year in 2020, earning 33.1% and representing the highest calendar year return since 2006. At year-end, 14 vintage years (2006–19) made up all the index’s value; all but the “oldest” (2006 and 2007) returned more than 20% for the year.
According to Dealogic, 14 European PE–backed companies went public in 2020 either through a traditional IPO or a SPAC (special purpose acquisition company). Combined, the public deals exceeded $6.7 billion, with two IPOs (THG Holdings and Nordnet) accounting for more than half the value. Six of the companies were IT, and the rest occurred in finance, energy, industrials, and consumer sectors. Notably, two of the public offerings coded as finance are SPACs currently seeking a target and could acquire a company in a different sector. There were 768 PE-backed M&A transactions in 2020, representing a relatively active year despite the global pandemic. Within the sample, 224 (or about 30%) of the deals had publicly disclosed valuation data and those averaged $766 billion per transaction. Unsurprisingly, the lowest number of M&As occurred in second quarter during the initial COVID-19 lockdowns.
Vintage Years
The number of meaningfully sized vintage years (those that represented at least 5% of the index’s value) at the end of 2020 rose to seven (from five at the end of 2019); combined, the large vintages (2012–18) accounted for almost 83% of the benchmark’s value (Figure 2). Vintage years 2016–18 each grew net asset value (NAV) by more than $13 billion during 2020, and now make up more than a third of the index; 2016 alone accounts for about 20%, which is a higher level of concentration by vintage year than seen in the other indexes. Outside of the largest vintage years in Figure 2, two others (2010–11) each represent close to 4% of the index, although these percentages are at least half of almost all the meaningfully sized vintages.

FIGURE 2 DEVELOPED MARKETS EX US PE/VC INDEX VINTAGE YEAR RETURNS:
NET FUND–LEVEL PERFORMANCE
As of December 31, 2020 • USD Terms • Percent (%)
Source: Cambridge Associates LLC.
Calendar year returns for the seven key vintage years were very strong, ranging from 21.0% (2013) to 67.1% (2018); notably, vintage years 2015 and 2017 also did well, earning 65.2% and 40.8%, respectively. Write-ups in IT and healthcare were key contributors in all three top-returning vintages, but consumer discretionary and communication services also helped drive returns for the 2015 and 2017 vintages, respectively.
LP Cash Flows
During 2020, despite the global pandemic and a short-term freeze in investment activity, limited partner (LP) contributions still managed to reach $41.5 billion, the second-highest annual amount since 2008. Distributions, however, dropped significantly from the previous year, and ended with the lowest annual amount since 2012. While annual contributions were split roughly equally from one half to the other, distributions were significantly higher in the second half ($24.3 billion) than they were in the first ($16.6 billion). Distributions have outpaced contributions since the beginning of 2011 (Figure 3), but due to the pandemic, and as predicted, the cycle turned in 2020, albeit just barely.
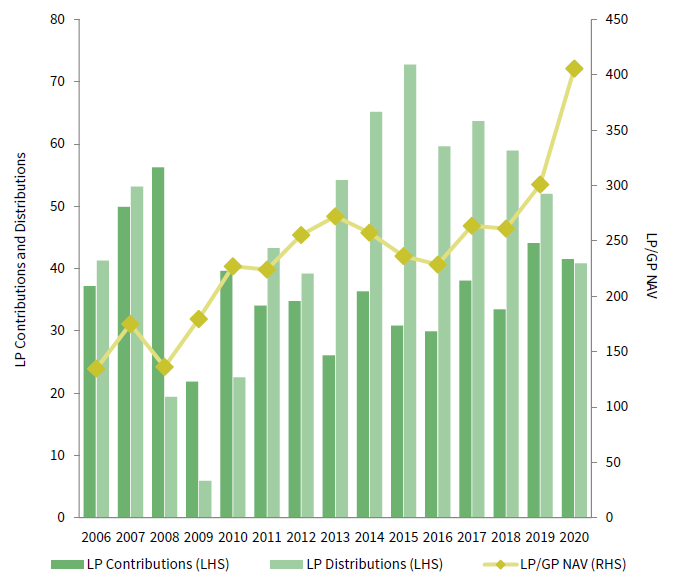
FIGURE 3 GLOBAL EX US DEVELOPED MARKETS PE/VC CONTRIBUTIONS,
DISTRIBUTIONS, AND NAV
Calendar Years 2006–20 • USD Billions
Source: Cambridge Associates LLC.
Capital calls were led by three vintage years (2016–18), each of which called at least $10 billion; combined they represented more than 75% of the total LP contributions during 2020. Distributions were less concentrated, as ten vintage years returned more than $1 billion. Notably, funds raised in 2012 distributed almost $12 billion (29% of total), and the older vintages (2006–07) together returned close to $7 billion.
Sectors
Figure 4 shows the GICS® sector breakdown of the Developed Markets (ex US) PE/VC Index and a public market counterpart, the MSCI EAFE Index. Compared to the public index, private markets had significant overweights in healthcare, IT, and consumer discretionary (5.5%, 10.7%, and 8.9%, respectively). The higher exposures to these sectors might explain the PE/VC index’s outperformance in recent time horizons. Calendar year 2020 was mostly defined by a COVID-19 economy, one that relied heavily on tech enablement and accelerated advancement in biotech and life sciences. Figure 4 also compares the sector breakdown of the private markets at the end of 2010 and 2020 to illustrate the reallocation of capital over the past decade. Unsurprisingly, most of the money was transferred into the same three sectors (healthcare, IT, consumer discretionary), while there was a 6.9% reduction in exposure to industrials.
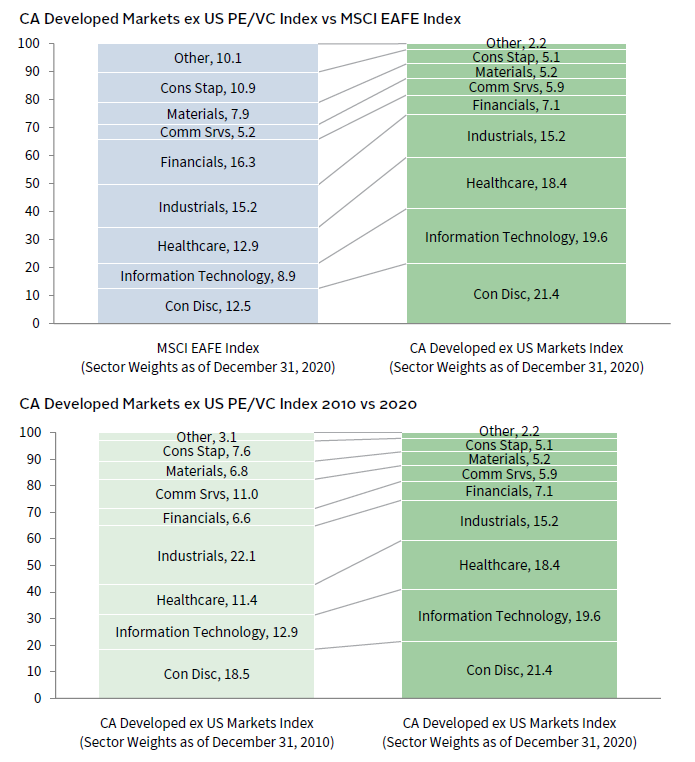
FIGURE 4 GICS® SECTOR COMPARISONS
Percent (%)
Sources: Cambridge Associates LLC, FactSet Research Systems, and MSCI Inc. MSCI data provided “as is” without any express or
implied warranties.
At the end of 2020, there were eight meaningfully sized sectors, and all but two returned more than 20% for the year in USD terms (Figure 5). IT, consumer discretionary, and healthcare were well above the rest, earning 48.8%, 47.4%, and 34.5%, respectively. Across the board, second half returns were much stronger than those of the first half, when valuations were written down sharply to reflect the impact of COVID-19 in first quarter 2020. That said, IT and healthcare proved the most resilient as both were the only sectors to eke out positive returns in the first six months of the year. The US dollar lost value against the euro in second half 2020, causing weaker euro-denominated performance.
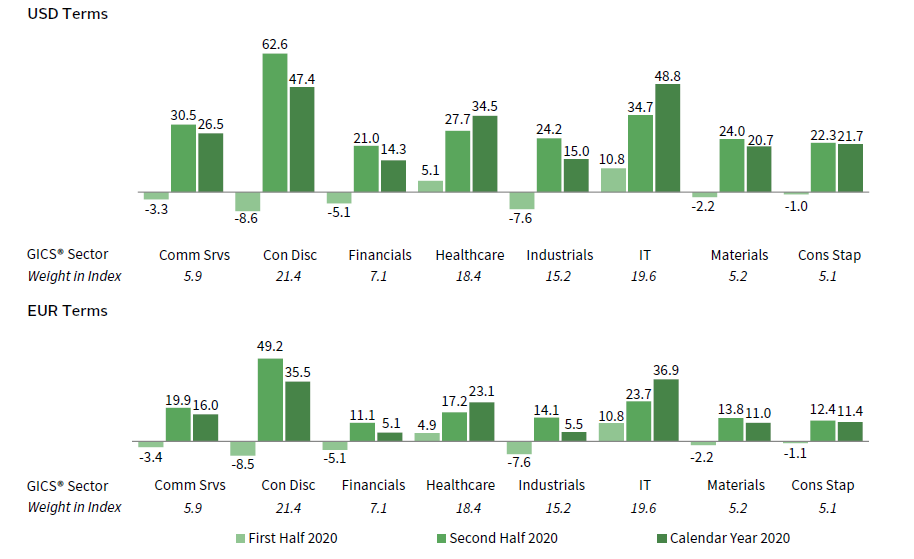
FIGURE 5 DEVELOPED MARKETS EX US PE/VC INDEX SECTOR RETURNS:
GROSS COMPANY–LEVEL PERFORMANCE
As of December 31, 2020 • Percent (%)
Source: Cambridge Associates LLC.
IT’s strong performance was spread widely across vintage years, with returns averaging more than 50% for vintages 2007 through 2019. Gains in consumer discretionary were more concentrated; almost 80% of the net appreciation change for the year was from vintages 2010, 2013, 2015–16. Vintage year returns in healthcare were slightly lower but more consistent than IT and consumer discretionary, as the vintage years with the largest allocations to the sector (2012–13, 2015–17) all earned between 31% and 40% for the 2020 calendar year.
The index’s four largest sectors—consumer discretionary, IT, healthcare, and industrials (in rank order)—represented 75% of its value and returned 33.3% on a gross USD-weighted basis and 25.3% on a euro-weighted basis. Almost 79% of the capital invested during 2020 was in IT, healthcare, consumer discretionary, and industrials (from largest to smallest), although IT and consumer discretionary each had more than $10 billion in realizations, representing more than 50% of all capital realized. Since the inception of the index, managers invested about 67% in these four sectors. When compared with the long-term norms, the higher percentage in 2020 reflects the increased investment in healthcare and IT, which more than offset a decrease in consumer discretionary and industrials.
Countries
In 2020, there were seven meaningfully sized countries in the index, and all earned double-digit returns in USD terms (Figure 6). Given the weakening of the dollar in the second half of the year, returns in euros were lower for every country. Performance for UK companies was better when measured in pound sterling (18.9% in GBP compared to 12.7% in euro), although returns for the year still finished much lower when matched against the US dollar. Investments made in US 2 companies performed the best over the full year and accounted for the largest amount of the index’s value (17.3%). Sweden and the Netherlands were the second- and third-best performers, returning 40.5% and 31.7%, respectively. Notably, the United Kingdom was the only country to suffer a negative return in the first half of the year (-10.3%), while all others proved more resilient, potentially reflecting the regional impact of the pandemic. Throughout the year, the pandemic’s impact varied greatly by region as outbreaks surged locally, and restrictions to life and the economy, access to testing and vaccines, and government stimulus differed between countries.

FIGURE 6 DEVELOPED MARKETS EX US PE/VC INDEX COUNTRY RETURNS:
GROSS COMPANY–LEVEL PERFORMANCE
As of December 31, 2020 • Percent (%)
Source: Cambridge Associates LLC.
The 2010 vintage year accounted for more than 30% of the write-ups for US companies, although market value increases were relatively widespread. The strong performance for Swedish and Dutch businesses were elevated by the 2015–16 and 2016–17 vintages, respectively, with each set of vintage years accounting for about half of their country’s gains. In the United Kingdom, losses in the first half of the year were widespread across vintage years, with the most net depreciation coming from 2013 and 2016. For the year, the gross USD-weighted return for the three largest countries—Germany, the United Kingdom, and the United States—was 31.5%.
European companies attracted 77% of the capital invested during the year, led by those in the United Kingdom; an additional 16% of the invested capital was allocated to US-based businesses. Historically, Europe and the United States garnered 90%, with the difference being attributed to the higher than normal investment in the United States.
Emerging Markets PE/VC Performance Insights
Unlike the private asset classes, in the public markets, the emerging markets index (MSCI Emerging Markets Index) outperformed the developed markets (MSCI EAFE Index) by more than double as public equities continued their strong performance from 2019. Companies in many sectors earned double-digit returns, led by consumer staples and communication services. With a 25.6% annual return, the emerging markets PE/VC benchmark had its strongest year since 2010, performing more than twice as well as it did in 2019. At the end of 2020, vintage years from 2011 onward made up approximately 80% of the index’s value and annual returns among those vintages averaged more than 30%.
Vintage Years
Eight vintage years were meaningfully sized in 2020 and collectively they accounted for 80% of the total sample (Figure 7). All produced positive returns for the year, ranging from 11.0% (2011) to 50.8% (2014). The average pooled return of the eight vintages (2011–18) was 30.9%, an 18.1% increase from the average return of the meaningful years of the emerging markets index last year. The strong performance by 2014 vintage funds was driven in large part by write-ups in the consumer discretionary sector, and to a lesser extent, IT and healthcare. Across sectors, funds formed in the worst-performing vintage, 2011, had mixed results; IT, healthcare, and communication services saw write-ups, while consumer discretionary saw a meaningful decrease in valuations. The only other meaningfully sized vintage that experienced a write-down in the consumer discretionary sector was 2013.
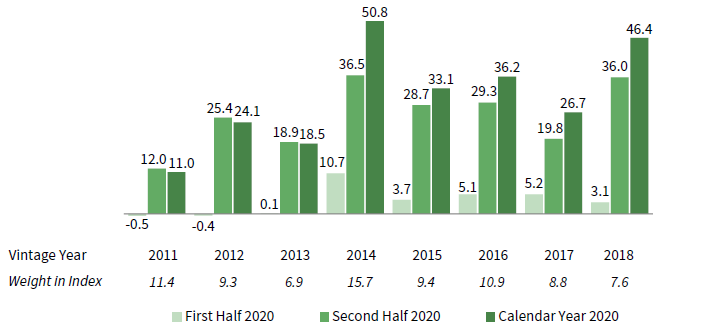
FIGURE 7 EMERGING MARKETS PE/VC INDEX VINTAGE YEAR RETURNS:
NET FUND–LEVEL PERFORMANCE
As of December 31, 2020 • USD Terms • Percent (%)
Source: Cambridge Associates LLC.
LP Cash Flows
Emerging markets PE/VC funds called $22.7 billion from investors during 2020, which represented a 6.1% decrease from the previous year (Figure 8). Despite the reduction in contributions, the year still ranks as the fourth highest for dollars called since the inception of the index (behind 2017–19) yet remains nearly $5 billion lower than the peak in 2018. On the other hand, distributions increased 7.4% year-over-year as managers returned $25.7 billion in capital to investors, making 2020 the second-largest year ever (2017 was the highest). Compared to the managers in the developed markets index, emerging markets funds have seen far fewer distributions but a more consistent increase in PE/VC investment activity year-over-year. While the former might be explained by an overweight in VC, the latter more convincingly reflects a growing appetite for these regions.
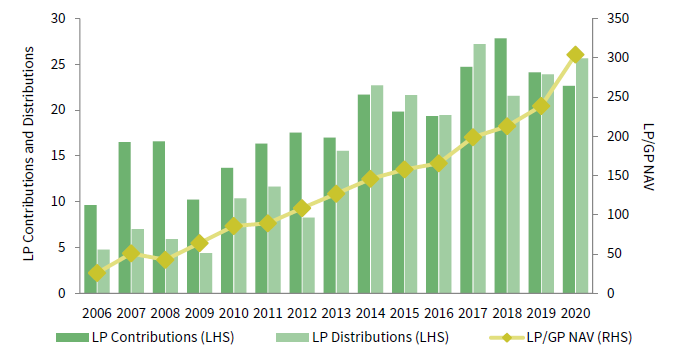
FIGURE 8 GLOBAL EX US EMERGING MARKETS PE/VC CONTRIBUTIONS,
DISTRIBUTIONS, AND NAV
Calendar Years 2006–20 • USD Billions
Source: Cambridge Associates LLC.
Funds raised in 2014–19 were responsible for most of the capital called in 2020, amounting to $20.3 billion and representing 89.7% of the total. The largest three vintages were 2016–19, which called more than $2 billion each; 2017–18 led the pack with calls totaling more than $4 billion each. LP contributions in 2020 were slightly less concentrated among vintage years, with six that called capital north of $1 billion, compared with five in 2019.
Notably, funds in eight vintages distributed more than $2 billion, ranging from 2007–15, indicating the older vintages were able to sell some of their long-held investments. The trend of funds older than ten years distributing significant amounts of capital is a continuation from prior years. Further illustrating this point, funds raised in 2007 and 2011 distributed nearly 24% of the total capital returned to investors during the year, with 2014 vintage funds accounting for another 12%.
Sectors
Figure 9 shows the GICS® sector breakdown of the Emerging Markets PE/VC Index and a public market counterpart, the MSCI Emerging Markets Index. The breakdown provides context when comparing the performance of the two indexes. The chart highlights the relative overweights in the PE/VC index, like healthcare and consumer discretionary, and the underweights in financials and communication services. Figure 9 also includes the PE/VC sector weightings from December 2010 to detail sector movement over the last decade. In the developed markets indexes (US and ex US), weights in IT investments have increased significantly over the last ten years. Over that same time period, the emerging markets index has become somewhat more concentrated, with increased exposures to the consumer discretionary, healthcare, and IT sectors and decreased exposures to the communication services and consumer staples sectors. At the end of 2010, the largest three sectors in the index (consumer discretionary, consumer staples, and industrials, in rank order) made up slightly more than 41% of the total market value; in 2020, that number increased to about 62%. Consumer discretionary was still the largest sector in the index in 2020; however, IT and healthcare edged out financials to take the numbers two and three spots, respectively. Having grown to comprise 38% of the index from less than 20% in 2010, these two sectors saw the most dramatic change from their 2010 values.
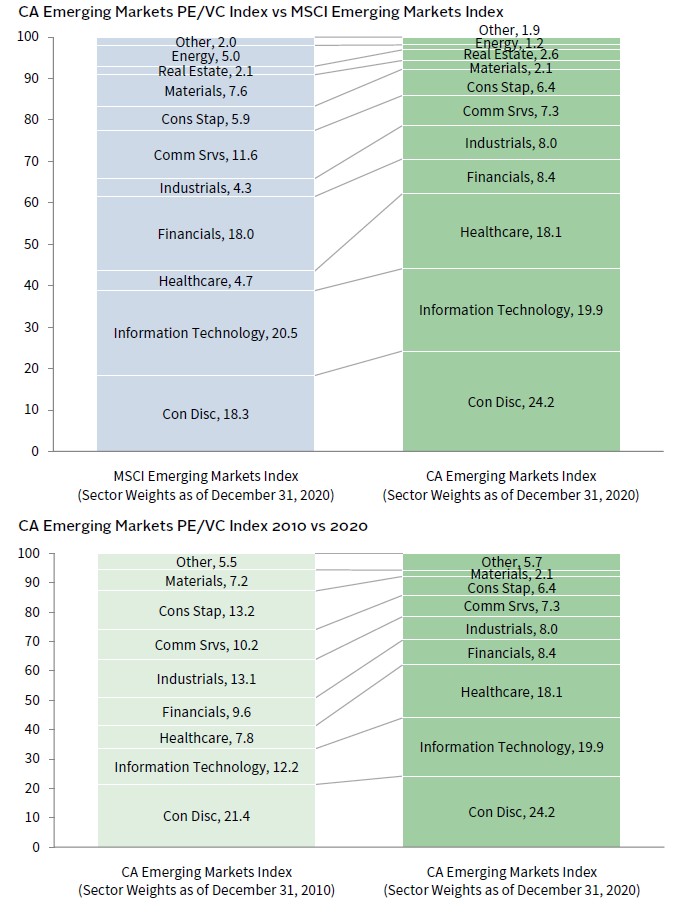
FIGURE 9 GICS® SECTOR COMPARISONS
Percent (%)
Sources: Cambridge Associates LLC, FactSet Research Systems, and MSCI Inc. MSCI data provided “as is” without any express or
implied warranties.
All seven of the meaningfully sized sectors posted positive returns for the year; all except financials saw returns in the double digits (Figure 10). Returns across the key sectors ranged from 8.9% (financials) to 48.5% (IT), performance that compares favorably with 2019, when sector returns were between 9.0% (industrials) and 25.4% (consumer staples). Following its modest 13.2% return in 2019, IT outperformed all other meaningfully sized sectors in 2020, returning 48.5% and edging out the next best sectors, healthcare and consumer discretionary, which returned 45.8% and 45.1%, respectively. Write-ups in IT were fairly widespread, with 80% attributed to funds formed in 2007, 2011, and 2014–16. On a gross USD-weighted basis, the three largest sectors by market value—consumer discretionary, IT, and healthcare—returned 46.4% during the year. During the same period, the remaining four meaningfully weighted sectors returned 17.2%.
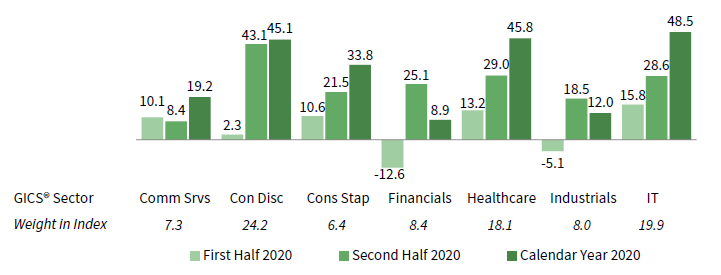
FIGURE 10 EMERGING MARKETS PE/VC INDEX SECTOR RETURNS:
GROSS COMPANY–LEVEL PERFORMANCE
As of December 31, 2020 • USD Terms • Percent (%)
Source: Cambridge Associates LLC.
The investment pace in 2020 was slower than that of the previous year (a decrease of about 14%). Companies across six sectors (in rank order: healthcare, IT, consumer discretionary, communication services, industrials, and financials) garnered 82% of the capital invested, with healthcare and IT alone attracting 44% of all capital. Over the long term, managers in the emerging markets index have allocated 78% of their capital to these six sectors, with 33% going to healthcare and consumer discretionary. Healthcare attracted 28% of the capital invested during the year, 15% more than its long-term norm of 13%; this is the biggest deviation above the long-term trend of any sector listed in 2020. On the flip side, consumer discretionary received 12% of the capital invested during the year. At 8% less than its long-term trend, this is the biggest deviation below the norm of any sector.
Countries
Highlighting the index’s geographic concentration, China remains, by far, the largest country component of the index (Figure 11). Notably, the index has become more concentrated during the last year, with China constituting almost 7% more of the index at the end of 2020 than at the end of 2019 due to a combination of higher than average invested capital and robust performance in both the first and second halves of the year. India and South Korea continue to be meaningfully sized, and as of the end of 2020, the United States constituted 5.9% of the index. 3 Three other countries—Hong Kong, Singapore, and Japan (from low to high)—represented between 2.8% and 4.9% of the index. Performance for the meaningfully sized geographies was strong in 2020, with all but India posting double-digit performance. Returns ranged from 7.3% (India) to 53.1% (China). For companies in India, 2007, 2010, and 2016–18 vintage funds accounted for the lion’s share of the write-ups during the year. For companies based in China, write-ups were widespread, with funds in eight vintage years (2007, 2011, 2013–18) experiencing write-ups of over $2.4 billion. However, returns were particularly high for 2014 vintage funds, which accounted for nearly 40% of all write-ups in Chinese companies; this was driven by significant write-ups in companies that experienced IPOs in recent years. With outsized performance across the board, the calendar year gross-weighted return for the four countries was 41.2%, nearly 2.5 times the return for 2019.
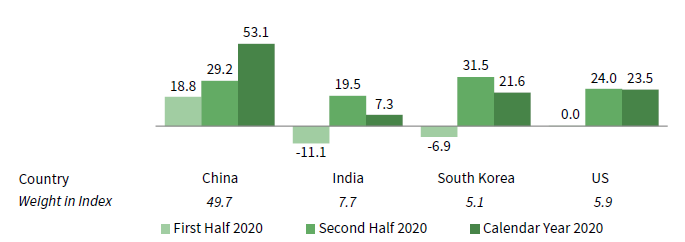
FIGURE 11 EMERGING MARKETS PE/VC INDEX COUNTRY RETURNS:
GROSS COMPANY–LEVEL PERFORMANCE
As of December 31, 2020 • USD Terms • Percent (%)
Source: Cambridge Associates LLC.
For the year, businesses in China, India, South Korea, the United States, and Singapore (in rank order) each amassed more than $1 billion of invested capital and, together, accounted for almost 80% of the capital deployed. Over the long term, these same countries garnered more than 58% of invested capital, with increases in capital to companies based in all five countries making up for the difference. China-based companies garnered 43% of invested capital during the year, above the long-term average of 33%, and once again the highest amount of any country. India and South Korea received the second- and third-most invested capital, at 14% and 9%, respectively, above their long-term averages of 9% and 6%.
Figure Notes
Private equity includes only buyout and growth equity funds.
Global ex US Private Equity and Venture Capital Index Returns
The PE/VC indexes are pooled horizon internal rates of return and are based on limited partners’ fund-level performance; the returns are net of fees, expenses, and carried interest. Because the indexes are capitalization weighted, performance is mainly driven by the largest vintage years.
Public index returns are shown as both time-weighted returns (average annual compound returns) and dollar-weighted returns (modified public market equivalent). Returns are annualized, with the exception of returns less than one year, which are cumulative. The CA mPME replicates private investment performance under public market conditions. The public index’s shares are purchased and sold according to the private fund cash flow schedule, with distributions calculated in the same proportion as the private fund, and mPME net asset value is a function of mPME cash flows and public index returns.
Vintage Year Returns
Vintage year fund-level returns are net of fees, expenses, and carried interest.
Sector and Country Returns
Industry-specific gross company-level returns are before fees, expenses, and carried interest.
GICS® Sector Comparisons
The Global Industry Classification Standard (GICS®) was developed by and is the exclusive property and a service mark of MSCI Inc. and S&P Global Market Intelligence LLC and is licensed for use by Cambridge Associates. Other includes sectors that make up less than 3% of the CA benchmark.
About the Cambridge Associates LLC Indexes
Cambridge Associates derives its Developed Markets (ex US) Private Equity and Venture Capital Index from the financial information contained in its proprietary database of global ex US private equity and venture capital funds. As of December 31, 2020, the database comprised 923 global ex US developed markets buyouts, growth equity, and venture capital funds formed from 1986 to 2020 with a value of about $406 billion. Ten years ago, as of December 31, 2010, the benchmark index included 569 global ex US developed markets funds, whose value was roughly $227 billion. The funds in this index invest primarily in developed markets in Australia, Canada, Israel, Japan, New Zealand, Singapore, and Western Europe.
Cambridge Associates derives its Emerging Markets Private Equity and Venture Capital Index from the financial information contained in its proprietary database of global ex US buyouts, growth equity, and venture capital funds. As of December 31, 2020, the database comprised 712 emerging markets private equity and venture capital funds formed from 1986 to 2020 with a value of about $304 billion. Ten years ago, as of December 31, 2010, the benchmark index included 410 emerging markets funds, whose value was about $86 billion. The funds in this index invest primarily in Africa, emerging Asia, emerging Europe, Latin America & Caribbean, and the Middle East ex Israel.
The pooled returns represent the net periodic rates of return calculated on the aggregate of all cash flows and market values as reported to Cambridge Associates by the funds’ general partners in their quarterly and annual audited financial reports. These returns are net of management fees, expenses, and performance fees that take the form of carried interest.
About the Public Indexes
The MSCI All Country World Index (ACWI) is a free float–adjusted, market capitalization–weighted index designed to measure the equity market performance of developed and emerging markets. As of December 31, 2020, the MSCI ACWI consisted of 49 country indexes comprising 23 developed and 26 emerging markets country indexes. The developed markets country indexes included are: Australia, Austria, Belgium, Canada, Denmark, Finland, France, Germany, Hong Kong, Ireland, Israel, Italy, Japan, the Netherlands, New Zealand, Norway, Portugal, Singapore, Spain, Sweden, Switzerland, the United Kingdom, and the United States. The emerging markets country indexes included are: Argentina, Brazil, Chile, China, Colombia, Czech Republic, Egypt, Greece, Hungary, India, Indonesia, Korea, Malaysia, Mexico, Pakistan, Peru, the Philippines, Poland, Qatar, Russia, Saudi Arabia, South Africa, Taiwan, Thailand, Turkey, and the United Arab Emirates.
The MSCI EAFE Index is a free float–adjusted, market capitalization–weighted index that is designed to measure large- and mid-cap equity performance of developed markets, excluding Canada and the United States. As of December 31, 2020, the MSCI EAFE Index consisted of the following 21 developed markets country indexes: Australia, Austria, Belgium, Denmark, Finland, France, Germany, Hong Kong, Ireland, Israel, Italy, Japan, the Netherlands, New Zealand, Norway, Portugal, Singapore, Spain, Sweden, Switzerland, and the United Kingdom.
The MSCI Emerging Markets Index is a free float–adjusted, market capitalization–weighted index that is designed to measure large- and mid-cap equity performance of emerging markets. As of December 31, 2020, the MSCI Emerging Markets Index included 26 emerging markets country indexes: Argentina, Brazil, Chile, China, Colombia, Czech Republic, Egypt, Greece, Hungary, India, Indonesia, Korea, Malaysia, Mexico, Pakistan, Peru, the Philippines, Poland, Qatar, Russia, Saudi Arabia, South Africa, Taiwan, Thailand, Turkey, and the United Arab Emirates.
The MSCI World Index represents a free float–adjusted, market capitalization–weighted index that is designed to measure the equity market performance of developed markets. As of December 31, 2020, it includes 23 developed markets country indexes: Australia, Austria, Belgium, Canada, Denmark, Finland, France, Germany, Hong Kong, Ireland, Israel, Italy, Japan, the Netherlands, New Zealand, Norway, Portugal, Singapore, Spain, Sweden, Switzerland, the United Kingdom, and the United States.
Footnotes
- The private equity index includes buyout and growth equity funds.
- Funds in the developed markets (ex US) PE/VC benchmark primarily invest in companies in Europe, but occasionally make investments in US companies, as well. This is particularly true of “global” managers included in the ex US indexes.
- Funds in the emerging markets PE/VC benchmark occasionally invest in companies in developed markets countries, as well as those in the emerging markets regions.
Caryn Slotsky - FootnotesThe private equity index includes buyout and growth equity funds. Funds in the developed markets (ex US) PE/VC benchmark primarily invest in companies in Europe, but occasionally make investments in US companies, as well. This is particularly true of “global” managers included in the ex US indexes. Funds in the emerging markets PE/VC benchmark occasionally […]
About Cambridge Associates
Cambridge Associates is a global investment firm with 50+ years of institutional investing experience. The firm aims to help pension plans, endowments & foundations, healthcare systems, and private clients achieve their investment goals and maximize their impact on the world. Cambridge Associates delivers a range of services, including outsourced CIO, non-discretionary portfolio management, staff extension and alternative asset class mandates. Contact us today.