2026 Outlook: Fixed Income Views


Investors should maintain exposure to high-quality sovereigns and avoid duration bets in 2026
by TJ Scavone
Yields on most major developed market (DM) sovereign bonds reached a multi-year high in 2023 and have since held just below those highs, trading in a relatively narrow range. We expect this pattern to persist into 2026, supported by a resilient yet uncertain economic and policy backdrop, fair valuations in most markets, and ongoing yield curve pressures. Investors should keep allocations to high-quality sovereigns closely aligned with policy guidelines.
Looking ahead to 2026, the environment for most high-quality sovereigns remains broadly supportive. Economic growth is healthy but slowing—DM real GDP is projected to rise 1.7% in 2025, down from 1.9% in 2024, with most of the deceleration in the United States. While US consumer spending remains supportive, the labor market has softened, and the full impact of tariffs remains uncertain. These dynamics are likely to keep the Fed and other major central banks biased toward modestly easing in 2026, despite persistent inflation concerns. Overall, softer labor markets, tariff headwinds, and resilient but softer growth—supported by healthy consumer spending, AI capex, and easier policy—should limit both recession and inflation risks, resulting in modestly lower policy rates in many markets and rangebound sovereign bond yields in 2026.
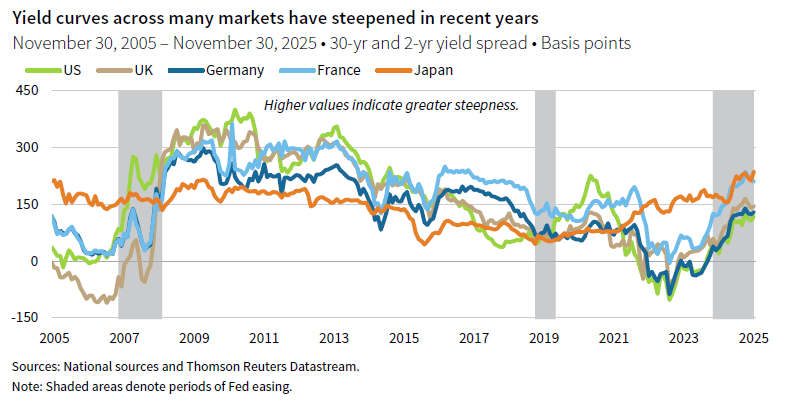
Given this backdrop, we recommend maintaining exposure to high-quality sovereign bonds, with duration risk kept in line with benchmarks. The case for a short-duration stance has weakened as short-term rates have declined and yield curves have steepened, raising the opportunity cost of holding cash. Likewise, the case for adopting a long-duration stance is not compelling. Long duration typically outperforms when growth slows and central banks ease, but we anticipate only limited monetary easing. The European Central Bank and Bank of England have already delivered most of their anticipated cuts and markets are pricing in around 75 basis points (bps) of Fed cuts in 2026—a scenario that looks optimistic, considering current risks. Additionally, sovereign bond yields in key markets, like the United States and euro area, are currently in the bottom half of what we consider their fair value ranges, leaving little room for further declines absent a recession.
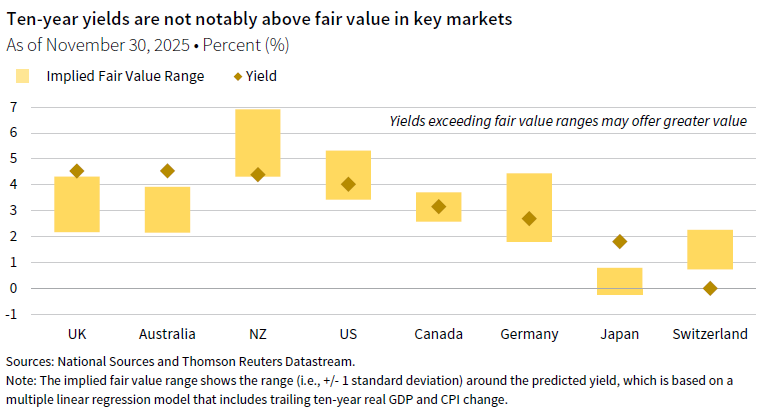
There are risk factors that warrant close attention. We have recently seen longer-duration sovereigns underperform as a range of influences—including fiscal concerns, elevated macro volatility, and cyclical factors—have put upward pressure on yields further out the curve. Fiscal pressures in particular have repeatedly made headlines in recent years, with many DM countries facing challenging fiscal outlooks and heightened volatility around budget stand-offs. While fiscal pressures warrant monitoring, market pricing does not signal imminent fiscal crisis, nor are they the sole driver. Elevated macro volatility, structural headwinds, and cyclical factors like monetary policy have also contributed. Many of these influences should reverse in a growth shock, allowing bonds to rally and provide portfolio ballast, as seen at points this cycle. However, with these crosscurrents, investors should demand more attractive yields before adding exposure. For context, yields would need to rise another 130 bps–180 bps to reach the upper end of their implied fair value range in the United States and Germany. Some regions offer more value, but domestic and currency risks need to be considered. In most cases, we recommend waiting for more attractive US Treasury valuations—given global spillover effects—before extending duration risk.
Overall, we anticipate that bonds will outperform cash in most major markets—supported by steeper yield curves—and should maintain their defense role in a downturn. However, since current bond yields are not especially attractive relative to our fair value estimates, we recommend maintaining allocations at policy levels, and keeping duration risk closely aligned to benchmarks.
Investors should underweight public corporate credit in 2026
by TJ Scavone
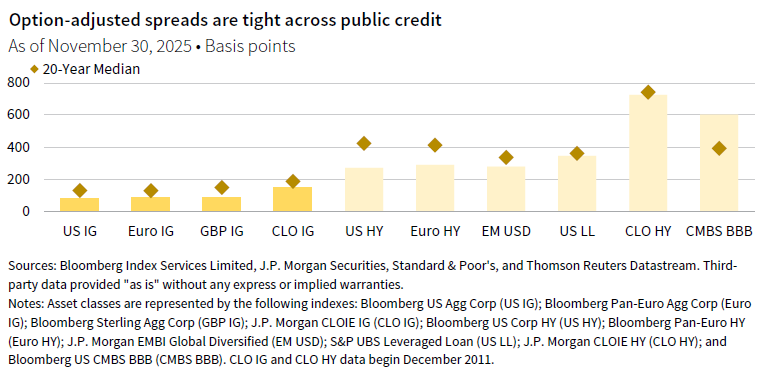
At present, the public credit universe offers few compelling opportunities. While returns have been solid and fundamentals remain sound, public credit is increasingly a one-sided trade. Spreads for both investment-grade and high-yield corporates are near historic lows, and the economic backdrop is turning less supportive. We see potential for spreads to widen in 2026 and beyond, and as a result, we favor higher-quality spread products that offer better relative value and more diversified return streams.
US investment-grade corporate bonds returned 6% annualized over the trailing three years as of November 30, and US high-yield bonds returned 10%. These strong returns were driven by high starting yields and a significant narrowing in credit spreads—down 52 bps for investment-grade and 179 bps for high-yield. The tightening in spreads, a pattern that was evidenced across most regions and instruments, was justified by robust economic and earnings growth, resilient corporate fundamentals, and subdued issuance, but yields are now less compelling, and spreads are historically tight across public credit.
While spreads could drift lower in the near term, upside for public credit is limited and downside risks have increased. The environment is more fragile, with slowing growth and emerging stress in the labor market and among low-income consumers and select corporate borrowers, highlighted by recent high-profile defaults. Riskier assets look increasingly vulnerable after the sharp run-up in equity valuations, as discussed earlier in this outlook, and the potential for slower growth and elevated costs could pressure corporate earnings and margins. Although material spread widening is not our base case, the credit cycle is maturing and risks favor wider spreads, supporting an underweight stance in public corporate credit within core fixed income.
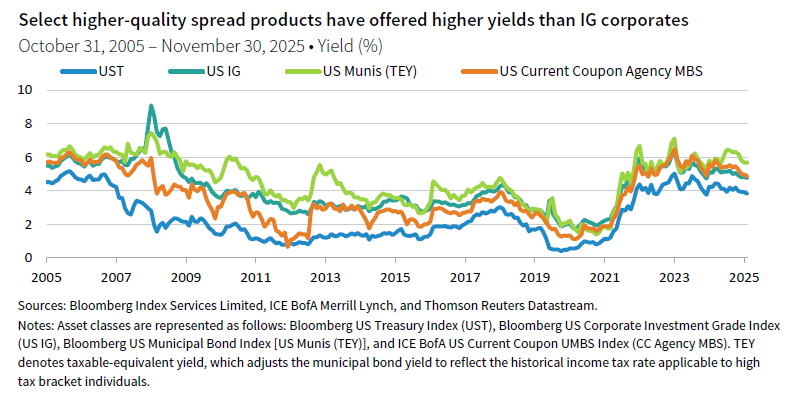
Despite expensive public credit markets, select spread products offer compelling relative value. We favor US agency mortgage-backed securities (MBS)—particularly higher-yielding current coupons—and US municipal bonds (munis). We believe current coupon MBS are higher quality and well positioned to outperform if spreads widen, providing defense without sacrificing yield. Notably, current coupons (4.9%) now yield more than corporates (4.8%). Historically, at these levels, current coupons have outperformed corporates 62% of the time over the next two years, with returns ranging from -3% to 11% per year. Their spreads, unlike corporates, remain above historical lows with room to tighten as rate volatility subsides. Although rate volatility has declined since its recent peak, it remains somewhat elevated. With quantitative tightening ending and further modest rate cuts likely once tariff-related inflation pressures ease, there is scope for both volatility and MBS spreads to compress further, supporting returns.
Munis also offer attractive relative yields for taxable investors. For high-tax-bracket US families, munis have consistently delivered stronger after-tax returns than Treasury bonds and corporates. After adjusting for taxes, the yield advantage for munis is unusually wide—currently about 185 bps versus Treasury bonds and 93 bps versus corporates, among the widest taxable-equivalent spreads since the Global Financial Crisis, excluding isolated stress periods. Many taxable investors reduced muni holdings over the past decade, favoring Treasury bonds or, in some cases, even reaching for yield in credit, as low yields limited their tax advantage and valuations were less compelling. That is no longer the case, and the current environment favors shifting back toward munis at the margin.
Against this backdrop, it is important to recognize that public credit markets overall offer limited upside and heightened downside risk as spreads remain tight and the economic outlook softens. In this environment, we recommend a defensive posture within core fixed income, emphasizing higher-quality, more resilient sectors, with attractive relative value. US current coupon agency MBS and municipal bonds stand out for their relative yield advantage and diversification benefits. For those investors for whom these investments are appropriate, focusing on them may help position portfolios for more balanced risk-adjusted returns in 2026.
Investors should lean into private asset-based finance strategies in 2026
by Wade O’Brien
In 2026, credit investors face challenges such as expensive valuations, moderating growth and falling yields. Recent bankruptcies like First Brands and Tricolor also highlight the risk of weaker underwriting in at least some segments. We believe the solution is focusing on less correlated private credit strategies such as asset-based finance (ABF), insurance-linked securities, and litigation funding. Some of these strategies can be accessed via semi-liquid vehicles, freeing up illiquidity budgets for other parts of the portfolio.
Less correlated private credit strategies are attractive relative to expensive public credit assets. Strong demand has pushed spreads on assets like US high-yield and investment-grade bonds near the bottom decile of historical data, as we discuss elsewhere in this outlook. While demand across products is likely to be underpinned by yields near historical medians, returns are vulnerable if the pace of expected Fed cuts disappoints.
ABF funds offer investors the ability to diversify portfolios away from cyclical and expensive corporate lending. These funds lend against a variety of assets including consumer loans, real estate, and equipment leases. Underlying loans are less economically sensitive and have shorter maturities, allowing lenders to reprice them more quickly as conditions change. Accelerated cash return can also help investors concerned about slower distributions in other parts of their private portfolios. Recent bankruptcies have drawn attention to the ABF market, but were idiosyncratic, given the fraud and business practices involved. Still, they highlight the importance of careful manager selection, as both cases involved red flags that were ignored by markets. Fundraising by dedicated ABF funds has picked up but remains a fraction of the volumes seen in other private credit strategies.
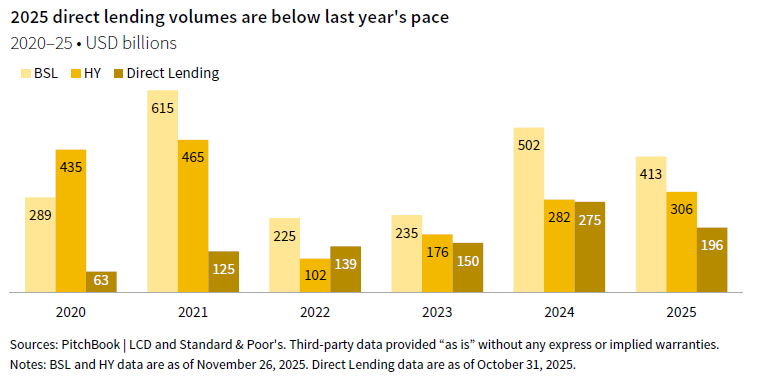
While direct lending funds are currently less attractive in our view than less correlated private credit strategies, they remain attractive relative to comparable public credits. Fed rate cuts and lower spreads will impact returns, but fundamentals have been stable and defaults limited. The biggest near-term challenge for direct lending funds is competition from both the syndicated loan market and retail-targeted vehicles. Semi-liquid retail funds, including private business development corporations (BDCs) and interval funds, had accrued around $350 billion in assets by year-end 2024, a 60% increase in just two years. Reduced buyout volumes have cut supply and added to pressure on spreads, but resurgent M&A activity as rates decline and tariff uncertainty clears may help. Lower middle market lending funds, which offer higher spreads and better protections for lenders, are preferred to upper middle market.

Investors can access direct lending and ABF via open-ended vehicles as well as traditional closed-end funds. Private BDCs and interval funds may charge higher fees but offer investors the ability to more frequently adjust exposures. Investors that can access lower fee institutional evergreen funds may find them an attractive substitute for liquid credit assets featuring low spreads and yields.
Other private credit strategies—such as royalties, litigation finance, and insurance-linked securities—also have appeal. They tend to have resilient income streams insulated from the economic cycle and less sensitive to corporate fundamentals. Returns for these strategies have compared favorably with other types of private credit in recent years. These markets require highly specialized expertise, making their return streams less vulnerable to rising competition or surging demand from retail-targeted offerings.
In summary, with public credit markets offering limited value and increased competition, investors should look to private credit—especially ABF and specialized strategies—for better diversification, resilience, and risk-adjusted returns in 2026.
The Bloomberg Pan-European Aggregate Corporate Index is a market capitalization-weighted index that measures the performance of investment-grade corporate bonds denominated in European currencies (primarily EUR, GBP, and other European currencies). The index includes fixed-rate, investment-grade corporate debt issued in the pan-European region, and is designed to provide a broad representation of the European corporate bond market.
The Bloomberg Pan-European High Yield Index measures the market of non–investment-grade, fixed-rate corporate bonds denominated in the following currencies: euro, pound sterling, Danish krone, Norwegian krone, Swedish krona, and Swiss franc. Inclusion is based on the currency of issue, and not the domicile of the issuer.
The Bloomberg Sterling Aggregate Corporate Index measures the performance of the investment-grade, fixed-rate, GBP–denominated corporate bond market. The index includes securities issued by industrial, utility, and financial companies that meet specific eligibility criteria for inclusion in the GBP–denominated investment-grade universe.
The Bloomberg US Aggregate Corporate Index measures the performance of the investment-grade, fixed-rate, taxable corporate bond market in the United States. The index is a component of the broader Bloomberg US Aggregate Bond Index and includes USD-denominated securities issued by industrial, utility, and financial companies.
The Bloomberg US CMBS BBB Index measures the performance of the lower investment-grade, fixed-rate, commercial mortgage-backed securities (CMBS) market in the United States, specifically those securities rated BBB. The index is a subset of the broader Bloomberg US CMBS Index and is designed to represent the performance of BBB-rated tranches within the US CMBS market.
The Bloomberg US Corporate High Yield Index measures the US corporate market of non-investment grade, fixed-rate corporate bonds. Securities are classified as high yield if the middle rating of Moody’s, Fitch, and S&P is Ba1/BB+/BB+ or below.
The Bloomberg US Corporate Investment Grade Bond Index measures the investment-grade, fixed-rate, taxable corporate bond market. It includes USD-denominated securities publicly issued by US and non-US industrial, utility, and financial issuers.
The Bloomberg US Municipal Bond Index measures the performance of the US municipal bond market. The index includes investment-grade, tax-exempt municipal bonds issued by state and local governments and agencies across the United States.
The Bloomberg US Treasury Index measures the performance of public obligations of the US Treasury. The index includes US Treasury bonds and notes across the full spectrum of maturities and is a widely recognized benchmark for the US government bond market.
The ICE BofA US Current Coupon UMBS Index tracks the performance of newly issued, agency mortgage-backed securities (MBS) in the United States, specifically Uniform Mortgage-Backed Securities (UMBS) with current coupon characteristics. The index is designed to represent the performance of the most recently issued, pass-through MBS backed by Fannie Mae and Freddie Mac.
The J.P. Morgan Collateralized Loan Obligation Index (CLOIE) High Yield Index measures the performance of US broadly syndicated, arbitrage CLO tranches that are rated below investment grade (high yield). The index is designed to provide a representative benchmark for the US high-yield CLO market.
The J.P. Morgan Collateralized Loan Obligation Index (CLOIE) Investment Grade Index measures the performance of US broadly syndicated, arbitrage CLO tranches that are rated investment grade. The index is designed to provide a representative benchmark for the US CLO market, focusing on investment-grade tranches.
The J.P. Morgan Emerging Markets Bond Index (EMBI) Diversified measures the performance of USD–denominated sovereign bonds issued by emerging markets countries. The index uses a diversified weighting methodology to limit the influence of the largest issuers, providing a more balanced representation of the emerging markets sovereign debt universe.
TJ Scavone - T.J. is a Senior Investment Director in the Capital Markets Research Group at Cambridge Associates.
Wade O’Brien - Wade O’Brien is a Managing Director for the Capital Markets Research team at Cambridge Associates.
About Cambridge Associates
Cambridge Associates is a global investment firm with 50+ years of institutional investing experience. The firm aims to help pension plans, endowments & foundations, healthcare systems, and private clients achieve their investment goals and maximize their impact on the world. Cambridge Associates delivers a range of services, including outsourced CIO, non-discretionary portfolio management, staff extension and alternative asset class mandates. Contact us today.