Liability-Hedging Strategies for US Plan Sponsors in the Low Interest Rate Era


As sponsors of US single-employer defined benefit plans know all too well, interest rates have experienced dramatic swings in recent years. While many plan sponsors have adapted to this environment by strategically hedging their liability interest rate risk, many are still questioning the efficacy of doing so—especially when interest rates appear to be low. Yet, failing to hedge long-duration liabilities with long-duration assets is a risky endeavor that exposes the plan sponsor to significant downside risk.
While the motivation to reduce hedge ratios is understandable, a robust liability-hedging program is still essential for pension risk management. Over the long run, maintaining strategic hedge targets has generally led to a better outcome than taking asset-liability duration bets via a tactical under-hedge. This is due to three main reasons:
- It is difficult to predict the entry and exit timing of tactical bets.
- Decreasing the duration of the fixed income portfolio generally results in a lower yielding portfolio.
- Decreasing the hedge ratio leads to higher funded status volatility.
This paper provides context on liability hedging, as well as actionable guidance on how to navigate this low interest rate environment. The first part shows that, unless a plan sponsor not only excels at predicting the timing and magnitude of future rate shifts but also has a liability-hedging program nimble enough to enable quick changes, it risks deterioration of funded status and an increase in funded status volatility by not hedging liabilities. The second part addresses specific considerations for those plan sponsors who are contemplating a tactical under-hedge. Lastly, the final section discusses potential strategic-target adjustments to consider if rates fall further.
An Interest Rate Roller Coaster
The recent swings in discount rates have impacted pension plan liabilities since, under US and international accounting standards, single-employer pension liabilities are valued using AA-corporate bond yields. As measured by the commonly used FTSE Pension Discount Curve over the past five years, prior to the recent decline in rates, there were three other “low” periods when the discount rate for a typical pension plan rested around 3.5% and two periods in which the discount rate rose as high as 4.4% (Figure 1). 1 As of the end of third quarter 2019, the discount rate was 3.13%. This begs the question: Is this an opportune time to lower the hedge ratio?
FIGURE 1 FTSE PENSION LIABILITY INDEX DISCOUNT RATE
September 30, 2014 – September 30, 2019 • Percent (%)
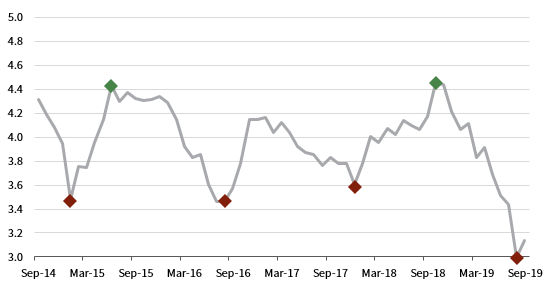
Source: FTSE Russell.
One point to notice from Figure 1 is how quickly rates have a tendency of reversing upon hitting lows or highs. For instance, rates rose quickly following the 2016 election and fell rapidly after the fourth quarter 2018 market sell-off. Such events suggest timing plays a significant factor when it comes to capturing gains from interest rate increases through tactical approaches. In addition, knowing when to reallocate from tactical to strategic (i.e., long term) targets is paramount to achieving success. Without proper execution and a game plan in place, a tactical bet may quickly turn unsuccessful and expose the plan to additional risk and volatility.
To analyze how a tactical under-hedge without proper risk controls would have performed during this period, we illustrate a plan’s hypothetical funded status from a few different starting dates. Our analysis is based on a plan with the following characteristics: 2
- It is hard-frozen with a duration of approximately 12 years as of September 2014.
- It has an 85% funded status and an 80% allocation to the liability-hedging portfolio.
- It has a strategic interest rate hedge target of 80%, which is achieved via Long Credit Index and Long US Treasury STRIPS Index.
- It has a tactical hedge target of 50%, which is achieved via Long Credit Index and US Aggregate Fixed Income Index.
- It does not transition from tactical to strategic targets over the projection period.
Figure 2 demonstrates the impact on funded status from both a tactical and strategic approach, beginning with the first low point in interest rates on January 31, 2015, when the hypothetical plan discount rate was at 3.3%.
FIGURE 2 PLAN FUNDED PERCENTAGE: TACTICAL POSITION INITIATED JANUARY 31, 2015
September 30, 2014 – September 30, 2019 • Percent (%)
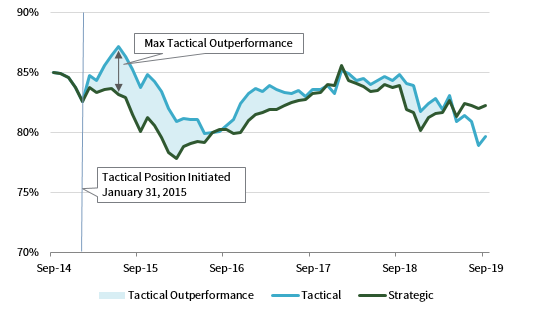
Sources: Bloomberg L.P., Bloomberg Index Services Limited, Cambridge Associates LLC, and MSCI Inc. MSCI data provided “as is” without any express or implied warranties.
Compared to the strategic approach, the initial tactical position would have resulted in a 4% higher funded status a mere five months later. At this point, however, the plan sponsor would have needed to begin locking in funded status gains, as tactical outperformance decreased over time, completely eroding through various points over the subsequent five years.
This example may represent the most favorable outcome, since it assumed plan sponsors were able to allocate to a tactical target at the exact monthly low point of discount rates. To provide additional color, we highlight the resulting performance if the tactical position were initiated either one month earlier or later (Figures 3 and 4).
FIGURE 3 PLAN FUNDED PERCENTAGE: TACTICAL POSITION INITIATED ONE MONTH EARLIER
September 30, 2014 – September 30, 2019 • Percent (%)
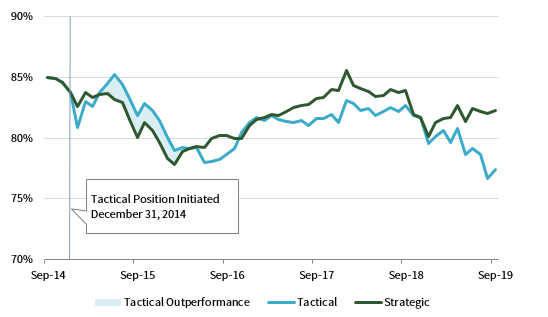
Sources: Bloomberg L.P., Bloomberg Index Services Limited, Cambridge Associates LLC, and MSCI Inc. MSCI data provided “as is” without any express or implied warranties.
FIGURE 4 PLAN FUNDED PERCENTAGE: TACTICAL POSITION INITIATED ONE MONTH LATER
September 30, 2014 – September 30, 2019 • Percent (%)
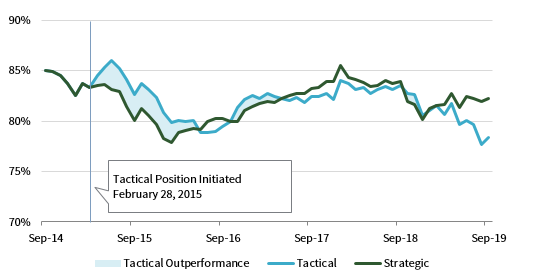
Sources: Bloomberg L.P., Bloomberg Index Services Limited, Cambridge Associates LLC, and MSCI Inc. MSCI data provided “as is” without any express or implied warranties.
As shown by the blue shaded area in Figures 3 and 4, the tactical position’s outperformance is diminished. The plan sponsor would have needed foresight—as well as luck—to precisely time the low point of rates to experience more meaningful gains in funding status. In addition, the plan sponsor would have needed to reallocate back to the strategic hedge target over time or it would have lost its funded status gains. Achieving both of those aims would have been extremely difficult in practice.
It is worth noting that no plan sponsor would tactically under-hedge a plan in expectation of falling rates. However, in the event a plan sponsor initiates a tactical under-hedge at a point in time when rates turn out to be at near-term highs, funded status will deteriorate more under a tactical approach than under a strategic approach.
Putting rate movements aside, longer maturity instruments better capture the term premia of fixed income. In an upward sloping yield curve, longer maturity fixed income carries a higher yield than similar instruments with shorter maturities to compensate investors for the longer time horizon. While the Treasury yield curve can invert, the US corporate curve is less prone to inversion. 3 Over time, the additional yield of longer duration instruments begins to outweigh other factors of fixed income returns. The longer the time horizon, the more benefit there is to continue allocating to strategic targets (Figure 5).
FIGURE 5 AVERAGE YIELDS
2009–19 • Percent (%)
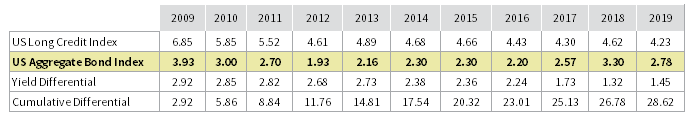
Source: Bloomberg Index Services Limited.
Another issue to consider is that a tactical hedging program results in greater funded status volatility. 4 In the three periods studied, this volatility was 5%–7% greater under the tactical approach than with the strategic approach. Heightened funded status volatility is a risk for plan sponsors, since inopportune funded status changes can negatively impact important corporate objectives in the form of higher contributions and Pension Benefit Guaranty Corporation premiums, as well as disruption to corporate financial results.
In practice it is very difficult for a tactical under-hedge to outperform the strategic hedge over a prolonged period. A tactical approach may be profitable if interest rates were to continue to rise throughout the life of a pension plan. While possible, this scenario is unlikely. In most other occurrences, a tactical approach will weaken a plan’s funded status.
Framework for Tactical Hedging
Despite the risks, plan sponsors may have different views on interest rates, as well as varying risk appetites. Plan sponsors wishing to develop a tactical under-hedge should not only focus on potential rewards, but they should also realize the risks associated with such a plan. Plan sponsors wishing to take the risk of assuming that interest rates will rise should do so with a clear and actionable plan. To maximize the chances of success, this plan should include a comprehensive framework for reallocating from tactical to strategic targets.
In developing this framework, the first step is to determine the level of risk appetite, or the tactical hedge target. This can range from all cash (not recommended) to a moderate 30 to 40 percentage point decrease from the current strategic hedge ratio. The second step is to determine the level of interest rates deemed “normal” at which the under-hedge would no longer apply. The final step is to establish criteria, which could involve interest rate levels, funded status levels, or the elapsed time, to increase the hedge ratio from the tactical target to the strategic target. The criteria would depend on the plan sponsor’s market outlook and risk tolerance.
To continue with our hypothetical plan example, a plan sponsor with an 80% strategic hedge target may determine that a 3% yield on the 30-year Treasury is “normal.” The plan sponsor could lower the hedge ratio to 50% and use the illustrative guide in Figure 6 to transition back to the strategic target.
FIGURE 6 GUIDE TO TRANSITION BACK TO STRATEGIC TARGET
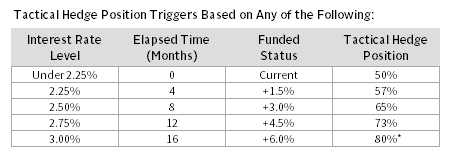
Source: Bloomberg Index Services Limited.
Overall, this framework (if properly executed) would help mitigate some of the risk associated with a tactical approach by embedding risk control measures while still providing a benefit if rates were to increase (Figure 7). As shown, the selected framework (or “hedge path”) results in robust outperformance that is sustained throughout the projection period. 5
FIGURE 7 PLAN FUNDED PERCENTAGE: TACTICAL POSITION WITH “HEDGE PATH”
September 30, 2014 – September 30, 2019 • Percent (%)
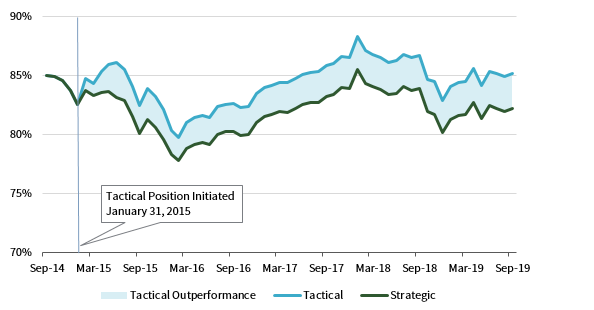
Source: Cambridge Associates LLC.
Note: Position initiated on January 31, 2015 and fully closed June 30, 2016.
Similar to a glide path, which is commonly used by plan sponsors, the “hedge path” can become another element of the investment strategy. As such, it should be defined in the investment policy statement and regularly monitored. Effective governance and the ability for timely execution are critical for the tactical strategy to be successful. Consequently, such an approach is best suited for plan sponsors with a specialized investment staff or through a discretionary manager.
For sophisticated plan sponsors comfortable with more exotic swaption strategies, selling payer swaptions at strike levels equal to the pre-determined interest rate triggers can accomplish similar objectives as the described hedge path. 6 This approach will lock in the interest rate decision triggers by forcing plan sponsors to increase duration levels if rates do rise, while at the same time providing a funded status gain via the premium collected until the interest rate level is breached.
Sub-Zero Territory
Recent rate declines in Europe have indicated that it is no longer implausible to assume that sovereign yields—even in the United States—could be negative. While economic conditions and growth expectations in the Unites States are currently different than in other parts of the world, negative rates are nonetheless a possibility. Although such a scenario is perhaps more likely for shorter maturities, it is less likely for the entire curve to have a negative yield. Even then, if the entire Treasury curve carries a negative yield, it does not necessarily suggest that AA-corporate bond yields, which are used to discount pension liabilities, would be negative. All things considered, there is plenty of room left before pension plans will have to grapple with negative corporate bond yields.
Even in the event AA yields do become negative, there is no clear consensus how this environment would impact the valuation of pension liabilities. There are mainly two possibilities: (1) Pension plan liabilities can be valued with negative yields, as is the case with some European funds, which means that hedging them strategically with long-duration fixed income would still be applicable, 7 or (2) interest rates used to value pension obligations would have a floor of 0%, which may be more in line with the notion that pension liabilities should not be worth more than the underlying benefits. This floor would then create an asymmetrical risk profile for pension obligations, resulting in less need to fully hedge liabilities as rates approach 0%. In fact, in this scenario, if liability discount rates are capped at 0%, they can only go up. In such a scenario, whether likely or not, virtually no incentive exists to continue hedging liabilities; instead, plans should strategically allocate to mostly cash-like instruments.
As shown in Figure 8, duration for the hypothetical plan in this paper gradually begins to decline after 1%. 8 As the effective interest rate approaches zero, pension plan duration drops off significantly until it reaches zero. This behavior helps guide the appropriate hedging methodology. Along with a decline in duration comes an increase in the cash allocation, with a full cash portfolio at the 0% interest rate level.
FIGURE 8 DURATION AND CASH ALLOCATION PER EFFECTIVE INTEREST RATE
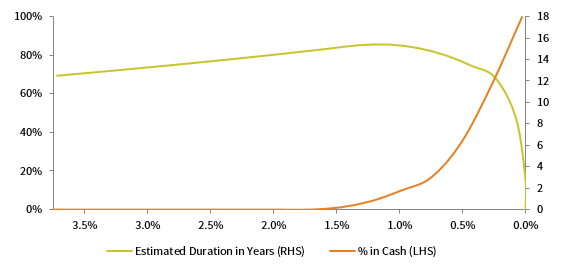
Source: Cambridge Associates LLC.
As already mentioned, such a scenario is very unlikely. Pension discount rates have a long way down before approaching the 1% threshold noted in Figure 8, and we would not recommend any plan sponsor structure a fixed income portfolio with a negative rate situation in mind. At least for the foreseeable future, plans should maintain adequate hedge targets to offset the risk from declining interest rates. This is another reason why maintaining strategic hedge targets, even in the current rate environment, is the most prudent approach to pension risk management.
Additional Notes
All results in this paper are based on hypothetical index returns. In the real world, transaction costs would have to be accounted for and would ultimately reduce some of the positive results of active liability-hedging management using tactical approaches. Effective active management within the long-duration fixed income space should negate some of the disparity; however, rapid reallocation would involve additional governance and manager considerations.
Index Disclosures
Barclays US Long Credit Index
The Barclays US Long Credit Index represents long-term corporate bonds. It measures the performance of the long-term sector of the United States investment-bond market, which, as defined by the Long Credit Index, includes investment-grade corporate debt and sovereign, supranational, local-authority and non-US agency bonds that are dollar denominated and have a remaining maturity of greater than or equal to ten years.
Barclays US Aggregate Bond
The Barclays US Aggregate Bond index is market capitalization weighted and includes Treasury securities, government agency bonds, mortgage-backed bonds, and corporate bonds. It excludes municipal bonds and Treasury inflation-protected securities because of tax treatment.
Barclays Capital US Treasury STRIPS 20-30 Year Equal Par Bond Index
The Barclays Capital US Treasury STRIPS 20-30 Year Equal Par Bond Index measures the investment return of Treasury STRIPS with maturities ranging from 20 to 30 years. A Treasury STRIP represents a single coupon or principal payment on a US Treasury security that has been stripped into separately tradable components.
Footnotes
- FTSE Pension Discount Curve represents a proxy for AA-rated bonds. For the purposes of this analysis, the FTSE discount curve was applied to the hypothetical pension plan described in this paper to develop the resulting liabilities and effective discount rates, which may not match Figure 1.
- Other assumptions include: The growth portfolio is invested in MSCI ACWI; the portfolio is rebalanced quarterly; no changes are made to liability assumptions, plan provisions, or investment strategy; the maximum STRIPS allocation is 10%; and the maximum US Agg allocations are 40% and 60%, respectively.
- For instance, the last time the yield of the Bloomberg Barclays Intermediate Credit Index exceeded the Long Credit Index was 1989, measured on a daily basis.
- Funded status volatility measured as standard deviation of monthly funded status changes from 6.0% to 6.4% annually for all three starting points.
- The triggers used in the design are the same as described in Figure 6, with one modification: The interest rate trigger was adjusted to begin at 2.5% instead of 2.25%, due to the higher yield of the 30-year Treasury rate at January 31, 2015, than as of September 30, 2019.
- Payer swaptions involve the seller paying floating interest rate payments and receiving fixed interest rate payments once an interest rate strike level is breached.
- In August 2019, many pension funds in Switzerland were projected to have a negative discount rate.
- Duration as described in this context is based on a 25-basis point parallel shift in the September 30, 2019, yield curve.
Serge Agres, CFA, FSA, EA - Serge Agres is a Managing Director and Investment Actuary at Cambridge Associates.
About Cambridge Associates
Cambridge Associates is a global investment firm with 50+ years of institutional investing experience. The firm aims to help pension plans, endowments & foundations, healthcare systems, and private clients achieve their investment goals and maximize their impact on the world. Cambridge Associates delivers a range of services, including outsourced CIO, non-discretionary portfolio management, staff extension and alternative asset class mandates. Contact us today.