Not All Liability Hedges Are Created Evenly: Guidance for US Plan Sponsors in Today’s Interest Rate Environment


The year 2020 continues to be tumultuous. For many US pension plan sponsors, the déjà vu of falling discount rates and volatile equity markets again raises the question of how best to hedge pension liabilities, if at all. The issue of liability hedging is especially pertinent in today’s complex and asymmetrical interest rate environment.
This asymmetry is manifested by the forces affecting the Treasury yield curve; while the front end of the yield curve is anchored near zero by the US Federal Reserve, the long end continues to be driven by market participants. The forced asymmetry has already resulted in modest yield curve steepening in the last few months and may result in an even steeper yield curve should economic growth improve and/or inflationary pressures build. This form of yield curve steepening may benefit (or at least not adversely affect) some plan sponsors. But for those with relatively simple liability-hedging portfolios, it may create an unwelcome surprise: despite an increase in the discount rate, the asset/liability deficit could actually widen!
Even in an era of historically low interest rates, robust liability hedging remains a bedrock of prudent pension risk management. Given a heightened risk of yield curve steepening, plan sponsors should (re-)evaluate their asset/liability interest rate risk, both in total and across different maturity points, to quantify the impact of non-parallel yield curve movements and reposition their liability-hedging portfolios as needed.
The Yield Curve: Past, Present, and Future
As the COVID-19 crisis unfolded, the Fed took timely action to lower the Federal Funds Rate and stimulate the economy. This strategy, together with a flight to quality, resulted in a classic interest rate shock scenario: a near-parallel decline in the entire Treasury yield curve. Since then, the Fed has communicated its willingness to maintain short rates near zero through 2023, while also letting inflation run ahead of its 2% target for some time. This policy reduces the chances of future parallel yield curve shifts and increases the risk of non-parallel yield curve changes, such as yield curve steepening (i.e., long rates rising more than short rates).
While the risk of yield curve steepening is now elevated, it is important to note that it is not a guaranteed outcome. Global demand for Treasuries, low bond yields outside the United States, and continued COVID-19 uncertainty continue to put pressure on long yields and may well keep them range-bound. Moreover, there is still a risk of further interest rate declines, especially if global economic growth worsens, a geopolitical event leads to a flight to quality, or the Fed changes its stimulus strategy. Although unlikely, we cannot rule out the possibility of the Fed lowering short-end rates below zero or targeting long-end rates (as it did after the Global Financial Crisis). Such actions would likely drag long rates lower.
How Steep Could the Curve Go?
Yield curve steepness can be measured as the difference between the 30-year and ten-year yields or the 30-year and two-year yields (Figure 1).
FIGURE 1 CURRENT YIELD CURVE LEVEL IS SIMILAR TO OTHER PERIODS OF MARKET STRESS
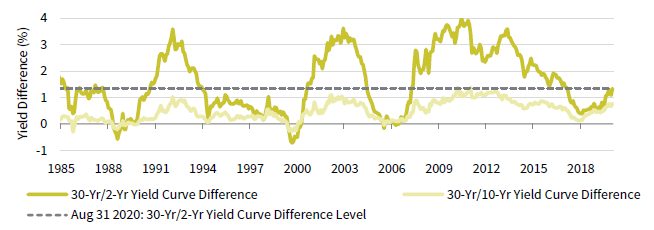
Sources: Bloomberg Index Services Limited and Bloomberg L.P.
Given the Fed’s focus on the front end of the curve, we focus on the difference between 30- and two-year yields, which can vary extensively. The current level is comparable to 1991, 2001, and 2007—all periods after a recent market stress event, which were then followed by more steepening.
While Figure 1 shows many periods of yield curve steepening, including those during which the front end declined, the steepening “events” most comparable to the current environment are those in which the front end instead remains constrained and the long end rises. Historical data over the last 40 years, sampled to include only these events, show an average long end steepening of just 23 basis points (bps) on a monthly basis. However, this data also highlight that the steepening can be much larger, especially over several months (Figure 2). As we’ll cover in the next section, even the average steepener can have a material impact on a plan’s funded status!
FIGURE 2 YIELD CURVE CAN STEEPEN SUBSTANTIALLY, EVEN WITH THE
SHORT END CONSTRAINED
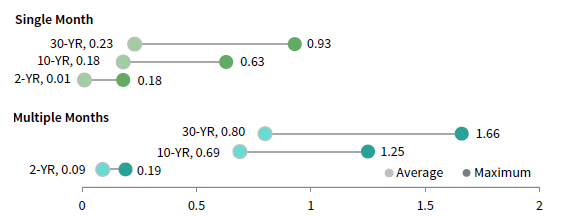
Sources: Bloomberg Index Services Limited.
Please see figure notes for more details.
Liability Hedging and Yield Curve Steepening
A common approach for constructing liability-hedging portfolios entails a combination of long-duration STRIPS (Separate Trading of Registered Interest and Principal of Securities) and long corporate bonds. This approach has many advantages. It provides a capital-efficient way to achieve a high overall interest rate hedge ratio; it relies on transparent and easily benchmarked market-based strategies; it does not require derivatives; and it can be implemented by a plan of any size.
However, this tried-and-true approach also results in an uneven hedge across the yield curve. While it poses low yield curve risk early in the de-risking process, the approach may no longer make sense as a plan’s liability-hedging portfolio increases in size and/or the plan becomes mature. Indeed, it can lead to unintuitive—and potentially detrimental—results, especially if the yield curve steepens materially. Analyzing this possibility requires going one step beyond the total interest rate hedge ratio (which addresses a parallel shift in the yield curve) to isolate the impact of yield curve shifts at individual key rate maturities.
For example, consider a somewhat-mature, well-funded plan, invested with 65% of assets in a combination of long STRIPS and long credit and 35% in growth assets. In this case, while the overall interest rate hedge ratio is 90%, the interest rate hedge at different maturities is not an even 90%: there is a definitive overhedge at the long end (Figure 3). In other words, assets are expected to hedge 90% of a parallel yield curve shift, but the impact of moves in 20- and 30-year yields is bigger on assets than it is on liabilities (and the impact of moves in two- through ten-year yields is smaller).
FIGURE 3 A COMBINATION OF STRIPS AND LONG CREDIT RISKS UNEVEN
HEDGING ACROSS THE YIELD CURVE
Dollar Value of a Basis Point • US Dollar (millions)
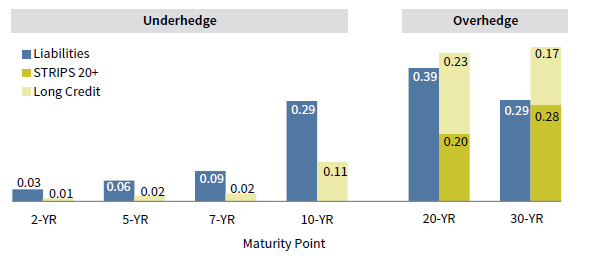
Source: Bloomberg Index Services Limited, Bloomberg L.P., Cambridge Associates LLC, and FTSE International Limited.
Please see figure notes for more details.
In a parallel yield curve shift scenario (ignoring any other market moves), a combination of STRIPS and long credit behaves just like an even 90% hedge across the curve, hedging 90% of the dollar change in the liabilities. However, in the average yield curve steepening scenario noted in the previous section, while an even hedge still hedges 90% of the dollar changes in the liabilities, this strategy leads to the counterintuitive result that assets fall more than liabilities. This means that the deficit actually increases despite interest rates being higher (Figure 4)! Of course, in a mirror-opposite yield-curve flattening scenario, the opposite is true and the deficit decreases even as interest rates fall.
FIGURE 4 UNEVEN HEDGING CAN LEAD TO COUNTERINTUITIVE IMPACTS ON THE
ASSET/LIABILITY SURPLUS
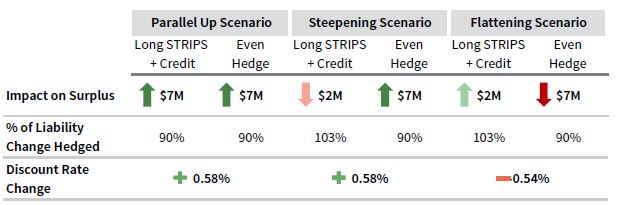
Source: Bloomberg Index Services Limited, Bloomberg L.P., Cambridge Associates LLC, and FTSE International Limited.
Please see figure notes for more details.
Advice for Plan Sponsors
In order to prevent funded status deterioration, plan sponsors should specifically avoid overhedging interest rate risk at longer maturities and should also consider hedging more evenly across the yield curve. This is especially true for mature and well-funded plans where the impact of an uneven hedge is larger. This nuanced approach requires either a custom solution, which may involve derivatives and/or the inclusion of additional market strategies, such as intermediate and core credit and/or Treasuries. Absent derivatives, this can lead to a lower overall hedge ratio and a lower yielding portfolio, drawbacks that need to be considered.
Plan sponsors with an appetite for interest rate risk and an expectation of yield curve steepening could also consider a tactical approach. This approach would specify the interest rate hedge at different maturities based on the level of the 30-year rate or the steepness of the yield curve (i.e., a lower hedge relative to strategic targets today that would increase as the yield curve steepens until it reaches a certain pre-determined level). Developing and monitoring such a framework is paramount to achieve success and also represents prudent asset/liability risk management. 1
As is often the case, these approaches to liability hedging are a balancing act that involves not only risk considerations, but also additional portfolio and benchmark complexity, enhanced asset/liability (and yield curve) monitoring, and potentially higher investment management costs. Given the heightened potential for a steepening yield curve, all plan sponsors should become more aware of the non-parallel yield curve risk embedded in their liability-hedging portfolios and, potentially, re-evaluate their liability-hedging approach. Not doing so could lead to undesirable widening of the asset/liability deficit in what is already a volatile and uncertain market environment.
Figure Notes
Figure 2
Figure 2 was derived from historical Bloomberg data for the two-, ten-, and 30-year Treasury rates. Data was adjusted to only include monthly periods where i) the absolute change in the two-year rate was less than 25 bps and the 30-year rate moved more than two times the absolute change in the two-year rate, ii) the absolute change in the two-year rate was less than 25 bps, but the 30-year rate rose at least 10 bps and at least twice as much as any rise in the two-year rate. Multiple month analysis included periods of general steepening and included at most two months where the rates might not have followed the rules stated above as long the two-year rate still moved less than 25 bps and the curve did not experience a flattening event during those months.
Figures 3 and 4 Sample Plan Analysis
Sample plan is $1 billion in projected benefit obligation liability with liability duration of 11.5 years. The discount curve reflects the FTSE Pension Discount Curve. The plan consists of $900 million in assets. Scenario analysis assumes an instantaneous yield curve shock of 62 bp across the curve for the parallel scenario; 9 bp, 69 bp, and 80 bp to the two-, ten-, and 30-year yields for the steepening scenario; and -6 bp, -69 bp, and -80 bp for the two-, ten-, and 30-year yields for the flattening scenario (and no other market movements or cash flows). All data are as of August 31, 2020. The dollar value of a basis point (DV01) is the dollar impact on assets or liabilities of a 1 bp change in the Treasury yield curve at the specified maturity point. Interest rate hedge ratio is the total DV01 of assets divided by total DV01 of liabilities.
Footnotes
Serge Agres, CFA, FSA, EA - Serge Agres is a Managing Director and Investment Actuary at Cambridge Associates.
About Cambridge Associates
Cambridge Associates is a global investment firm with 50+ years of institutional investing experience. The firm aims to help pension plans, endowments & foundations, healthcare systems, and private clients achieve their investment goals and maximize their impact on the world. Cambridge Associates delivers a range of services, including outsourced CIO, non-discretionary portfolio management, staff extension and alternative asset class mandates. Contact us today.