Liability-Hedging Handbook: A Guide to Best Practices for US Pension Plans


For many pension plans, investment strategy is often structured with a liability-hedging portfolio and a growth portfolio, with the weight and composition of each determined by a strategic asset allocation or a de-risking glidepath. 1 Within this overall structure, the construction and calibration of the liability-hedging portfolio is integral to effective pension asset management. This report focuses exclusively on the liability-hedging portfolio, delineating key considerations and best practices for single-employer defined benefit plans including those sponsored by corporations, health care institutions, non-profit organizations, and certain partnerships.
- Before constructing a liability-hedging portfolio, plan sponsors should: identify the desired liability that they would like to hedge (e.g., the ASC 715 projected benefit obligation); quantify the acceptable funded status risk given the plan’s current funded status, market conditions, and risk tolerance; and recognize the limitations inherent in hedging pension liabilities.
- Funded status should shape the intent and composition of the liability-hedging portfolio. For poorly funded plans with large growth portfolios, for instance, the liability-hedging portfolio should focus on cost- and capital-efficient hedging of overall liability interest rate risk, while for well-funded plans, the focus should be on more closely matching the duration, key rate durations, and credit spread exposure of the liabilities.
- Given the structure of pension liabilities, as well as the composition, liquidity, and transaction costs in the fixed income markets, it is virtually impossible to perfectly mimic the behavior of a discounted liability stream through an investable bond portfolio. Consequently, plan sponsors should balance hedging precision with implementation cost and complexity.
- Plan sponsors should construct the liability-hedging portfolio with the growth portfolio in mind, as the compositions of the two will have important implications for each other; in particular, there is significant correlation between equity returns and changes in credit spreads.
- Plan sponsors should consider using not only physical bonds, but also fixed income derivatives, such as Treasury bond futures, swaps, and swaptions, within their hedging toolkit. While complex, these instruments may provide a more capital- efficient and liquid liability hedge than physical bonds and/or augment an existing physical bond portfolio.
This report has five main sections. The first section explores how to establish the liability-hedging portfolio’s goals and framework, reviewing the role of the liability-hedging portfolio in the context of the overall investment strategy, the appropriate liability to hedge (as there are multiple liability calculations for every plan), and common “hedge ratio” metrics associated with liability hedging. We next explain how real-world constraints in both the actuarial and, more importantly, investment space make it impossible to perfectly hedge a plan’s liability, given these constraints. In the third section, we share our view on the construction of the liability-hedging portfolio, which should optimize duration, curve, and credit spread exposures within the broader context of the total plan’s risks related to both its assets and liabilities. The next two sections address implementation options, focusing on the benefits and drawbacks of physical fixed income and fixed income derivatives, and the alpha potential within the liability-hedging portfolio. We conclude with a section on best practices.
Finally, we should note that while some of the content below is applicable to cash balance plans, as well as traditional defined benefit plans, cash balance plan design can necessitate important variations in the liability-hedging strategy.
I. Establishing the Liability-Hedging Portfolio’s Objectives and Parameters
Pension plan assets are invested with the primary objective of meeting current and future benefit payments to plan participants, often decades into the future. A plan’s funded status, namely the ratio of market value of assets to the present value of liabilities, is a top-level indicator of a plan’s health at any given point in time. There are several aspects to computing the present value of liabilities, with the liability discount rate typically being the most critical factor.
When changes in the present value of liabilities can be hedged (e.g., if the discount rate reflects current corporate bond yields, as is the case under US accounting standards), plan sponsors need to find an appropriate balance between investing to hedge those changes and investing to generate superior returns to help close the asset-liability deficit, offset future administrative expenses, and, in the case of accruing plans, fund future benefit accruals (also known as service costs). These sometimes competing objectives result in an asset allocation approach with two main components (Figure 1):
- Liability-Hedging Portfolio. The goal of the liability-hedging portfolio is to reduce the volatility of the plan’s assets relative to the present value of liabilities due to passage of time and changes in the liability discount rate. This portfolio almost always consists of long duration, investment-grade fixed income and related derivatives because these assets are most sensitive to changes in both interest rates overall (i.e., Treasury bond yields) and in credit spreads (i.e., the yield advantage of corporate bonds over Treasuries), which are the key components of the most commonly used liability discount rates.
- Growth Portfolio. The goal of the growth portfolio is to generate returns that exceed the liability discount rate in order to strengthen the plan’s funded status and offset future plan costs. This portfolio is typically composed of public and private equity, hedge funds, commodities, and growth-oriented fixed income, including private credit and high yield (among other assets). Over the long term, the returns of these assets are expected to exceed the liability discount rate, contributing to the growth of plan assets relative to liabilities.
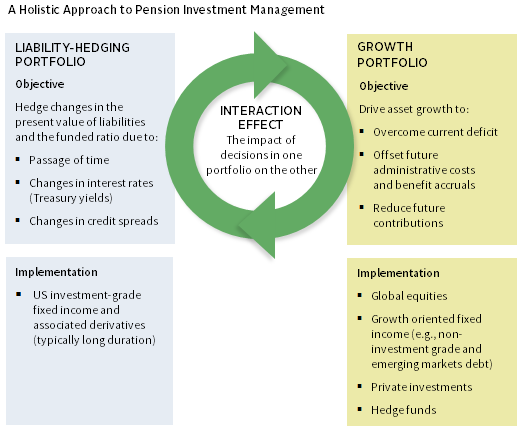
In finding the appropriate balance between these two portfolios, the interaction between them—for example, the correlation between equity market returns and credit hedge funds and changes in corporate bond spreads—should be carefully considered. 2
Defining the Liability
Before constructing a liability-hedging portfolio, it is crucial to determine the liability to be hedged. The three primary methods for calculating plan liabilities and their present value are accounting-based (the projected and accumulated benefit obligations), funding target, and pension risk transfer (or termination) (Figure 2).
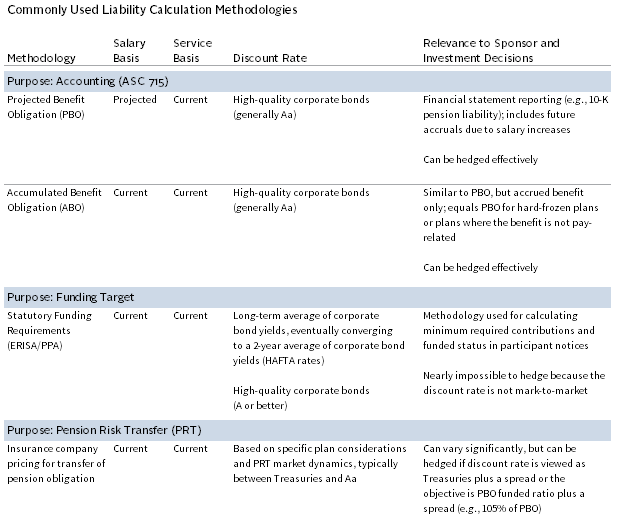
The projected benefit obligation (PBO) is computed in accordance with financial accounting standards, namely ASC 715 (or, previously FAS 87/158) and appears in a plan sponsor’s financial statements. It embeds not only benefits accrued to date (which is reflected in the accumulated benefit obligation [ABO]) but also future accruals due to future salary increases (but not future service). These projected benefits are discounted to present value using a high-quality bond curve, typically assumed to be Aa.
The funding target methodology is used to determine the plan’s minimum required contributions under ERISA and the Pension Protection Act of 2006 (PPA). Like ABO, this approach reflects benefits accrued to date, but, unlike the ABO, it typically uses higher and not entirely market-based discount rates. Pension relief legislation enacted since 2012 (MAP-21, HATFA, and BBA) allows plan sponsors to discount liabilities using a 25-year moving average of yields on corporate bonds rated A or better, subject to certain corridors. In the current low-interest rate environment, this results in a lower present value of liabilities (and therefore lower minimum required contributions) than a market-based approach also permitted under PPA, explaining why the vast majority of plan sponsors have taken advantage of this pension relief. However, this relief may fade over time as the corridor around the 25-year average widens and/or if interest rates rise.
Finally, for plan sponsors wishing to transfer some (or all) of their pension obligations to a life insurance company, the relevant present value of liabilities would be based on insurance pricing. The cost of a pension risk transfer (PRT) reflects not only current bond yields but also plan size, the specific mortality profile of the plan (e.g., blue collar versus white collar), plan provisions (e.g., lump sum options and early retirement subsidies), insurers’ administrative costs and profit margins, and the supply and demand in the PRT market. As a result, there is a range of estimates of PRT liabilities, typically varying from 102% to 115% of PBO for traditional defined benefit plans; this roughly corresponds to a discount rate between Aa and Treasuries.
The discount curves under these three methodologies vary considerably and result in significantly different liability present values (Figure 3). Of particular note is the funding target discount rate, which, for a sample frozen plan with a 15.4-year duration, is 2.2% higher than the accounting discount rate, showing the impact of the 25-year averaging. The present value of the liability increases, moving from top to bottom in Figure 3, as there is an inverse relationship between the discount rate and the present value of the liability. For example, the accounting liability is 39% higher than the funding liability, while the estimated termination liability is 11% higher than the accounting liability.
FIGURE 3 THE VALUE OF LIABILITIES IS DIFFERENT UNDER EACH DISCOUNT RATE
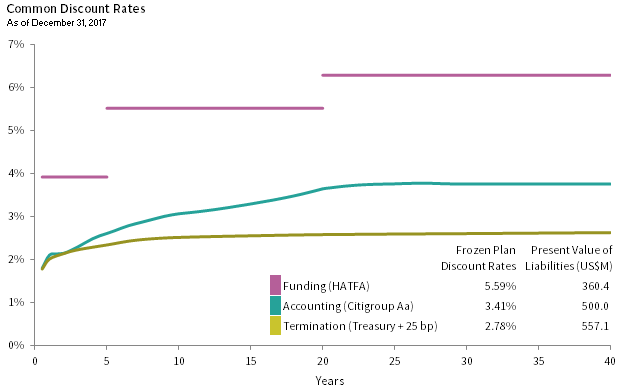
Note: Liability duration is approximately equal to the duration of the BBG Long Government/Credit Index (15.4 years).
While most plan sponsors may want to monitor all three types of pension liabilities, it is important to note that only the accounting and, to a lesser extent, termination liabilities can be effectively hedged. This is because they are more or less mark-to-market, while the funding target liability includes extensive smoothing and artificial constraints that make it nearly impossible to hedge. In the remainder of this report, we focus on PBO liabilities and the Aa discount rate.
Funded Status Implications for Capital Allocation and Hedge Ratios
The weight of the liability-hedging portfolio within the overall asset allocation and its key characteristics (such as interest rate and credit spread durations) 3 are typically a function of the funded status of the plan, the plan sponsor’s objective for asset returns relative to liability hedging, the sponsor’s tolerance for funded status risk (which in turn affects balance sheet and contribution volatilities), and whether the ultimate goal is plan termination or hibernation (i.e., managing a hard-frozen plan without terminating it). Funded status risk (also known as surplus risk) is the expected volatility of the funded status, which estimates the extent to which asset return, interest rate, and credit spread volatilities are expected to result in assets and liabilities deviating from each other.
Though each plan and plan sponsor are unique, generally speaking, poorly funded plans, as well as accruing plans (open or soft-frozen) have high allocations to the growth portfolio and high funded status risk, consistent with their objective of generating asset returns to close the asset-liability deficit and reduce future contributions. On the other hand, well-funded, hard-frozen plans typically have high allocations to the liability-hedging portfolio and low-funded status risk, consistent with their objective of preserving their strong funded status. As described later in the paper, among well-funded, hard-frozen plans, those aiming for termination typically have higher allocations to the liability-hedging portfolio and lower liability tracking than plans aiming for hibernation. A fully funded plan would minimize its funded status risk with a 100% allocation to a theoretical immunization portfolio, where assets perfectly match liabilities.
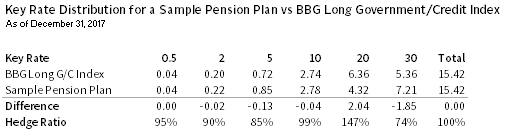
Although funded status risk can be quantified, interest rate and credit spread hedge ratios are more intuitive metrics that, at a high level, assess to what extent a plan is “protected,” given a move in the discount rate (whether from an overall change in interest rates [i.e., Treasury yields] or credit spreads) (Figure 4). In particular, these hedge ratios show how changes in the market value of plan assets, particularly the liability-hedging portfolio, translate into or capture the change in the present value of the liabilities.
FIGURE 4 INTEREST RATE AND CREDIT SPREAD HEDGE RATIOS ARE VALUABLE GAUGES
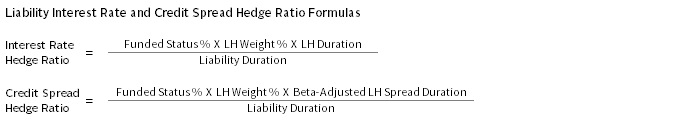
Note: LH denotes liability-hedging portfolio.
For example, consider a plan with the following characteristics:
- Funded Status: 85%
- Liability-Hedging Allocation: 50%
- Liability-Hedging Portfolio Duration: 5.5 years
- Liability Duration: 12 years
Despite a 50% allocation to fixed income, this hypothetical plan maintains an effective interest rate hedge ratio of just 19% (85% × 50% × 5.5 / 12). The interest rate hedge ratio is lower than the liability-hedging portfolio’s weight due to the plan being underfunded and the (much) shorter duration of the assets relative to the liabilities.
For more on the pitfalls of core bond exposure in the liability-hedging portfolio, please see “Avoid the Agg Drag,” Cambridge Associates Research Note, June 2014.
For more information on credit spread hedging, please see “Don’t Forget the Credit Spread!,” Cambridge Associates Research Note, September 2016.
This example reveals the primary weakness of using core or core-plus approaches as liability hedges. Typically benchmarked to the Bloomberg Barclays Aggregate Bond Index, with a duration of approximately six years, these approaches have a meaningful mismatch in duration compared to most pension liabilities, whose durations are typically 10–18 years. Lesser but still important considerations of using these strategies are their significant holdings in mortgage-backed and asset-backed securities as well as potential out-of-index exposures to high-yield and emerging markets debt, all of which are a poor hedge for liabilities marked to market on the basis of Aa corporate yields.
Similarly, the credit spread hedge ratio estimates how protected the plan is from tightening (falling) credit spreads. As an extreme example, a fully funded plan with a 100% allocation to Treasuries matched to the duration of the liabilities would have an interest rate hedge ratio of 100% and a credit spread hedge ratio of 0%. The credit spread hedge ratio depends on the weight of credit in the liability-hedging portfolio and the beta of the credit allocation relative to the Aa nature of the liability discount rate. For example, liability-hedging portfolios with high allocations to Baa-rated securities will usually have a credit spread beta higher than 1 relative to Aa, while portfolios that balance the exposure to Treasuries and investment-grade credit can have a credit spread beta closer to 1.
We briefly note that inflation hedging on its own (i.e., separate from interest rate hedging) is generally not a distinct objective of the liability-hedging portfolio because most US single-employer plans (unlike most public plans) do not include cost-of-living adjustments (COLAs) in their benefit structures. Thus, although an inflation assumption is embedded in the assumed salary growth assumption when calculating the PBO of accruing plans, it is typically not material enough to be hedged.
Long Duration Matters
As we remarked previously, pension liabilities typically have long durations, generally 10–18 years. Being short duration relative to the liabilities—that is, having a small hedge ratio—can degrade the effectiveness of the liability-hedging portfolio and result in significant underperformance of assets relative to liabilities. Figure 5 displays the cumulative performance of a sample liability stream, the Bloomberg Barclays US Long Government/Credit Index (with a duration of 15.4 years at December 31, 2017), and the Bloomberg Barclays US Aggregate Bond Index (with a duration of 6.0 years at December 31, 2017) during a period of falling interest rates. Throughout this period, the liability duration is approximately equal to the duration of the long government/credit index. With a hedge ratio of close to 100% (compared to the Aggregate’s hedge ratio of approximately 39%), the long government/credit index does a significantly better, but not perfect, job of keeping up with growth in the liabilities.
FIGURE 5 LONG BONDS KEEP UP WITH LIABILITIES BETTER THAN CORE BONDS
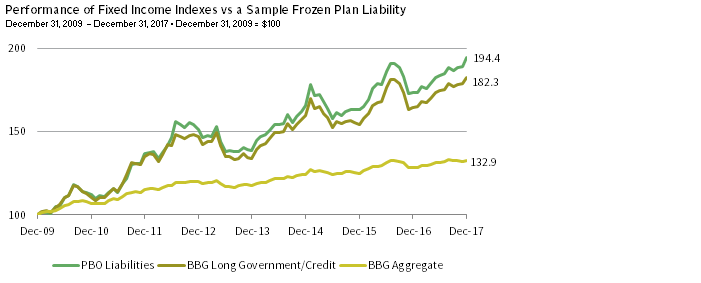
Notes: Liability duration is approximately equal to the duration of the BBG Long Government/Credit Index (15.4 years). Liabilities are valued using the Citigroup Pension Discount Curve.
Customizing the liability-hedging strategy to match not only the overall liability duration but its exposures along the yield curve and the credit risk of the Aa discount rate would reduce and potentially eliminate this underperformance, but all of these are “second-order” considerations after setting the liability-hedging portfolio’s duration.
II. Perfect Liability Matching Is Impossible and Impractical
A plan’s liability present value calculation is subject to many complexities and, as a result, plans encounter numerous implementation challenges and trade-offs. Some aspects of the liability, such as mortality and other demographic assumption changes, as well as plan experience (i.e., deviations in actual plan experience from assumptions), simply cannot be hedged with investments. Putting these aside, it is still virtually impossible to perfectly mimic the behavior of a discounted liability stream through an investable bond portfolio. In this section, we discuss the most notable challenges in creating the elusive liability-replicating, or immunized, portfolio.
Specifically, we note the following chief challenges in perfectly hedging a liability stream: curve matching, credit spread constraints, high-quality concentration, and downgrade decay. Because many of these challenges cannot be completely eliminated, we advise plan sponsors to devise the most effective liability hedge that mitigates these trade-offs, and then to manage funded status risk to an acceptable level, rather than try to attain a false sense of precision at a greater cost.
Curve Matching
The first step in constructing the liability-hedging portfolio is matching the interest rate duration of the portfolio to the duration of the liability (or another duration target that is sensible relative to the liabilities). For the vast majority of plans, liability duration is in the range of 10–18 years, meaning that these liabilities can be hedged with physical bonds and, at the longer end, potentially with Treasury STRIPS and/or derivatives.
A liability-hedging portfolio that matches the liability duration may still take on a certain amount of curve risk. To provide an example, Figure 6 compares a liability cash flow stream with that of the Bloomberg Barclays Long Government/Credit Index, both having a duration of 15.4 years as of December 31, 2017. If a 1% parallel interest rate shift were to occur instantaneously (holding credit spreads constant), the index and the liability would experience approximately the same returns of ±15.4% (not accounting for convexity effects).
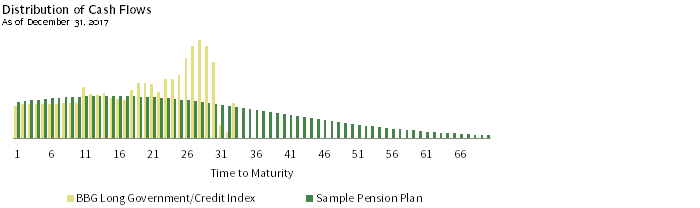
Note: Sample plan duration is approximately equal to the duration of the BBG Long Government/Credit Index (15.4 years).
However, such duration positioning often comes with a significant amount of curve risk (Figure 7). The liability exhibits the familiar “bell curve” shape spanning a number of decades, while the index, by design, is heavily clustered in the ten- to 30-year maturity space. As a result, relative to liabilities, this implementation results in a meaningful overweight to changes in the 20-year yield and underweights elsewhere, especially in the 30-year yield. In other words, if the 30-year yield were to fall—or 20-year yield were to rise—while the rest of the curve were not to change as much, the assets would significantly underperform the liabilities. Indeed, no yield-curve change affects all maturities equally, so such positioning is therefore susceptible to the flattening, steepening, and kinking that can result in a term structure of rates over time.
FIGURE 7 DISTRIBUTION OF BENEFIT PAYMENTS CREATES CURVE RISK
Note: Sample plan duration is approximately equal to the duration of the BBG Long Government/Credit Index (15.4 years).
It is possible to mitigate these curve exposures by matching not only the total liability duration but also key rate durations through customized portfolio construction and the use of derivatives. This is crucial for well-funded plans with large allocations to liability-hedging portfolios. However, as we will discuss in the next section, plans with low funded status and large allocations to growth assets are typically better served by hedging overall duration via cost-efficient long duration strategies (such as indexed STRIPS) rather than expensive, customized key-rate, duration-matching portfolios.
Credit Spread Constraints
Using the accounting methodology, pension liabilities are discounted using a Aa corporate bond curve, which embeds a spread above the risk-free (Treasury) curve. This credit spread component creates at least five issues for liability-hedging purposes:
- Corporate spreads provide a “carry” of excess yield over Treasuries. A liability-hedging portfolio that relies solely on Treasury bonds to maintain duration exposure will lag the liability growth by virtue of not earning the long duration Aa credit spread (which has been in the 90–200 basis point (bp) range since the global financial crisis). This means that a liability-hedging portfolio should have at least some credit exposure.
- Liabilities valued with corporate bond yields exhibit sensitivity to movements in credit spreads. Again, if a liability-hedging portfolio is implemented solely using Treasury bonds, it would not hedge any increase in the present value of liabilities resulting from a tightening (decline) in credit spreads.
- Matching the Aa nature of the liability discount rate (rather than a broader investment-grade corporate bond yield) is particularly challenging, given few Aa-rated corporate issuers and issuer concentration, especially at longer maturities.
- Even if a liability-hedging portfolio includes some credit exposure, long-maturity corporate bonds are generally less liquid and exhibit higher transaction costs than Treasury bonds, making customization more difficult. Such liquidity and cost constraints also create challenges in making needed adjustments over time as the portfolio and liability profile evolve.
- Few derivative options to simulate corporate bond exposure are available (unlike futures and swaps, which are readily available for Treasury bond exposure), further limiting liability hedge customization. The most readily available corporate derivatives, credit default swaps, have an effective duration that is too short for most liability hedges and also embed a fair amount of “basis risk” (differences between cash and synthetic valuation).
Similar to the challenges associated with managing curve exposures, the plan sponsor must arrive at the best solution that manages credit exposure in the most effective manner possible, while keeping in mind the growth portfolio. In general, asset allocations with high-equity exposures and/or higher levels of equity beta are better served by maintaining lower corporate exposure and higher Treasury exposure, given the correlation of corporate spreads and equity risk.
High-Quality Concentration
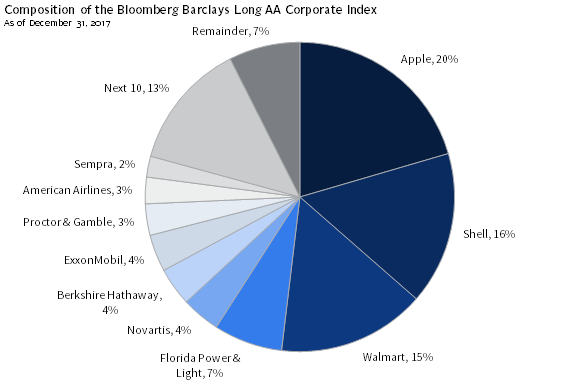
The Aa nature of the liability discount rate may seem conservative on the surface, yet plans that elect to perfectly mimic this high-quality exposure by investing solely in Aa-rated bonds assume a substantial amount of issuer concentration risk in their corporate bond portfolios (Figure 8). The top ten issuers make up more than 79% of the Bloomberg Barclays Long Aa Corporate Bond Index, with Apple allocating 20% alone (followed by Shell and Walmart at 16% and 15%, respectively). 4 The level of concentration is generally inappropriate for any bond portfolio, even if it is intended to be a “perfect” liability hedge. Plan sponsors can mitigate this concentration risk by investing in a blend of Treasuries and investment-grade bonds (which include bonds rated Baa or higher) such that the quality profile of the total portfolio is similar to that of the Aa universe. The total investment-grade universe is much broader, allowing for a significantly more diversified and less concentrated portfolio.
FIGURE 8 AA UNIVERSE IS HIGHLY CONCENTRATED
Downgrade Decay
A significant disconnect between the liability discount curve drawn from the Aa corporate bond universe and the liability-hedging portfolio is the impact of bond downgrades and defaults. If an issuer is downgraded below Aa or sustains a default, its yield generally rises, which means that the market value of the liability-hedging portfolio decreases. On the other hand, the liability discount curve ejects the downgraded or defaulted bond and re-prices the discount rate as if the index never held the bond in the first place, meaning that the discount rate is actually lower (or unchanged) and the present value of liabilities increases (or doesn’t change).
For example, in June 2012, five banks were downgraded below Aa by both Moody’s and S&P, and thus fell out of the Aa universe. This resulted in a 20 bp decrease in the Citigroup Pension Liability Index discount rate, a commonly used discount curve source. Thus, a portfolio replicating this index (whose duration is over 18 years) and holding these bonds would have lagged a corresponding liability by more than 3% over just one month! This is not an isolated issue. Moody’s estimates that, between 1970 and 2016, an average of 16% of all Aa-rated corporate credit was downgraded below Aa in one year and 52% over five years.
In the broad investment-grade universe, which has many more issuers, the effects are similar, although smaller. Still, when they are compounded over time across many downgrades, the drag from this issue becomes extremely meaningful. This effect is compounded by forced selling immediately following the downgrade, if the investment guidelines are particularly strict. Unfortunately, there is limited counterbalance to this downgrade headwind—corporate bonds that get upgraded will usually have realized much of the upgrade’s benefit well before inclusion in the higher-quality index.
The downgrade decay shows why effective active management is crucial for managing the credit exposure within the liability-hedging portfolio. In addition, flexible investment guidelines that broaden the permissible credit quality of holdings (into securities rated Baa, for example) allow limited exposure to high yield (i.e., securities rated below Baa-), and give investment managers sufficient time to sell downgraded securities, which can also help mitigate downgrade decay.
III. Liability Hedge Construction
The previous section touched on the constraints inherent in perfectly matching a liability proxy based on Aa corporate bond yields. We now address a key aspect of liability-hedging portfolio construction: the impact of the weight and composition of the growth portfolio on the liability-hedging portfolio.
The end goal of the total asset allocation is to maximize asset return over a liability return at a controlled level of funded status risk. Thus, the liability-hedging portfolio should not attempt to perfectly immunize a cash flow stream, but rather optimize duration, curve, and credit spread exposures within the broad asset-liability context that includes all assets.
Equity Interaction Effect
Credit spreads are a component of liability discount rates, but a plan should be cautious in assuming that heavy or exclusive use of credit-related securities is appropriate in all cases. Changes in credit spreads and equity markets are highly correlated (Figure 9); this is intuitive, as healthy economic conditions and an improved risk sentiment that drive equity returns are also conducive to lower implied credit spread risk (and therefore lower credit spreads), and better performance among corporate bonds.
FIGURE 9 EQUITIES ARE CORRELATED TO CHANGES IN LONG CREDIT SPREADS

Notes: Changes in credit spreads are month-to-month. All equity returns are net of dividend taxes. Excess return is the return of the BBG Long IG Credit Index over comparable-duration Treasuries.
As a result of this relationship, plans must take into account the relative size and riskiness of the growth portfolio (i.e., its market beta) when determining the right mixture of Treasuries and credit in the liability-hedging portfolios.
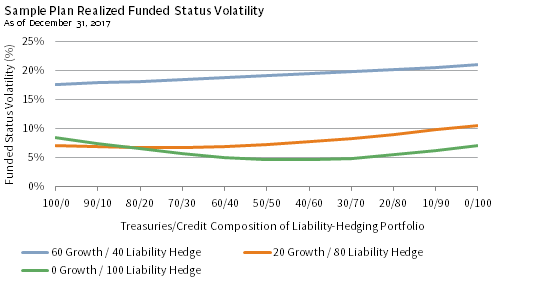
This is not only a theoretical construct; Figure 10 demonstrates realized funded status volatility for a sample plan assuming different growth/liability hedge splits and Treasury/credit weights within the liability-hedging portfolio. It shows that equity risk can have substantial implications for implementing the liability-hedging portfolio:
- A fully funded plan with an asset allocation of 60% growth/40% liability hedge minimizes funded status volatility with a zero allocation to credit. This is not surprising, since at 60% growth assets, the overall asset strategy has enough “credit beta” to hedge the credit component of the liabilities. Though the liability-hedging portfolio on its own may underperform the liability (as it lacks the credit spread exposure), the overall portfolio is expected to far outperform due to the growth assets.
- A fully funded plan with a 20% growth/80% liability hedge allocation appears to benefit from a modest exposure to credit as the weight of the growth portfolio is smaller. Again, while the liability-hedging portfolio on its own may underperform the liability, the overall portfolio is expected to outperform due to the growth assets.
- Finally, a fully hedged plan (i.e., 100% liability-hedging assets) minimizes funded status volatility at approximately 60% credit/40% Treasuries, reflecting the Aa nature of the liability discount rate. In this case, it may make sense to slightly increase the credit exposure to achieve a higher carry to offset potential downgrades or other headwinds.
In Figure 10, we assumed that the liability-hedging portfolio is duration matched to the liabilities. This means the interest rate hedge ratios for the 60% and 20% growth portfolios are 40% and 80%, respectively. In these instances, it makes sense to extend the duration of the liability-hedging portfolio beyond the duration of the liabilities to target a hedge ratio that is closer to 100%. While this would lower the two curves in Figure 11, the overall conclusion that lower weight to credit at higher growth portfolio weights decreases funded status volatility would still hold. Also, in Figure 11, we assume that the growth portfolio is invested 100% in MSCI ACWI; in reality, a more diversified growth portfolio that includes hedge funds and private investments would result in lower funded status volatility and, potentially, a lower correlation to credit within the liability-hedging portfolio.
FIGURE 10 AT HIGHER GROWTH ALLOCATIONS, HIGHER CREDIT EXPOSURE GENERALLY INCREASES FUNDED STATUS RISK
Notes: Liability duration is approximately equal to the duration of the BBG Long Government/Credit Index (15.4 years). Liabilities are valued using the Citigroup Pension Discount Curve. The sample plan growth portfolio is 100% allocated to the MSCI All Country World Index, while the liability-hedging portfolio is a duration-matched blend of the BBG Intermediate Treasury Index, the BBG Long Treasury Index, the BBG Intermediate Credit Index, and the BBG Long Credit Index. The portfolio is rebalanced monthly. Funded status volatility is computed assuming no contributions, no benefit payments, no manager value-add, and no transaction costs over a five-year period ending December 31, 2017.
Avoiding False Precision
How precise the liability-hedging portfolio’s mechanics need to be depends on a plan’s funded status and the weight of the liability-hedging portfolio. In the most extreme example, a poorly funded plan with a large growth portfolio can typically achieve an interest rate hedge ratio of at most 40% (and even that might require the use of STRIPS or derivatives). In this case, long duration (obtained cheaply) reduces funded status risk much more efficiently than a finely tuned, curve-matching portfolio. Conversely, a well-funded plan that invests nearly all of its assets to hedge the liabilities has a very low tolerance for funded status volatility, raising the degree of liability- hedging precision.
Most plans are likely somewhere between the two end points described above. In determining the appropriate definition and implementation of a liability hedge, plans should consider the trade-offs associated with:
- Customization. A plan that elects to become more precise with the liability curve, rate, and spread hedging should engage with an experienced liability-driven investing manager (not just a successful long credit manager) that understands the nuances of liability hedging. If multiple managers are involved, one should serve as a completion manager, i.e., a manager responsible for putting on yield curve exposures that account for all managers in the portfolio while matching liability-based targets. Management fees, oversight, account structure, and, if multiple managers are involved, manager communication should be evaluated relative to the benefit of improving the precision of liability hedging.
- Benchmarking Complexity. Selecting common indexes, such as the Bloomberg Barclays Long Government/Credit, Long Credit, Long Treasury, or 20+ Year STRIPS as the benchmark for the liability-hedging portfolio can be an attractive option. This approach enables transparency, allows for straight-forward attribution, and provides an easy measure of program success. However, for more customized portfolios (e.g., those matching the specific liability duration), a blend of market indexes would be more appropriate. Finally, for liability-hedging portfolios that aim to match duration, curve, and spread risk of the liabilities, a blend of market benchmarks plus futures positions that more closely mimic liability key rate exposures would be appropriate. Regardless of its complexity, the benchmark should be investible to evaluate the efficacy of the liability-hedging portfolio managers.
- Permissible Quality. A narrow limit on permissible quality may entail concentration and downgrade risks, as described earlier. Allowing for lower-quality (but still investment-grade) securities, modest limits on high-yield securities, and flexibility in selling downgraded bonds can help mitigate downgrade headwinds and, in the long run, provide enhanced returns with reasonable correlation to the liabilities.
- Permissible Securities. Securitized assets (such as mortgage-backed securities), floating-rate paper, and high-yield bonds are “out-of-index” when compared to the liability discount curve and typical long-duration benchmarks. However, skilled active managers may be capable of accentuating returns of the liability-hedging portfolio with these holdings. These potential return enhancements should be evaluated relative to the tracking error being assumed.
- Portfolio Leverage and Operational Complexity. As we will discuss, fixed income derivatives can be very useful in managing specific curve exposures for a plan, relative to its liability (as well as for poorly funded plans aiming to extend duration in a capital-efficient way), but such exposures can add operational complexity and involve the assumption of portfolio leverage, and adequate parameters should be crafted to ensure that leverage is employed appropriately.
IV. Liability-Hedging Implementation Options
After incorporating all of the duration, curve, and credit nuances described above to arrive at an optimal liability hedge, plans can implement the portfolio in a variety of ways. In this section, we review the key benefits and drawbacks of commonly used approaches. The implementation options provide differing degrees of complexity, liquidity, and tracking error; as each approach has its own pros and cons, the suitability of each approach is dependent on a plan’s specific circumstances.
Physical Fixed Income
Physical implementation refers to a portfolio consisting of actual fixed income securities, with targeted duration either set in line with a benchmark or equal to a plan’s liability in a customized strategy. The specific types of bonds in the physical portfolio would be calibrated based on the plan’s funded status, liability-hedging portfolio weight, and so forth. As noted earlier, because few plans offer COLAs in their benefit structure, liability-hedging portfolios contain mostly nominal fixed rate corporate and government securities. For plans with COLAs, inflation-hedging assets such as TIPS can offset the cost of rising liabilities in the event of rising inflation.
An approach that emphasizes physical bonds has several advantages:
- Implementation is relatively straightforward, which mitigates execution risk for less well-resourced investment organizations;
- Portfolio holdings are transparent, and portfolio performance and characteristics are easy to measure and compare to a reference benchmark (or the liabilities); and
- Implementation can be either passive, which is particularly suitable to Treasuries (where, we believe, little value can be added through duration and yield curve positioning), or active, which is particularly suitable to credit, where security selection (including out-of-benchmark securities) is crucial for both value-add relative to a benchmark and the avoidance of downgrade headwind relative to the liabilities.
Practically speaking, corporate bond investments are only investable in the physical format, as credit default swaps—the only liquid and investable credit derivatives—reflect a significant basis risk and are not appropriately calibrated in terms of duration.
A physical approach does have drawbacks, although the nature of the drawbacks is uniquely different for poorly funded versus well-funded plans:
- For a poorly funded plan, a physical portfolio may not be capital efficient because it traps a fair amount of plan assets in the role of hedging liabilities, depriving the asset allocation of the much-needed growth assets necessary to generate excess returns.
- For a well-funded plan focused on customization, while a physical portfolio can match overall liability duration, it is likely to retain material curve mismatches relative to the liabilities, exposing the plan to funded status risk from nonparallel shifts in the yield curve.
- Some physical securities (e.g., coupon Treasury STRIPS and certain corporate bonds), may be less liquid than commonly used derivatives, particularly Treasury futures, creating transaction cost and liquidity concerns.
Synthetic Fixed Income
The capital efficiency and liquidity of derivatives offers unique benefits in managing exposures for the liability-hedging portfolio, often allowing plan sponsors to target higher hedge ratios and/or match curve exposures more closely than would be possible with physical securities only. However, derivatives also present unique risks and considerations from investment, operations, and reporting perspectives, including ASC 820 (formerly FAS 157). Plans should ensure that these risks and complexities are well articulated and managed at a policy level, and implementation of derivatives may very often need to reside with an external manager. Three key derivative types are covered below: Treasury futures, interest rate swaps, and swaptions. 5 All of these derivatives do not reflect corporate bond spreads and, therefore, cannot hedge the credit spread component of the liability discount rate.
Treasury Futures. Like futures on other assets (commodities, equities, etc.), Treasury bond futures provide the buyer (“going long”) with exposure to Treasury bond returns while putting up only a small portion of capital as margin (as low as 5% in some instances) compared to holding actual Treasury bonds. Treasury futures provide exposure to two-, five-, ten-, and 30-year Treasury yields, allowing plans to gain exposure to various interest rate points along the curve.
If interest rates fall and both liabilities and Treasury bonds experience positive returns, the long side of the futures contract benefits and is paid by the short side of the contract. Given the long duration nature of pension liabilities, plans typically extend duration by purchasing ten- and 30-year Treasury futures (adjusted as needed for curve parameters). Similarly, a pension investor can lighten duration exposure at various maturities (e.g., if there is more than sufficient exposure in a physical portfolio) by selling (“going short”) futures contracts. In custom strategies, Treasury futures are used in combination with physical bonds to manage the key rate exposures of the portfolio relative to the liabilities.
Because Treasury futures are very actively traded and the market is very deep, implying good liquidity and relatively low transaction costs, they are often the first “go-to” derivative among many fixed income managers. Another benefit of Treasury futures is that they are exchange-listed with daily margin settlement, eliminating considerations of counterparty risk and complexities tied to International Swap and Derivatives Association (ISDA) or other over-the-counter (OTC) procedures.
One key consideration of Treasury futures is the management of margin requirements particularly in stress environments when interest rates rise sharply (thereby requiring the posting of additional margin). Unless outsourced to the manager responsible for managing the futures, a plan must maintain the proper operational resources to handle the funding and maintenance of margin. In addition, Treasury futures expire every few months and consequently need to be “rolled” to maintain a position. Finally, margin presents additional reporting requirements.
Interest Rate Swaps. A fixed-for-floating interest rate swap is a contract whereby one party agrees to pay the other party a fixed amount in exchange for a floating amount periodically for a pre-determined amount of time. For instance, in a 30-year interest rate swap, party A agrees to pay party B a fixed amount (equal to a fixed rate times a notional amount determined in advance) in exchange for a floating amount (equal to a short-term rate, typically LIBOR, plus a spread, times the same notional amount). Over the life of this hypothetical swap (which could span as long as 30+ years), the counterparties would swap cash flows every quarter (or, depending on the terms of the contract, every month) (Figure 11). The parties can also settle the swap by netting out the present value of future payments based on current swap rates.
FIGURE 11 INTEREST RATE SWAP SCHEMATIC
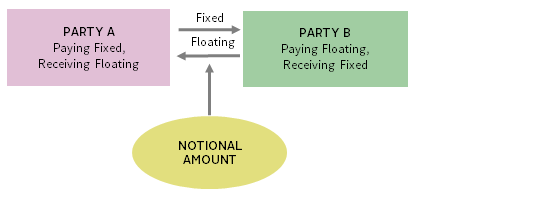
In this transaction, party B has effectively purchased a fixed-term bond with a fixed coupon rate but without the principal payment at the end and has therefore assumed interest rate duration consistent with owning a bond. (The duration of the floating rate leg is negligible as the rate resets quarterly or monthly.) Thus, a pension investor can add duration by assuming a position similar to party B or lighten up on duration by assuming a position similar to party A.
A significant advantage of employing swaps is the capital efficiency of the position. Since neither party is required to pay any amount up front, investors can increase the duration of their portfolios without having to tie up a significant amount of capital. (However, capital infusions may be necessary if there are material moves in interest rates.) Another positive is that there is a large and liquid market for swaps of varying maturities and, as such, they can be cheap to trade, particularly when compared to physical corporate bonds. In particular, the market for ultra-long swaps (above 30 years) is more liquid and active than that for 30-year Treasury bonds or STRIPS.
Plans must be aware of key considerations, however. The biggest drawback of interest rate swaps is that they reflect swap rates, which are related to Treasury yields and corporate spreads but are not perfect indications of each. For example, regulatory reform of derivatives (such as the Dodd-Frank Act) and changes in LIBOR calculations have significant implications for swap spreads but do not affect Treasury yields or credit spreads directly. Thus, a liability-hedging portfolio that includes swaps is subject to a risk not found in the liabilities. In particular, since the financial crisis, somewhat counterintuitively, swap spreads (i.e., differences between swap rates and Treasury yields) have been negative and volatile, indicating their basis risk relative to Treasury yields.
Another consideration is operational complexity. Specifically, unlike in the case of futures, market participants wishing to enter into a fixed-for-floating interest rate swap need to negotiate with a specific counterparty—they cannot simply enter into a swap as they would into a standard futures contract on an exchange. However, once the contract is executed, swaps are cleared via a clearing house which, as in the case of futures, is responsible for setting margin requirements and taking on counterparty risk. Nevertheless, swap position sizing, trading, and reporting can all be more complex than is the case for plain vanilla bonds or Treasury futures. In addition, the logistics of clearing may entail additional legal and administrative expenses.
Other, more customized swaps are OTC derivatives, meaning that they are not exchange cleared. This creates further complexity in contract negotiation (with additional legal and administrative expenses) and ongoing collateral management (as margin requirements are set and enforced by the counterparties, not the clearinghouse), and heightens counterparty risk. To the extent a plan has earned profits on a swap (i.e., fixed rate payments are consistently exceeding floating rate payments, and unwinding the swap would require a large payment from the other party), it is vulnerable (and is taking credit risk) to the financial institution that acts as the counterparty. Although this risk can be mitigated by proper collateral and netting agreements, it must be monitored very closely.
As with Treasury futures, swaps inherently target one point of the maturity spectrum; thus, a plan would take on significant curve risk if it only purchased swap exposure to a single reference point. The curve mismatch risk can be mitigated by entering into multiple swaps with different underlying rates (i.e., five-year, ten-year, etc.), or by using other instruments in addition to swaps.
Swaptions. Swaptions are options on interest rate swaps, allowing plans to obtain asymmetric payoff profiles in differing rate environments. A buyer of a receiver swaption has the right (but not the obligation) to enter into an interest rate swap (whose terms have been specified at purchase of the swaption) as the receiver of the fixed rate at the expiry of the swaption. Similarly, the buyer of a payer swaption has the right to enter into an interest rate swap as the payer of the fixed rate on the expiration date. Like interest rate swaps, swaptions are customizable, specifying the strike interest rate, the time to expiration, and the duration of a swap; the buyer of a swap pays the seller a premium for this optionality.
If structured properly, swaptions can provide a plan some protection from funded status deterioration if rates were to fall, while providing upside potential if interest rates were to rise. Specifically, a plan can buy an out-of-the-money receiver swaption with a strike corresponding to the level of interest rates at which the plan would like to have protection (e.g., if the 30-year swap rate is currently 3%, the plan may want protection at 2%). The payout is then as follows:
- If interest rates fall below the strike, the liabilities increase in value more than the assets, but the swaption becomes “in-the-money,” effectively increasing the value of the swaption to offset the rise in the market value of liabilities. If the plan actually enters into the swap (rather than settling it), it gains duration and protection from declines in interest rates.
- If interest rates do not breach the strike, the plan remains short duration and potentially benefits from rising interest rates, as liabilities decrease in value with no impact on the swaption; the plan is simply out the premium of the swap.
Another application of swaptions is the possibility of earning extra income if a plan is short duration relative to the liabilities, and a rise in interest rates (and, potentially a derisking change in the asset allocation) would naturally make the plan nearly 100% funded, where the benefit from further increases in interest rates are minimal. To implement this option, the plan can sell a payer swaption and set the strike price to the desired higher level of interest rates. Then:
- If interest rates rise to the strike, the liabilities decrease in value more than the assets, but since the option is in the money, the plan owes the buyer the settlement value of the swap, offsetting some of the benefit of rising interest rates.
- If interest rates do not breach the strike, the plan pockets the swaption premium with no impact on the swaption.
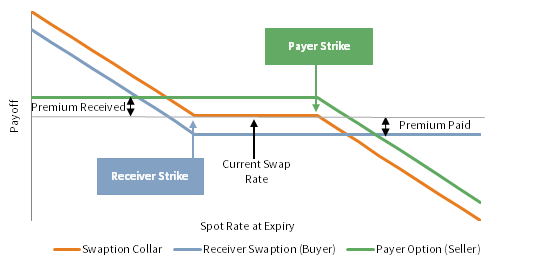
A plan can combine both approaches in a zero-cost swaption collar. In this scenario, the plan sponsor would sell a payer swaption and use the corresponding premium to buy a receiver option, as shown in Figure 12. The collar’s pricing, payoff profile, and other characteristics will vary widely based on the current swap curve, forward curves, interest rate volatility, and other factors. Similar to plain vanilla interest rate swaps, swaptions are capital efficient and allow plans to hedge their interest rate exposure without having to tie up a large amount of their capital in the liability-hedging portfolio.
FIGURE 12 SWAPTION PAYOFF DIAGRAM FOR A PENSION PLAN
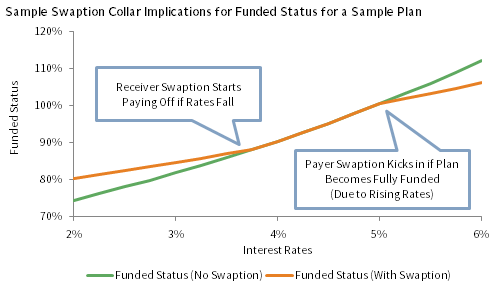
As noted earlier, swaptions can be particularly attractive to plans that are not too far from becoming fully funded. Such plans can put on swaption collars, with the payer leg struck at a rate that results in funded status being at or above 100% (on a mark-to-market or termination basis). Since the plan sponsor generally does not benefit from trapped surplus assets (i.e., the portion of assets in excess of the present value of the liabilities), any upside gains from rising rates beyond becoming fully funded can be sold, and the proceeds can be used to buy additional protection against falling rates. Figure 13 shows the funded status of a sample plan with a swaption collar structured so that the payer leg kicks only when funded status is anticipated to exceed 100%. At that point or above, the sponsor’s utility (or use) for any further gains is limited, and any further potential upside gains in funded status can be used to fund downside protection.
FIGURE 13 SWAPTION COLLARS CAN BE PARTICULARLY EFFECTIVE FOR WELL-FUNDED PLANS
Like interest rate swaps, swaptions exhibit basis risk and lack corporate spread exposure. Further, because swaptions are OTC derivatives, the swaption approach entails potential counterparty risk, collateral and cash flow management, and ISDA negotiation. One additional drawback is the high level of complexity of swaptions, even relative to swaps. Since swaptions combine elements of both options and interest rate swaps, plan investors may need time and expert guidance to become comfortable with their risks and benefits.
V. Alpha Considerations
By design, the growth portfolio has a much greater potential to add value relative to the liabilities than the liability-hedging portfolio, and plan sponsors should set their alpha expectations accordingly. Nevertheless, there is potential for meaningful value-add in fixed income but, like any value-add, it requires a certain amount of active risk (or tracking error).
Appropriate Amount of Active Risk and Sources of Alpha
The amount of active risk the liability-hedging portfolio should have depends on numerous considerations, primary among them being the plan’s funded status and the relative weight of the liability-hedging portfolio. Generally speaking, a poorly funded plan will put more emphasis on alpha generation (at the total portfolio level) as it has more to gain from asset outperformance and less to lose from funded status deterioration. Since, in this case, the growth portfolio is large and has more opportunity to generate alpha than the liability-hedging portfolio, managing funded status risk holistically implies that the liability-hedging portfolio should exhibit lower active risk.
On the other hand, a well-funded plan is much more focused on maintaining a strong funded status, and a small funded status decline would likely cause greater harm—both in terms of the balance sheet and behavioral considerations—than a small funded status increase. Consequently, the need for alpha generation at the total portfolio level is lower but not entirely eliminated as many plans, particularly those in hibernation, rely on the assets to add value over the liabilities to offset ongoing administrative expenses and adverse plan experience. Since at this point the assets are comprised mostly of the liability-hedging portfolio, one cannot rely on the growth portfolio alone, and so the liability-hedging portfolio may need to take on moderate active risk to generate the required value-add.
Fixed income managers can add value through overall duration positioning; yield curve management (overweight and underweighting certain different key rates relative to the benchmark); sector and security selection within credit; out-of-benchmark exposures (such as high-yield and emerging markets debt); derivative instrument selection; and trading. Since interest rates are by far the biggest drivers of changes in the present value of liabilities, and as hedging interest rate changes is the primary objective of the liability-hedging portfolio, we generally advocate for very limited exposure to managers who take material duration or yield-curve bets. While historically these bets may have contributed to a manager’s value-add, we do not believe taking material interest rate risk in a liability-hedging portfolio is justified. If a plan sponsor wishes to express an interest rate bet, it can be achieved by sizing the liability-hedging portfolio appropriately.
Within credit, however, ample opportunity exists to add value through a combination of sector rotation (e.g., consumer cyclicals versus non-cyclicals), issuer selection (e.g., Ford versus GM), and issue selection of a given issuer (e.g., 30-year GM bonds versus 20-year GM bonds). All of these approaches rely on top-down macro analysis and bottom-up credit research, with top-down more important for sector rotation and bottom-up research more important for issuer selection. Issue selection in long bonds is driven by market dynamics, such as existing and expected issuance at specific maturities, supply/ demand by market participants (which extends beyond pensions to life insurance companies and overseas buyers), and dealer inventory. While some managers emphasize their value-add through trading, we have not found trading to be the largest driver of manager value-add, even in the opaque fixed income market.
Finally, out-of-benchmark exposures also may provide an opportunity to add value, and may serve as diversifiers, potentially lowering the risk of the liability-hedging portfolio. However, since these segments of the markets stray away from the liability-hedging objective of the portfolio, care should be taken that they do not add excessively to active risk.
Manager Structure
When constructing the liability-hedging portfolio, we advocate a multi-manager structure that takes into account all of these considerations. For a poorly funded plan not using derivatives, the liability-hedging portfolio may consist of core positions in indexed Treasuries (or STRIPS) and, perhaps, a low tracking error, investment-grade credit manager, coupled with smaller positions in several high conviction, higher tracking error managers with low inter-manager correlations. The inclusion of derivatives may change portfolio construction somewhat, particularly with respect to the Treasuries exposure. In this portfolio, we would expect moderate alpha arising from sector rotation and security selection and, to a lesser degree, from out-of-benchmark exposures and, perhaps, yield curve plays. It is important to note that some issuer overlap among credit managers may occur—after all, they’re managing to the same benchmark—but their sizing, rationales, and entry and exit points are expected to be different.
For a well-funded plan focused primarily on liability hedging, we would typically employ a completion manager with a Treasury and credit mandate and several high conviction, low or modest tracking error credit managers with low inter-manager correlations. In most instances, the completion manager would be tasked with ensuring that the total liability-hedging portfolio duration and yield curve exposures (accounting for all managers in the liability-hedging portfolio) are matched to the liabilities. A completion manager will often use derivatives, in addition to physical bonds, to achieve this goal. As for the credit managers, while selected in part to provide different sources of alpha, the credit managers also are there to diversify manager risk—we would expect a somewhat higher correlation among these credit managers than those for a poorly funded plan. By design, this portfolio would have low alpha potential, with excess returns mainly coming from sector rotation and security selection.
Best Practice Conclusions
We have discussed a number of nuances and complexities related to both the asset and liability side of designing a true liability hedge. Articulating a coherent liability framework and revisiting it frequently will serve plans well in maintaining an effective liability hedge exposure. Below, we summarize what we believe are the most important considerations when developing the liability hedge framework:
- Understand and Define the Liability. Although multiple cash flow and discount rate methodologies exist in the pension space, for most plan sponsors, the projected benefit obligation or the estimated termination liability is the appropriate target liability to hedge.
- Quantify Acceptable Funded Status Risk. By evaluating enterprise-wide and plan-specific considerations, plan sponsors can determine the appropriate amount of funded status risk to undertake. This will in turn translate into the appropriate balance between the growth and liability-hedging portfolio weights, the target hedge ratio, and the risk within each of those portfolios.
- Take Into Account the Interaction of Credit and the Growth Portfolio. Credit exposure is typically highly correlated with equity exposure, and the formulation of a liability hedge should be adjusted continuously to ensure optimized risk and return when considering these two interrelated asset exposures.
- Emphasize Capital Efficiency. Underfunded plans need to allocate a large portion of their assets to the growth portfolio while achieving a high level of liability hedging. Using capital-efficient instruments such as long duration bonds (as opposed to a core-duration mandate), Treasury STRIPS, Treasury futures, and, potentially, swaps and swaptions can help achieve this goal.
- Avoid Over-precision. While closely matching liability characteristics is sensible for well-funded plans, poorly funded plans should focus on managing the lion’s share of liability risk (i.e., duration and spread risks). The additional complexity associated with hedging curve risk may be marginal at low funded status, while the asset management cost may be relatively high.
- Use a Complete Toolkit. Despite their complexities, fixed income derivatives can be extremely beneficial to plan sponsors as they enable duration extension and curve-matching with little capital and high liquidity. Furthermore, plan sponsors should have reasonable objectives and expectations for the alpha potential of the liability-hedging portfolio, particularly in light of a plan’s funded status and the alpha potential of the growth portfolio.
Index Disclosures
Bloomberg Barclays US Aggregate Bond Index
The Bloomberg Barclays US Aggregate Bond index is market capitalization–weighted and includes Treasury securities, government agency bonds, mortgage-backed bonds, and corporate bonds. It excludes municipal bonds and Treasury Inflation-Protected Securities because of tax treatment.
Bloomberg Barclays US Long Government/Credit Index
The Barclays US Long Government/Credit Index tracks the market for investment grade, US$-denominated, fixed-rate Treasuries, government-related, and corporate securities that have a remaining maturity of greater than or equal to ten years.
Bloomberg Barclays US Long Credit Index
The Bloomberg Barclays US Long Credit Index represents long-term corporate bonds. It measures the performance of the long-term sector of the United States investment-bond market, which, as defined by the Long Credit Index, includes investment-grade corporate debt and sovereign, supranational, local-authority, and non-US Agency bonds that are dollar denominated and have a remaining maturity of greater than or equal to ten years.
Bloomberg Barclays US Long Treasury Index
The Bloomberg Barclays US Treasury Index measures US$-denominated, fixed-rate, nominal debt issued by the US Treasury that have a remaining maturity of greater than or equal to ten years.
Citigroup Pension Liability Index
The Citigroup Pension Liability Index represents the single discount rate that would produce the same present value as calculated by discounting a standardized set of liabilities using the Citi Pension Discount Curve. The index also provides an investment performance benchmark for asset-liability management.
Footnotes
- Even for plans that don’t follow a glidepath—whether because the plan is poorly funded, open and accruing, simply too small relative to the plan sponsor’s balance sheet, or for other reasons—thoughtful liability-hedging portfolio construction still is crucial.
- These interactions are explored further in the “Liability-Hedging Construction” and “Alpha Considerations” sections of this paper.
- Liability (or asset) duration is the expected percent increase (or decrease) in the liability present value (or asset market value) given an instantaneous 1% downward (upward) shift in the US Treasury yield curve. Credit spread duration is defined similarly, assuming a change in credit spreads.
- The corporate Aa universe has exhibited elevated issuer concentration since the Global Financial Crisis.
- As the demand for liability-hedging strategies has grown, other fixed income derivatives have been developed, including zero-coupon swaps and total return swaps on specific Treasury bonds or STRIPS. The former enables plan sponsors to gain duration even more efficiently than traditional interest rate swaps, while the latter provides exposures to specific, potentially nonstandard maturity points (e.g., 17 years rather than 10 or 30) to more closely hedge liability exposures. While these over-the-counter derivatives are not as commonly used as the three types we describe above, their usage may grow.
Ming Yan - Ming Yan is a Managing Director at Cambridge Associates, a global investment firm.
About Cambridge Associates
Cambridge Associates is a global investment firm with 50+ years of institutional investing experience. The firm aims to help pension plans, endowments & foundations, healthcare systems, and private clients achieve their investment goals and maximize their impact on the world. Cambridge Associates delivers a range of services, including outsourced CIO, non-discretionary portfolio management, staff extension and alternative asset class mandates. Contact us today.