Don’t Forget the Credit Spread!

While corporate plan sponsors are keenly aware of interest rate risk within their defined benefit plans, few fully appreciate the complex and significant risk posed by credit spreads
- For US corporate pension plans, credit spreads are a substantial component of liability valuation and an increasingly material driver of pension funded status risk.
- Like interest rate risk, credit spread risk can be hedged with fixed income, but doing so is more challenging and less precise, due to the dynamic nature of the credit universe, the volatility of credit spreads, and the high quality of the liability discount rate.
- Effectively managing credit spread risk requires an active approach that takes into account the high correlation between credit spreads and growth assets and the relative size and “riskiness” of the growth portfolio.
- In a de-risking glide path, as the growth portfolio becomes relatively smaller and more conservative, credit exposure within the liability-hedging portfolio should increase and become more closely aligned with that of the liability.
Most sponsors of corporate defined benefit plans are well aware of how interest rate changes can impact plan funded status and corporate balance sheets, and pay close attention to hedging this risk. Yet this focus on interest rate risk often overshadows credit spread risk, which has become more elevated in recent years. This is particularly true as interest rates have remained extremely low, spreads have been volatile, and the thirst for yield has only risen. Still, many plan sponsors do not fully take into account this critical determinant of pension fund status and de-risking strategy effectiveness. In this research note, we explore the nature of credit risk for US corporate pensions, 1 the challenges of hedging it effectively, and the interaction between credit spread hedging and the growth portfolio.
Credit Spreads Matter
As a reminder, under US accounting standards, corporate pension liabilities are discounted using yields on high-quality corporate bonds, specifically Aa-rated bonds, matched to the term structure of the liabilities. Since corporate bond yields are a combination of Treasury yields and corporate, or credit, spreads, 2 plan sponsors are exposed to both interest rate risk (i.e., the Treasury component of the discount rate) and credit spread risk (i.e., the difference between the corporate bond yield and a comparable-maturity Treasury yield).
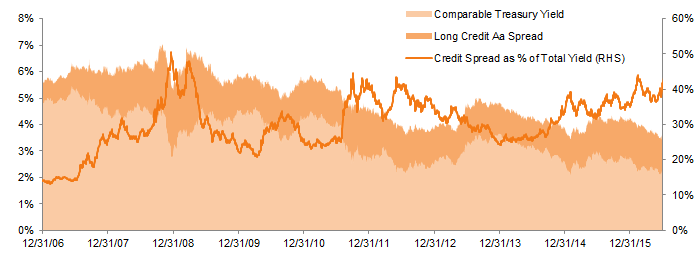
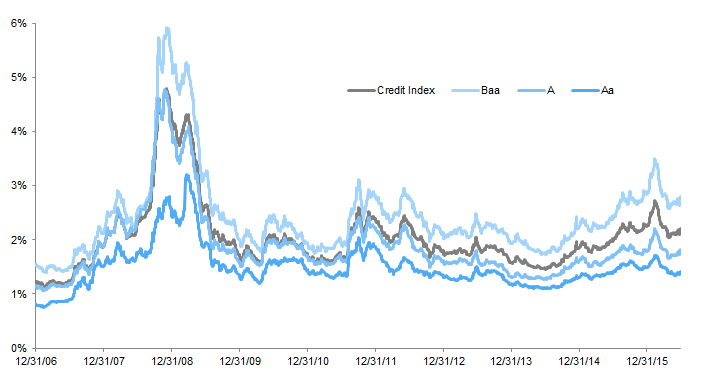
Mitigating interest rate risk typically involves some combination of lengthening fixed income portfolio duration and increasing the fixed income allocation so that asset interest rate risk more closely matches liability interest rate risk. Mitigating credit spread risk is more complex, yet plan sponsors very often overlook the nuances involved. Instead they may follow a more simplistic path by selecting one of three options: a diversified long duration, 100% Treasury, or 100% credit mandate. While any of these simple options may be a reasonable first step, they should be complemented by additional steps that constitute a more refined approach to hedging credit spread risk. This is particularly important as credit spread risk is becoming more significant: long Aa spreads (as encapsulated by the Aa portion of the Barclays US Long Credit Index 3 ) have become an even larger portion of the overall long Aa yield, from 12% to 15% before the 2008–09 global financial crisis to between 30% and 40% in recent years (Figure 1).
Figure 1. Decomposition of the Yield of the Barclays US Long Credit Aa Index into the Comparable Treasury Yield and Credit Spread
December 31, 2006 – June 30, 2016 • Rolling 36-Month Observations
Source: Barclays.
Notes: Data are daily.
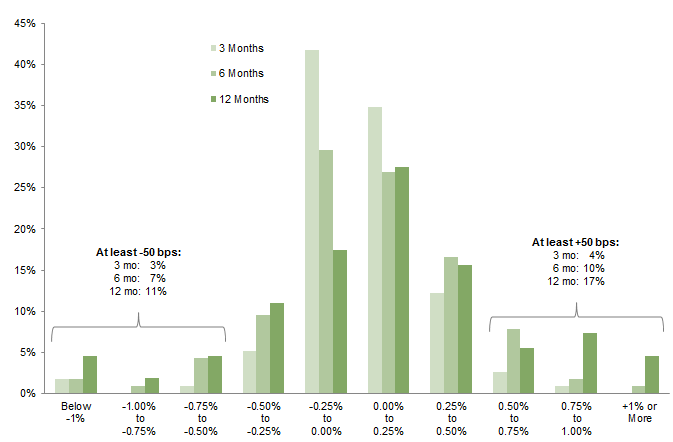
Over this time, Aa spreads have been quite volatile. Since December 31, 2006, they have moved by more than 50 basis points (bps) in 28% of all 12-month periods, and in 17% of all six-month periods (Figure 2). For typical plan liability durations of eight to 16 years, a 50 bp change in spreads translates to a liability present value change of roughly 4% to 8%. For a $500 million plan, this could impact the corporate balance sheet by tens of millions of dollars, and could impact pension expense by as much as
$10 million.
Figure 2. Frequency of Spread Changes in the Barclays US Long Credit Aa Index Over Select Time Intervals
December 31, 2006 – June 30, 2016
Source: Barclays.
Thus, credit spread changes represent a material pension risk and, after interest rate risk, mitigating this risk should be of paramount importance.
There Is No Perfect Hedge
Theoretically, a “perfect hedge” against credit spread risk would be a portfolio of Aa-rated corporate bonds matched to the duration and term structure of a pension’s liabilities. In reality, however, the Aa universe is so limited and concentrated that investing in a 100% Aa-rated portfolio is both impractical and risky.
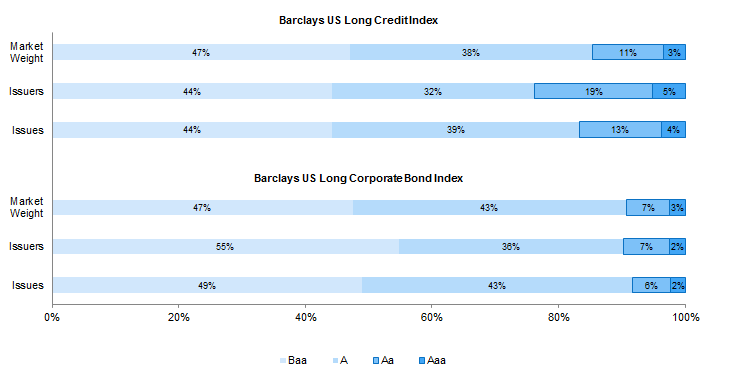
Both the Aaa and Aa long credit spaces are very small (Figure 3). Together they make up, at most, a quarter of the overall long credit universe. Conversely, the A and Baa long credit spaces each compose one-third to one-half of the entire long credit universe and include many recognizable blue chip names. Compounding the investing challenge, the investible Aa universe is even smaller than the indexes would suggest, as the indexes include many small and potentially illiquid non-corporate issuers. These include municipalities that issue taxable munis, sovereigns that issue dollar-denominated debt, and colleges and universities that issue debt only occasionally, among others.
Figure 3. Composition of Barclays US Long Credit Index and US Long Corporate Bond Index by Quality
As of June 30, 2016
Source: Barclays.
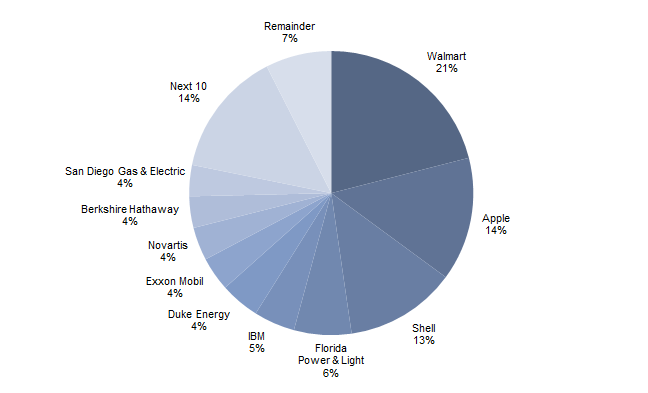
Indeed, as of June 30, 2016, fewer than 25 corporations are issuing Aa-rated bonds with more than ten years to maturity. Given this fact and the concentrated composition of the long Aa universe (Figure 4), investing solely within this universe leads to highly concentrated portfolios with excessive issuer-specific risk. Expanding the universe to non-corporate names helps alleviate some of this concentration risk (particularly as many municipalities are rated Aa), but this also introduces increased liquidity risk and, in the case of sovereigns, country risk.
Figure 4. Composition of the Barclays Long Corporate Aa Bond Index
As of June 30, 2016
Source: Barclays.
Note: The index selects bonds based on the rating of the bond, and not that of the issuer; issuers shown on this chart may not be rated Aa, but if their bonds are, they are eligible for inclusion.
Liability-hedging strategies heavily concentrated in the Aa space also risk a downgrade headwind. In particular, when a bond rated Aa is downgraded, the overall Aa composite average yield can be expected to decline when this bond is removed from the index, as the downgraded bond presumably was more risky and therefore had a higher yield ahead of the downgrade. Consequently, the downgrade contributes positively to the liability return. On the other hand, if the bond is still held in the portfolio or is sold after the downgrade, the downgrade contributes negatively to the portfolio return. Because the Aa space is so thin, a single downgrade can have a material impact on the effectiveness of the hedge.
100% Credit Is Not the Answer
Even though pension liabilities are valued using 100% Aa yields, plan sponsors are well served by investing across the entire investment grade universe, balancing A- and Baa-rated credits with Treasuries to diversify their holdings and manage risk relative to the liabilities. Yet some investors embrace 100% credit strategies for the yield they offer and for their relatively high correlation to Aa yields.
Figure 5 reveals three general observations about 100% credit strategies:
- The level of spreads tends to increase as quality decreases, with the overall long credit spread resting between the spreads of the A-rated and Baa-rated components;
- Spread volatility generally increases as quality decreases; and
- Credit spreads appear to be highly correlated across quality buckets.
Figure 5. Credit Spreads of the Barclays US Long Credit Index by Quality
December 31, 2006 – June 30, 2016
Source: Barclays.
Notes: Data are daily.
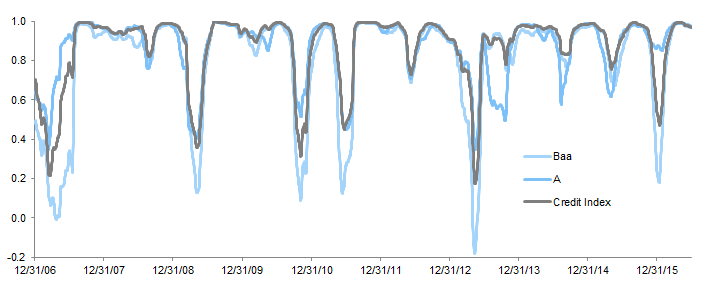
The first two observations certainly make sense: investors should demand higher yield for lower-quality assets and, in turn, lower-quality and higher-yielding assets typically have higher volatility. Since December 31, 2006, overall long credit spreads have been 36% higher than Aa credit spreads, while exhibiting (100-day) volatility that has been on average 51% higher. Looking further into correlations between credit spreads, despite strong long-term correlations, short-term correlations between overall credit spreads and Aa credit spreads have fallen to as low as 0.2–0.5 in some time periods (Figure 6). These dislocations in correlations appear to be driven by industry composition differences within quality buckets, frequency of downgrades, and sharper spread moves within the Baa universe compared to the Aa universe.
Figure 6. Rolling 100-Day Correlation to Barclays US Long Credit Aa Index Spreads
December 31, 2006 – June 30, 2016
Source: Barclays.
These observations suggest that, on its own, a duration-matched portfolio composed entirely of credit (and reflecting the quality composition of the Barclays US Long Credit Index or overweight A-rated or Baa-rated credit) is likely to have a moderately high tracking error to the liabilities, which are valued with Aa yields. While such a portfolio is likely to out-yield the liabilities, it also is likely to be significantly more risky.
Moreover, the impact of spread changes can extend well beyond the liability-hedging portfolio. A 100% credit portfolio will likely be highly correlated to growth assets, increasing the total portfolio’s tracking error to the liabilities. This is one of the main reasons that liability-hedging portfolios include—or should include!—government bonds, particularly Treasuries, in addition to credit.
Another reason to include Treasuries is the ability to extend portfolio duration and manage yield curve exposure with greater liquidity and lower transaction costs relative to credit. Portfolio duration extension is vital for pensions with very long durations, such as many open plans. Just as the Aa universe is highly limited, so is the universe of all corporate bonds with durations of more than 16 years. Thus, a diversified, duration-matched, liability-hedging portfolio with duration exceeding 16 years by necessity must contain Treasuries or derivatives. Efficient yield curve management is particularly important for plans with highly customized liability-hedging allocations, such as well-funded plans on the path to termination or hibernation. In this case, precise yield curve matching is necessary to minimize the tracking error to the liabilities.
Active Management Is Key
How do you measure spread risk? For interest rate risk, a simple and effective measure of the extent to which a fixed income portfolio hedges liability interest rate risk is the interest hedge ratio (or often just the hedge ratio, though for clarity in this paper we will use the full name). This is defined as the ratio of asset dollar duration to liability dollar duration or, similarly, the ratio of asset DV01 (dollar value of a basis point) to the liability DV01. 4 Given the varied nature of credit, as discussed in the previous section, an analogous measure of credit spread hedging is the beta-adjusted credit spread hedge ratio (or simply spread hedge ratio). This ratio takes into account the credit quality composition of the portfolio and the varying risk characteristics of different quality segments, in addition to the market weight and duration of the overall credit exposure.
A bond’s spread beta is a measure of its spread volatility relative to that of a comparable maturity Aa-rated bond. 5 The higher the spread beta, the higher the risk relative to the Aa-rated bond due to changes in the Aa spread; at the portfolio level, the higher the beta, the higher the portfolio spread risk relative to liability spread risk.
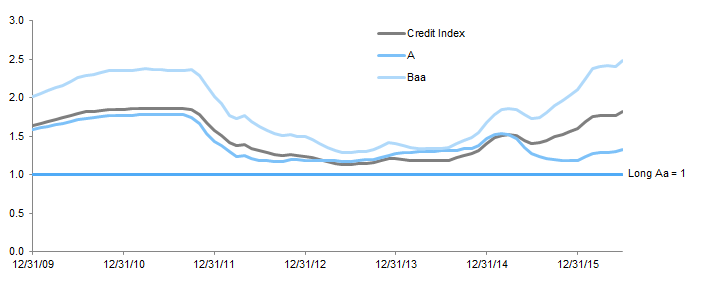
Spread betas vary over time and across quality buckets, sometimes being quite stable and relatively close to each other and sometimes being quite a bit more varied (Figure 7). Unlike the interest hedge ratio, which is relatively constant, the spread hedge ratio can vary significantly, even if the overall asset allocation, liability structure, and liability-hedging portfolio composition remain unchanged.
Figure 7. Spread Beta Relative to Barclays US Long Credit Aa Index
December 31, 2009 – June 30, 2016 • Rolling 36-Month Observations
Source: Barclays.
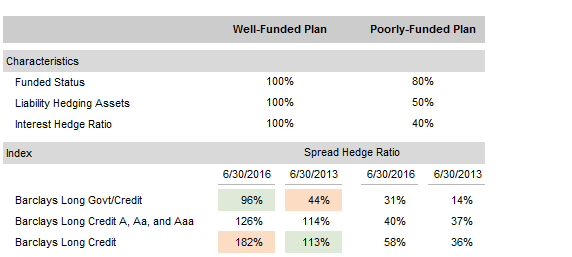
Consider a plan that is 100% funded and has a duration of 14.0 years. As of June 30, 2016, the Barclays Long Government/Credit Index would well match the portfolio, with an interest hedge ratio of 100% and a spread hedge ratio of 96% (Figure 8). Yet just three years ago, such a strategy was a much poorer match, with a spread hedge ratio of only 44%. The strategy with the best match three years ago, Barclays Long Credit, would be ill-matched today. This simple example illustrates how widely spread hedge ratios can vary over time. As expected, the impact of spread beta changes is greater for a well-funded plan with a high liability-hedging allocation than for a poorly funded plan.
Figure 8. Sample Plan (Beta-Adjusted) Credit Spread Hedge Ratios
Assuming Duration-Matched Strategies
Source: Cambridge Associates LLC.
Thus, for well-funded plans with customized hedging strategies, maintaining a constant spread hedge ratio requires active management of the portfolio’s allocation, both to credit (vs other fixed income market segments) and within credit (by sector, quality, and issuer). This is critical to ensure that the spread hedge ratio stays at the desired level. For market-based hedging portfolios, the same objective is accomplished by dynamically adjusting the underlying fixed income allocation, either by physically transferring assets among credit and Treasury managers or by employing derivatives. Doing so requires distinct Treasury and credit mandates, as opposed to a government/credit mandate.
The Growth Portfolio Complicates Matters
While often viewed solely in the context of liability hedging, spread exposure also should be considered in light of a pension’s total portfolio. Correlations of long credit spreads to equities (whether global or US) have been quite high, often staying above 0.7–0.8 for extended periods as measured on a rolling three-year (36-month) basis; correlations to alternative investments such as hedge funds and commodities are not far behind (Figure 9). Private equity, due to the quarterly nature of its reported data, is not included in this illustration. However, on a rolling quarterly five-year basis, private equity paints a similar picture.
Figure 9. Correlation of Monthly Growth Asset Returns to the Monthly Change in the Barclays US Long Credit Spread
December 31, 2009 – June 30, 2016 • Rolling 36-Month Observations • USD Terms
Sources: Barclays, Cambridge Associates LLC, Hedge Fund Research Inc., MSCI Inc., and Standard & Poor’s. MSCI data provided “as is” without any express or implied warranties.
Note: MSCI ACWI represents net total return series.
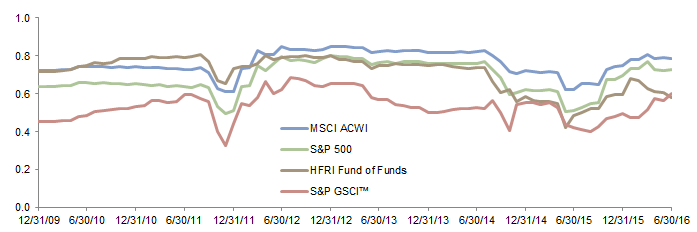
These spread correlations are reflected in total return correlations—rolling three-year correlations of the MSCI All Country World Index to the Barclays US Long Credit Index are consistently about 0.3 higher than correlations to the Barclays Long Government/Credit Index (Figure 10). Similar correlation differences exist for hedge funds and private equity.
Figure 10. Total Return Correlations to MSCI ACWI Index
December 31, 2009 – June 30, 2016 • Rolling 36-Month Observations • USD Terms
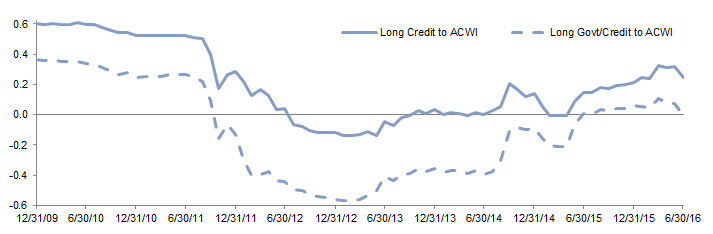
Sources: Barclays and MSCI Inc. MSCI data provided “as is” without any express or implied warranties.
Note: MSCI ACWI represents net total return series.
In other words, while the growth portfolio may have low—or even negative—correlations to liability interest rate risk, it is implicitly hedging some of the liability credit spread risk, which is not captured in the spread hedge ratio. This interaction suggests that credit exposure within the liability-hedging portfolio should be lower when the allocation to growth assets is larger and, conversely, higher when the growth allocation is smaller.
This interaction effect is captured in the tracking error to liabilities (i.e., the volatility of excess total portfolio returns over liability returns). By design, tracking error for underfunded or open plans with large allocations to growth assets is driven largely by the growth portfolio. The inclusion of any credit exposure at the expense of Treasuries in the liability-hedging portfolio typically further increases tracking error. Figure 11 illustrates the tracking error to liabilities for a poorly-funded sample plan (a description of this sample plan and the details of our calculations are provided in the Appendix), assuming six different allocations to credit and Treasuries.
Figure 11. Rolling 36-Month Tracking Error of Varying Credit Exposures for a Poorly-Funded Sample Plan
December 31, 2012 – June 30, 2016
Sources: Barclays, Cambridge Associates LLC, Citigroup Global Markets, Hedge Fund Research, Inc, and MSCI. MSCI data provided “as is” without any express or implied warranties.
Notes: MSCI ACWI represents net total return series. All calculations are based on monthly rebalancing and observations.
Relative to the contribution to the tracking error from the growth portfolio, however, the contribution from credit is relatively small. While it may be tempting to reduce tracking error by lowering credit exposure to 0% (and raising Treasury exposure to 100%), such a drastic move would result in a liability-hedging portfolio that significantly under-yields the liabilities and an asset allocation that is less likely to succeed in closing the asset-liability gap.
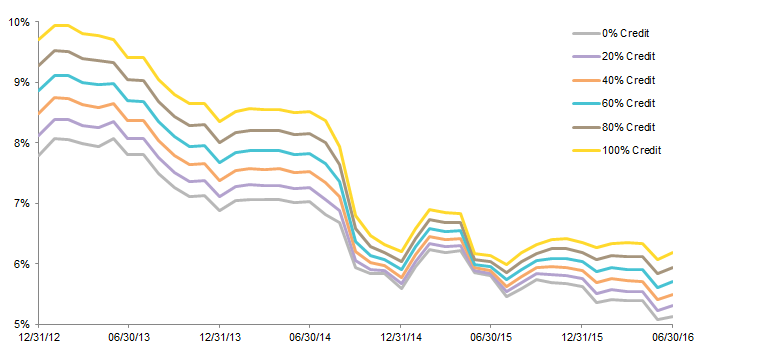
On the other hand, well-funded plans with a small, low-risk growth portfolio can more evenly balance the tracking error between the liability-hedging and growth portfolios. The specific optimal allocation to credit depends on the structure of the liabilities, the plan sponsor’s risk tolerance, and current credit market conditions, and may often settle in the 40% to 70% range. Figure 12 illustrates this point for a well-funded sample plan (see Appendix for details), again assuming six different allocations to credit and Treasuries. The optimal allocation varies over time, consistent with prior observations about the variability of spread beta and correlation to growth assets.
Figure 12. Rolling 36-Month Tracking Error of Varying Credit Exposures for a Well-Funded Sample Plan
December 31, 2012 – June 30, 2016

Sources: Barclays, Cambridge Associates LLC, Citigroup Global Markets, Hedge Fund Research, Inc, and MSCI. MSCI data provided “as is” without any express or implied warranties.
Notes: MSCI ACWI represents net total return series. All calculations are based on monthly rebalancing and observations.
Conclusion
Although often overlooked in the current interest rate environment, credit spread risk can significantly impact pension plan liabilities and assets and, consequently, funded status, contributions, and pension expense.
Effectively hedging credit spreads within the liability-hedging portfolio requires that the portfolio not only have the same interest rate risk exposure as the liabilities, but also the same spread exposure. Because liabilities are typically valued using Aa yields and the Aa credit universe is relatively small, portfolio construction must take into account the level and variation of spreads across different quality buckets, not simply mimic the overall credit universe. Indeed, depending on credit conditions, liability-hedging portfolios often should have moderate—and at times significant—allocations to government bonds, in addition to credit.
Viewed in the context of the total portfolio, spread risk is highly correlated to growth portfolio risk, meaning that the growth portfolio “hedges” a portion of the liability spread risk. When growth portfolio allocations are high, the liability-hedging portfolio generally should have less credit exposure. As the asset allocation is de-risked and the growth portfolio becomes smaller and less risky, the credit allocation within the liability-hedging portfolio can increase. This interaction effect can be built into a plan’s de-risking glide path, thus maintaining appropriate tracking error at every step. However, any reduction in credit exposure should be considered relative to the liability yield and discount rate.
Appendix: A Deeper Look Into Tracking Error Decomposition
Consider a plan with a liability profile that follows that of the Citigroup Pension Liability Index – Short Duration and has a duration of 12.8 years (as of June 30, 2016). Suppose the plan is poorly funded (funded status ratio of 60%) and has an asset allocation of 40% to global equities with a beta of 0.8 to MSCI ACWI; 20% to hedge funds (proxied by HFRI Funds of Funds); and 40% to a duration-matched liability-hedging portfolio. The liability-hedging portfolio can be allocated to any blend of credit (proxied by a duration-matched blend of Barclays Long and Intermediate Credit Indexes) and Treasuries (proxied by a duration-matched blend of Barclays Long and Intermediate Treasury Indexes).
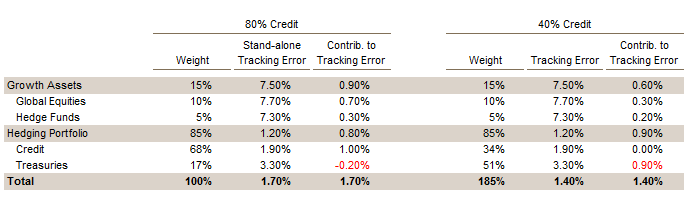
Figure 11 showed rolling three-year tracking error to the liabilities for this sample plan, assuming six different allocations to credit and Treasuries. The tracking error clearly increased as credit exposure increased. Yet decomposing the tracking error for the 40% and 80% credit allocations illustrates that the growth portfolio is by far the largest driver of the tracking error, that credit is a smaller contributor, and, given the large growth allocation, that Treasuries act as a diversifier.
Poorly-Funded Sample Plan: Tracking Error Attribution Over Three Years
As of June 30, 2016
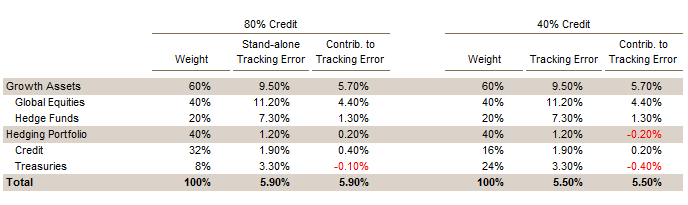
For this poorly funded sample plan, reducing credit exposure from 80% to 40% within the liability-hedging portfolio reduces the yield by 90 bps, placing it somewhat below liability yield. However, the impact on total portfolio return may well be justified given the moderate 40% allocation to the liability-hedging portfolio, presumably higher expected return from the growth portfolio, and the reduction in tracking error.
Now, suppose the plan has the same liability profile and duration but is well funded (funded status of 95%) and the asset allocation is 10% global equities with a beta of 0.4 to MSCI ACWI; 5% hedge funds (proxied by HFRI Funds of Funds); and 85% duration-matched liability-hedging fixed income. In this case, as was shown in Figure 12, the optimal allocation to credit is between 40% and 60% of the liability-hedging allocation.
A similar tracking error attribution exercise shows that for this sample plan tracking error is much more evenly distributed between growth assets and liability-hedging assets but Treasuries still have an important role in the portfolio. In this case, moving from an 80% allocation to credit to 40% reduces the yield of the liability-hedging portfolio by the same 90 bps. However, because the liability-hedging portfolio composes 85% of total assets, the reduction in expected return is much more material, especially compared to the expected liability return. In the case of this well-funded sample plan, a slightly higher allocation to credit may be more prudent.
Well-Funded Sample Plan: Tracking Error Attribution Over Three Years
As of June 30, 2016
Index Disclosures
Broad-based securities indexes are unmanaged and are not subject to fees and expenses typically associated with managed accounts or investment funds. Investments cannot be made directly in an index. Past performance is no guarantee of future results.
Barclays US Intermediate Credit Index
The Barclays US Long Credit Index measures the investment-grade, USD-denominated, fixed-rate, taxable corporate and government-related bond markets, and includes all issues with at least one but less than ten years to maturity. It is composed of the US Corporate Index and a non-corporate component that includes non-US agencies, sovereigns, supranationals, and local authorities.
Barclays US Intermediate Treasury Index
The Barclays US Intermediate Treasury Index measures the investment-grade, USD-denominated, fixed-rate, nominal debt issued by the US Treasury, and includes all issues having at least one but less than ten years to maturity.
Barclays US Long Corporate Bond Index
The Barclays US Long Corporate Bond Index measures the investment-grade, fixed-rate, taxable corporate bond market of all issues with greater than or equal to ten years to maturity. It includes USD-denominated securities publicly issued by US and non-US industrial, utility, and financial issuers. The US Corporate Index is a component of the US Credit and US Aggregate indexes.
Barclays US Long Credit Index
The Barclays US Long Credit Index measures the investment-grade, USD-denominated, fixed-rate, taxable corporate and government-related bond markets, and includes all issues with greater than or equal to ten years to maturity. It is composed of the US Corporate Index and a non-corporate component that includes non-US agencies, sovereigns, supranationals, and local authorities.
Barclays US Long Government/Credit Bond Index
The Barclays US Long Government/Credit Bond Index is a broad-based flagship benchmark that measures the non-securitized component of the US Aggregate Index. It includes investment-grade, US dollar-denominated, fixed-rate Treasuries, as well as government-related and corporate securities, with all issues having greater than or equal to ten years to maturity.
Barclays US Long Treasury Index
The Barclays US Long Treasury Index measures the investment-grade, USD-denominated, fixed-rate, nominal debt issued by the US Treasury, and includes all issues with greater than or equal to ten years to maturity.
Citi Pension Liability Index – Short Duration
The Citi Pension Liability Index (CPLI) reflects the discount rate that can be used to value liabilities for GAAP reporting purposes. The index also provides an investment performance benchmark for asset-liability management. The short-duration CPLI is comparable to a fully-closed plan, with a weighted average life of 16.8 years.
HFRI Fund of Funds Composite Index
The HFRI Fund of Funds Composite is an equal-weighted index of over 400 funds of funds that report returns net of all fees and in US dollars, with at least $50 million assets under management or have been actively trading for 12 months.
MSCI All Country World Index
The MSCI ACWI Index is a free float-adjusted market capitalization weighted index that is designed to measure the equity market performance of developed and emerging markets. It consists of 46 country indexes comprising 23 developed and 23 emerging markets country indexes. The developed markets country indexes included are: Australia, Austria, Belgium, Canada, Denmark, Finland, France, Germany, Hong Kong, Ireland, Israel, Italy, Japan, the Netherlands, New Zealand, Norway, Portugal, Singapore, Spain, Sweden, Switzerland, the United Kingdom, and the United States. The emerging markets country indexes included are: Brazil, Chile, China, Colombia, Czech Republic, Egypt, Greece, Hungary, India, Indonesia, Korea, Malaysia, Mexico, Peru, the Philippines, Poland, Qatar, Russia, South Africa, Taiwan, Thailand, Turkey, and the United Arab Emirates.
S&P 500 Composite Stock Price Index
The S&P 500 Composite Stock Price Index is a capitalization-weighted index of 500 stocks intended to be a representative sample of leading companies in leading industries within the US economy. Stocks in the index are chosen for market size, liquidity, and industry group representation.
S&P GSCI™ Index
The S&P GSCI™ Index is designed as a benchmark for investment in the commodity markets and as a measure of commodity market performance over time. The index is calculated primarily on a world production-weighted basis and comprises the principal physical commodities that are the subject of active, liquid futures markets. There is no limit on the number of contracts that may be included in the S&P GSCI™ Index; any contract that satisfies the eligibility criteria and the other conditions specified in this methodology are included.
Footnotes
- While pension accounting standards across major global pension markets are often similar, credit spread hedging is particularly salient in the United States due to the relatively large size of the US corporate bond market and widespread use of corporate bonds in liability hedging strategies. For instance, in the United Kingdom and, to a lesser extent, in Canada, corporate bond markets are relatively thin and liability hedging strategies primarily employ sovereign (and, in the case of Canada, provincial) bonds; therefore, credit spread risk is a lesser concern.
- Credit spreads reflect the risk associated with a given bond’s issuer, including default risk, downgrade risk, and any embedded call or put options.
- The Barclays Long Credit Index consists of corporate and non-corporate bonds (such as taxable municipal bonds and sovereign bonds denominated in US dollars) that are rated investment grade and have at least ten years to maturity. As of June 30, 2016, the duration of the index is approximately 14.0 years. Typical pension liabilities have a duration of 8-16 years.
- Dollar duration is the expected dollar increase (or decrease) in the price of a bond, the market value of a fixed income portfolio, or the present value of liabilities if the entire Treasury yield curve shifts down (or up) 1% instantaneously; DV01, or dollar value of one basis point, is the same measure for a 1 basis point shift in the Treasury yield curve. The interest hedge ratio does not take into account any key rate mismatches along the maturity spectrum and is therefore a good measure of interest rate risk hedging only with respect to parallel yield curve shifts.
- In non-pension contexts, the beta is often computed relative to the overall credit index, rather than the Aa portion thereof. Analogous to dollar duration, beta-adjusted dollar spread duration is the expected dollar change in the price of a bond, the market value of a fixed income portfolio, or the present value of liabilities if Aa credit spreads change by 1% instantaneously; SDV01 is the same measure for a 1 basis point change in Aa spreads.
About Cambridge Associates
Cambridge Associates is a global investment firm with 50+ years of institutional investing experience. The firm aims to help pension plans, endowments & foundations, healthcare systems, and private clients achieve their investment goals and maximize their impact on the world. Cambridge Associates delivers a range of services, including outsourced CIO, non-discretionary portfolio management, staff extension and alternative asset class mandates. Contact us today.