Credit Spreads Take Pensions for a Wild Ride

As the COVID-19 outbreak has escalated in the United States, sponsors of single employer–defined benefit pension plans have experienced a roller coaster ride … but not only on the asset side! Accounting liabilities experienced enormous variation, as well, thanks to sharp movements in the corporate bond yields used to value them. Although underlying Treasury yields contributed to this volatility, especially in early March, the acute movements in credit spreads were the bigger driver. With fluctuations of a scale not seen since the global financial crisis (GFC), liability presents values often changed by several percentage points in a single day.
This volatility is a stark reminder that managing pension risk requires hedging both interest-rate and credit-spread risk. Since equity and bond markets are likely to remain volatile, plan sponsors should reassess the credit component of the liability-hedging portfolio. Specifically, they should:
- Size the credit component appropriately relative to the Aa nature of the liability discount rate and the size and “riskiness” (i.e., spread correlation) of the growth portfolio;
- Employ active management strategies, aiming to avoid downgrades and defaults as well as seize opportunities, given the disparate impacts of the COVID-19 pandemic on different market segments; and
- Potentially overweight credit relative to Treasuries as credit spreads remain high, while keeping the overall interest-rate hedge ratio within tolerance ranges and considering transaction costs.
Avoiding, or at least cushioning, another roller coaster ride requires a well-designed hedging strategy that accounts for credit spreads. This paper provides both contextual background on this rapidly evolving spread environment and potential responses.
What Happened?
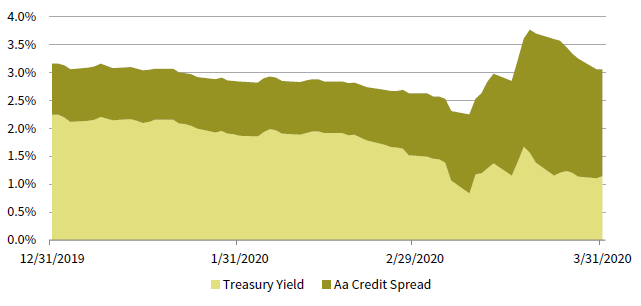
On the whole, liability discount rates experienced a gradual decline through early March, a sharp rise through the last week of March, and a decline after that. Looking under the hood, the initial decline in discount rates was driven by falling Treasury yields but relatively stable Aa credit spreads, as measured by the Bloomberg Barclays Long Credit Aa Index.
However, in the first three weeks of March, credit spreads widened tremendously, exceeding the decline in Treasury yields and pushing liability discount rates to above their year-end 2019 levels. A typical plan’s liability, for instance, might have been up 15% for the year through March 9, only to revert to its initial level toward the end of the month 1 (Figure 1).
FIGURE 1 LONG Aa CREDIT YIELDS
December 31, 2019 – March 31, 2020
Source: Bloomberg LP.
As expected, on the asset side, credit spread widening has been more extreme in the broader market and even more so in the Baa-rated space (which comprises nearly 50% of the long investment-grade universe) than the Aa space (Figure 2). As measured by the Bloomberg Barclays Long Credit Indexes, this resulted in the overall long investment-grade universe and long Baa’s underperforming the long Aa’s by 4.2% and 7.6%, respectively, in March.
FIGURE 2 YEAR-TO-DATE CREDIT SPREAD CHANGE
December 31, 2019 – March 31, 2020 • Percent (%)

Source: Bloomberg LP.
For most, this development was actually good news. Since the majority of plan sponsors do not fully hedge liability credit-spread risk, widening spreads reduced the asset/liability deficit as the dollar impact on the assets, while still negative, was smaller than on the liabilities. That said, plan sponsors with higher allocations to Treasuries generally fared better than those who were invested primarily in long credit.
Where Do We Go From Here?
In this extraordinarily complex investment environment, plan sponsors should re-evaluate their pension investment strategy in light of the new market environment and their specific enterprise risk management framework. This approach includes, in particular, revisiting interest-rate hedging objectives and target interest-rate hedge ratios. At the same time, plan sponsors can take constructive actions in regard to credit spreads.
In all cases, the size of the growth portfolio and its correlation to changes in credit spreads should also affect the size of the credit component. Historically, long credit returns attributable to spread changes have a beta of 0.3 and correlation of 0.7 to global equities; 2 that is, the growth portfolio is also implicitly hedging the credit spread of the liability. Thus, achieving a certain level of credit spread hedging requires less exposure to credit if the growth portfolio is large and more exposure to credit if the growth portfolio is small.
Treasury/Credit Mix. Because the credit risk of the overall investment-grade fixed income universe is higher than that of the liability discount rate, matching liability credit spread risk require the liability-hedging portfolio to have a healthy allocation to Treasuries. Plan sponsors invested primarily or entirely in long credit may be hesitant to lower the yield in their liability-hedging portfolio. In these instances, given the uncertain trajectory of credit spreads from here, we advocate only a modest tactical overweight to credit. On the other hand, for plan sponsors with low allocations to credit, now is a good time to add to credit, increase the yield of the portfolio, and reduce the asset/liability risk should spreads decline.
Active Management. Corporate bond downgrades and defaults are a constant headwind to liability hedging since they adversely affect assets but not liabilities. This is more important than ever in the current environment as more issuers are approaching junk category. Active management is critical to managing or avoiding potential downgrades and defaults, at times even presenting opportunities to take advantage of mispricings associated with “fallen angels.”
Just as with credit quality, March’s spread widening was not uniform across sectors. Some, such as oil field services, widened by more than 300 basis points (bps), while the spread for others, such as pharmaceuticals, grew by less than 100 bps. Within each sector, issuers are further differentiated by other factors such as the strength of their balance sheets, the resiliency of their businesses, and the abilities of their management teams. This dispersion among sectors and issuers creates opportunities for active managers to outperform the overall market and particularly the Aa nature of the liability discount rate. This can add much needed value to many bruised portfolios.
Tactical Management. Finally, though long credit spreads have declined since their March 23 high of 358 bps, current month-end spreads of 279 bps are still the highest they have been since the GFC, when they reached 480 bps (Figure 3). Thus, while the trajectory of credit spreads remains uncertain, a modest tactical overweight to credit relative to Treasuries likely makes sense from a pure valuation perspective. With even larger dislocations in other credit markets, modest additions to higher tracking-error strategies that may invest tactically outside the traditional investment-grade corporate universe may also be additive.
FIGURE 3 LONG CREDIT SPREADS: WEEKLY OBSERVATIONS
March 31, 2000 – March 31, 2020 • Percent (%)

Source: Bloomberg LP.
Given still-uncertain flows in the credit markets as well as heightened transaction costs, plan sponsors should be patient and seek best execution for this overweight. This may mean executing over the course of several transactions, transferring Treasury securities in kind (if applicable), potentially changing vehicles (commingled funds versus separately managed accounts), and using derivatives to manage the overall interest-rate hedge ratio.
Conclusion
While interest rate hedging is top of mind for plan sponsors, the events of March showed that credit spreads should not be ignored. Given the increase in overall credit spreads, the disparate environment ahead for different bond issuers, and the unique nature of the liability credit-spread risk, now is an opportune time to recalibrate the balance between credit and Treasuries within the liability-hedging portfolio, optimize the active management structure within credit, and consider a potential credit overweight. Thoughtful and timely execution remains critical, as heightened transaction costs and sharp market movements continue to present challenges and considerations.
Index Disclosures
Bloomberg Barclays US Long Credit Index
The Barclays US Long Credit Index represents long-term corporate bonds. It measures the performance of the long-term sector of the United States investment-bond market, which, as defined by the Long Credit Index, includes investment-grade corporate debt and sovereign, supranational, local-authority and non-US agency bonds that are dollar denominated and have a remaining maturity of greater than or equal to ten years.
MSCI All Country World Index (Net)
The MSCI All Country World Index (Net) captures large- and mid-cap representation across 23 developed markets and 26 emerging markets countries. With 3,047 constituents, the index covers approximately 85% of the global investable equity opportunity set. The net index provider returns net of dividend taxes.
Footnotes
- These estimates reflect the return of the Bloomberg Barclays Long Credit Aa Index as a proxy for sample plan liabilities; actual liability performance will be different but similar in direction and magnitude.
- These statistics reflect the average rolling three-year spread (i.e., excess) return of the Bloomberg Barclays Long Credit Index and the MSCI ACWI (Net) Index based on monthly observations for the period December 31, 2000 to March 31, 2020. In fact, the correlation is higher, sometimes by as much as 0.8 to 0.9, in times of equity market stress, including the three-year period ending March 31, 2020.
About Cambridge Associates
Cambridge Associates is a global investment firm with 50+ years of institutional investing experience. The firm aims to help pension plans, endowments & foundations, healthcare systems, and private clients achieve their investment goals and maximize their impact on the world. Cambridge Associates delivers a range of services, including outsourced CIO, non-discretionary portfolio management, staff extension and alternative asset class mandates. Contact us today.