VantagePoint: The Rearview Mirror Problem


For much of the past 15 years, investors were rewarded for concentration. Portfolios tilted toward US assets, especially technology stocks, outperformed, while diversification often felt like a liability. Falling rates, subdued inflation, and a strong US dollar reinforced that pattern, and many portfolios were built on the assumption that those conditions would persist. That assumption is no longer a sound basis for strategic positioning.
Today’s market leaders remain strong businesses, but they are also priced for a continuation of unusually favorable conditions. Meanwhile, valuation gaps across regions and styles are wide; inflation risks are less settled; and the geopolitical, policy, and fiscal backdrops are less benign than investors had come to expect. In this edition of VantagePoint, we explain why investors should be wary of relying on rearview mirror assumptions, where current concentrations create the greatest vulnerability, and why more attractive opportunities now lie beyond the market’s recent winners. The implication is not to react abruptly, but to act strategically.
Investors are not prepared
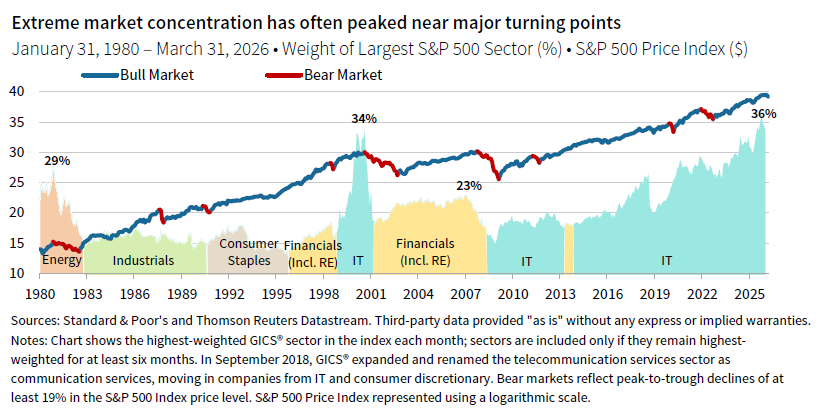
At the end of every bull market, investors tend to be overallocated to whatever worked best. Today, that means not only US equities and US dollar assets, but also a US market that has become unusually concentrated. The United States now represents roughly 64% of the MSCI All Country World Index, up from about 42% in 2010, and the top 10 US companies—most of them technology related—account for 24%. The information technology sector is near its 36% share of the US market reached earlier this year, exceeding the concentration seen in the late 1990s, and that doesn’t even include Amazon, Alphabet, Meta, and Tesla, which are classified as consumer discretionary and communication services stocks. Foreign capital has been attracted to US assets, supporting the US dollar. As was the case in the 1990s, once the enthusiasm for US equities fades, the US dollar will likely fall as well.
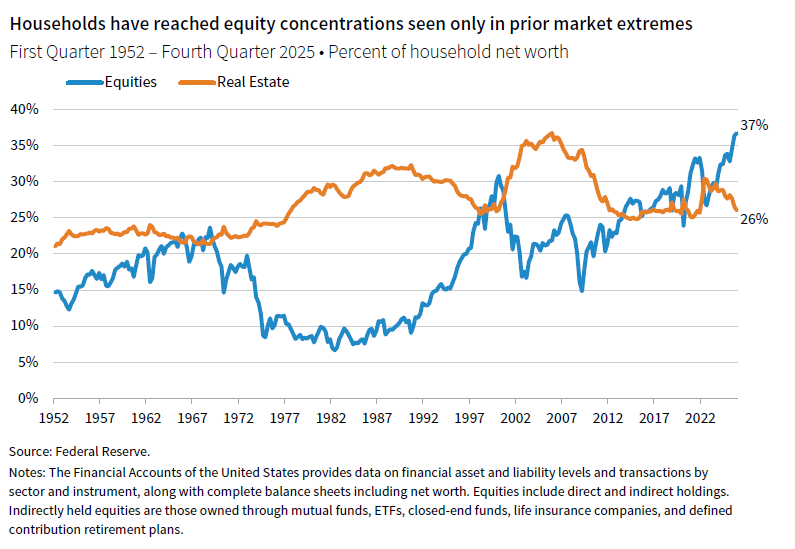
US household equity ownership has also risen to unusually high levels relative to net worth, with equities exceeding real estate by the widest margin in the post-World War II era. Previous episodes in which a narrow group of companies came to dominate market returns—including the Nifty Fifty era in the late 1960s/early 1970s and the dot-com era of the 1990s—proved poor moments to abandon diversification. The point is not that these exposures are about to collapse. It is that many portfolios now rest on assumptions that have become less reliable.
Most investors have correspondingly little direct exposure to tangible assets with real-world scarcity value. That mix made sense in a world shaped by falling inflation, expanding globalization, and stable supply chains. It makes less sense in a world where supply constraints, geopolitical friction, and higher capital intensity are becoming more persistent features of the investment landscape.
The supply side of the economy has changed in ways that look more structural than cyclical. In just five years, investors have had to absorb a series of major shocks: the COVID-19 pandemic, Russia’s invasion of Ukraine, US tariffs, and now the Iran War. Each has reinforced the same lesson. Inflation is not simply a demand-management problem, and geopolitical risk is not a remote tail event. It is a recurring influence on growth, prices, capital flows, and investment priorities. Geopolitical rivalry, defense modernization, artificial intelligence (AI) adoption, energy security, and climate change mitigation and adaptation are increasingly moving together, with important consequences for capital spending, inflation, and asset returns.
This is the rearview mirror problem. Investors are still using the conditions that shaped the past 15 years as a guide for what comes next, even as that backdrop becomes less dependable. We made a similar point in early 2000, when we warned that apparent diversification had been undermined by a shared dependence on US technology exposure. The parallel is not exact, but the lesson is familiar: portfolios built around what worked in one regime can become more fragile than they appear when conditions change.
AI is eating the world, at a cost
AI is the most powerful expression yet of a much longer cycle of US tech leadership. What began as a market preference for scale, duration, and capital-light growth, evident in the earlier dominance of the FANGs (the popular acronym for Facebook, Amazon, Netflix, and Google first coined in 2013) has evolved into a dependence on a small group of companies tied, directly or indirectly, to the AI buildout. Their influence now extends well beyond equity benchmarks. AI-related spending is helping to drive corporate capex, support economic growth, shape investment-grade debt issuance, and increase demand for electricity generation, transmission, and grid resilience. As in past booms, a single theme has grown large enough to shape multiple parts of the investment landscape at once.
That broader reach is one reason historical parallels are useful. Major technological revolutions have repeatedly followed a familiar path. Railroads, electrification, and the internet all produced real economic transformation. They also produced overbuilding, excessive optimism, and eventually some form of bubble dynamic. That is not a contradiction. It is often how transformative technologies are financed. Capital rushes toward the most visible opportunities, investors assume early leaders will capture most of the value, and markets discount a future that proves harder, more competitive, and more capital-intensive than expected. There is little reason to expect AI to be different.
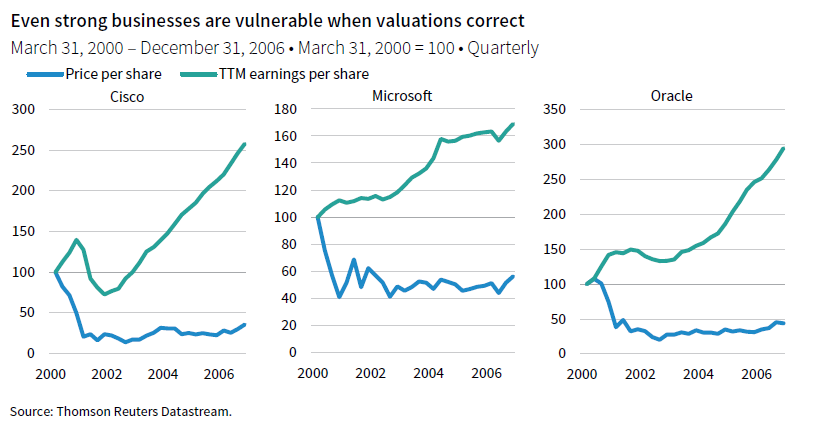
The late 1990s offer a particularly useful comparison. The problem then was not simply speculation. It was that market leadership, capital spending, financing activity, and investor expectations became tightly bound to a single secular narrative. Many dot-com companies were highly speculative and unprofitable, with Pets.com serving as a useful poster child for the era. But companies like Cisco, Microsoft, and Oracle were real companies with strong businesses and central roles in the digital economy. The lesson is that even genuine technological leaders can become poor investments when valuations imply too smooth a path from innovation to durable returns. The same risk exists today.
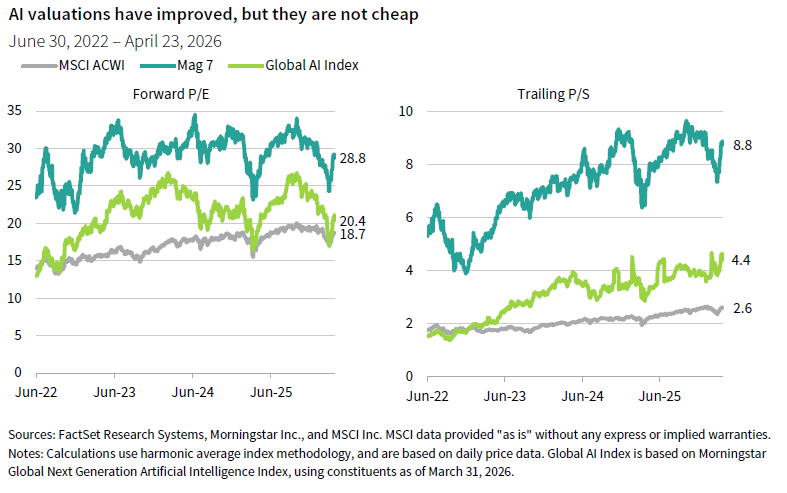
Recent market weakness has taken some of the air out of the most stretched valuations, although much of the improvement has been retraced in April’s sharp market rally. Forward earnings multiples for the Magnificent 7 are meaningfully below their peaks. And on sales-based measures, the derating has been less pronounced, suggesting that investors are still paying demanding prices for a narrow set of companies expected to deliver an unusually large share of future growth. Some froth has come out of the market, but it remains heavily dependent on continued execution from the same leadership cohort.
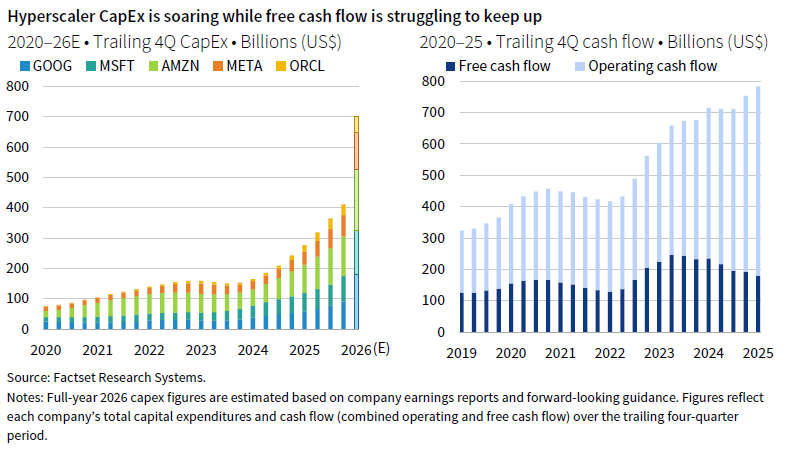
The financing side of the story deserves at least as much attention as valuation. Hyperscaler capex has risen sharply even as free cash flow has started to decline from 2024 peaks, narrowing the gap between internally generated cash and the spending required to maintain leadership. Indeed, these companies are expected to spend $700 billion on capex in 2026—a 70% increase over 2025 spending, which will eat into free cash flows even as operating cash flow is still rising.
As that gap closes, debt financing—including off-balance-sheet structures—is becoming more important. The breadth of the theme is visible in private markets as well. AI and machine-learning deals accounted for roughly half the value of global venture capital investment in 2025 and are expected to account for an even larger share in 2026, up from about one-fifth in 2020 and almost nothing in 2010. That is another sign that AI is no longer simply one promising area of innovation. It is increasingly the organizing principle for capital formation across the growth ecosystem. That may create important opportunities, but it also reinforces the need for discipline. When one theme absorbs such a large share of capital, the line between durable advantage and speculative excess becomes harder to draw.
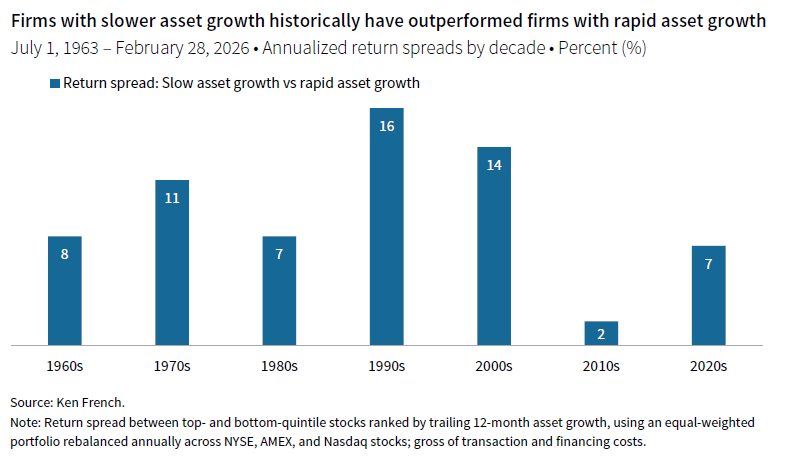
Just as important, the market may still be valuing some of these companies as if they retained the economics of capital-light software businesses. History suggests caution. Firms that grow assets aggressively have tended to underperform more capital-efficient peers, a pattern consistent enough to be embedded in academic factor models. If AI leadership increasingly requires sustained investment in data centers, chips, power, and networks, some of today’s leaders may deserve a different valuation framework than the one investors have become accustomed to applying. Consider that if current analyst estimates are correct, the hyperscalers will have accumulated $2 trillion in AI-related assets by 2030. Assuming an average life of five years, or 20% depreciation, would result in $400 billion in annual depreciation charges, roughly equaling their combined profits of $405 billion in 2025. The AI cycle is moving from enthusiasm to financing, and markets may still be underestimating the eventual cost of leadership.
The investment risk, then, is not simply that AI enthusiasm has gone too far. It is that many portfolios are more dependent on a single theme than they appear. When one secular story drives equity concentration, capital spending, credit issuance, infrastructure demand, and venture enthusiasm all at once, the case for diversification becomes stronger, not weaker. Investors do not need to reject AI to recognize that the better long-term opportunity may lie in markets where expectations are lower, valuations are less demanding, and portfolios are less dependent on a single story.
Credit as an early warning system
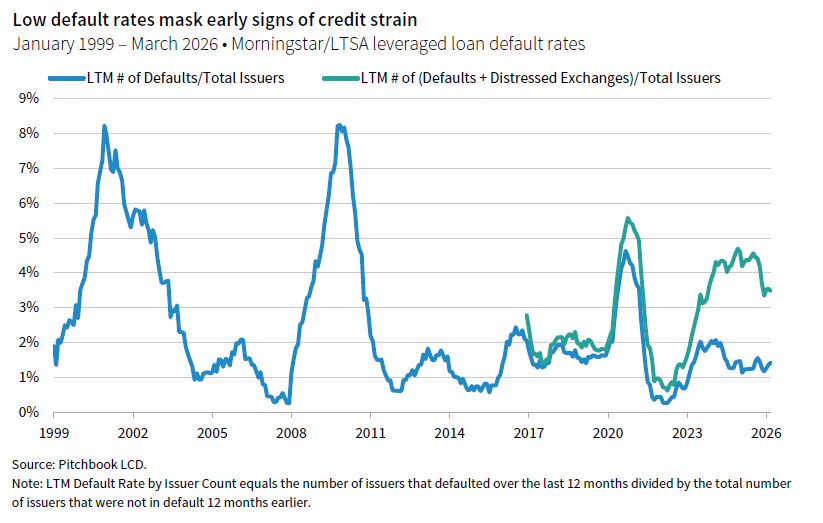
Credit deserves attention because it often reveals fragility before equity markets do. The signal today is mixed. Traditional default rates in public credit have eased, and reported defaults in private credit appear to have eased as well. But broader measures that include distressed exchanges, liability-management exercises designed to avoid default, and payment-in-kind restructurings paint a less comfortable picture. Headline default rates still look manageable, but they may understate where strain is building. That is especially true in private markets, where quarterly marks, amend-and-extend activity, and abundant capital can delay recognition of weakening credit conditions.
AI adds another layer to this picture. As the financing cycle has progressed, more of the capital required to support AI-related investment has moved beyond equity enthusiasm and into credit markets. Investment-grade credit is expected to see gross supply rise about 25% this year to a record $2.25 trillion, with a 10x increase to an estimated $400 billion coming from hyperscalers and related infrastructure. Structured credit markets are expected to see data center securitizations rise by nearly 50% to $30 billion. That includes financing for data centers, infrastructure, and businesses whose economics remain unsettled. It also matters for software-heavy loan books, where some of the most aggressively structured deals were made in businesses that now face greater competitive pressure or pricing uncertainty as AI diffuses. Parts of the market are now being tested against assumptions formed in a more benign period.
Credit market structure has also changed materially over the past decade, with important implications for who provides financing, where leverage sits, and how stress could spread through the system. Private credit is now a much larger and more influential part of the financing ecosystem than it was a decade ago. Much of that growth reflects tighter bank capital regulation after the Global Financial Crisis (GFC), which made some forms of lending less attractive for banks and created room for private lenders to expand. Investor capital followed, drawn by higher yields and the promise of illiquidity premia. This shift brought real benefits, including broader access to capital and more flexible financing for some borrowers. But it also intensified competition, particularly in direct lending, where spreads are tight and lender protections have weakened in more crowded parts of the market.
The same shift was reinforced by the long period of near-zero interest rates that followed the GFC. Zero Interest Rate Policy (ZIRP) did not just lift asset prices. It also encouraged financing structures and underwriting assumptions that were easier to sustain when capital was cheap, and refinancing was routine. Highly levered companies, aggressive growth strategies, and buyouts struck at elevated multiples all looked more manageable in that environment. Many businesses will prove less resilient in a higher-rate world, especially where earnings growth is slowing, equity cushions are thinner, and valuations remain anchored to a more forgiving era. The clearest pressure point is the cohort of loans originated in 2021, when financing terms were exceptionally easy, equity valuations were overstated, and leverage was often pushed to levels that are harder to refinance today. That matters for private equity as well as private credit and secondary funds that are picking up these companies as they come to market. Some of the most vulnerable credits are direct loans tied to sponsor-backed transactions completed when financing was abundant.
The main risk is not necessarily systemic in the way investors associate with 2008. But the warning is still meaningful. Pockets of strain in credit reinforce the broader message of this note: portfolios built around a narrow set of favorable assumptions may be more fragile than they appear. A slowdown in private credit lending would still amount to a form of credit contraction, potentially weighing on growth and certainly increasing the cost of the AI buildout. Risk to the banking system is limited for now, although bank exposure to the private-credit ecosystem has grown and available data almost certainly understate the full extent of those linkages. Insurance is another area to watch, particularly, if private-letter credit ratings overstate underlying credit quality. In such circumstances, highly levered, thinly capitalized insurance companies that have accumulated too many direct loans may come under pressure. Recent concern has also centered on semiliquid vehicles that offer more liquidity than the underlying private credit assets they hold. These funds have seen increased retail outflows, raising the possibility that stress may emerge through gating, valuation uncertainty, or a more selective and uneven availability of credit rather than through a single market-wide break.
For investors, the takeaway is not to avoid credit, but to recognize that portfolios built with disciplined manager selection, underwriting, and fund structuring during more exuberant periods should be better positioned to navigate market shifts. Diversification across sub-strategies should also provide ballast to portfolios.
Where to look for diversification
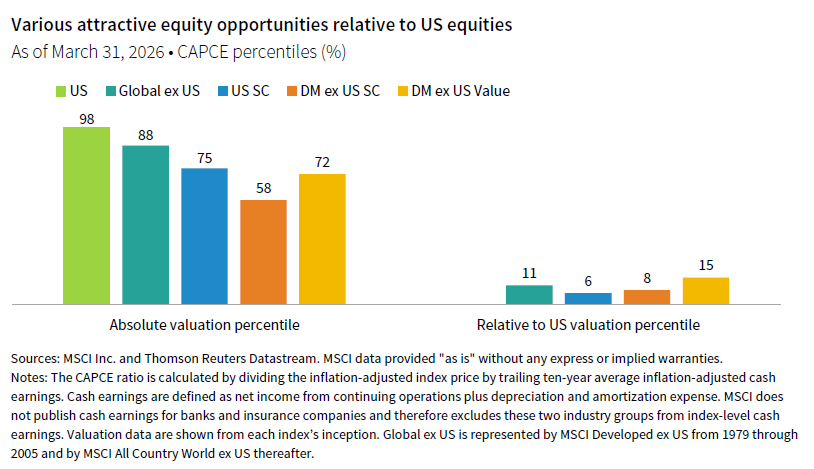
Investors should respond by trimming crowded exposures and rebuilding diversification. The most compelling opportunities now lie in areas where valuations are lower, expectations are less demanding, and return drivers are less tied to the same crowded narrative. That points first to non-US equities, value, small-cap equities, active strategies including hedge funds, and real assets tied to a more capital-intensive and electrified economy.
The strongest public market opportunity is outside the United States. Non-US equities offer lower valuations, less concentration, and greater exposure to sectors and styles left behind during the long period of US large-cap dominance. A weaker dollar, which we expect, would provide an additional tailwind for non-US equity exposure. The combination of valuation support and currency tailwind has historically been a powerful setup for extended periods of outperformance. Global ex US equities are also tilted to traditionally value-oriented sectors, which adds to their appeal in the current environment. The broader capex cycle now underway, while still tied to AI, also incorporates more geographically dispersed themes of energy security, grid resilience, and defense, providing additional support to non-US markets with deeper exposure to industrials, utilities, and related cyclicals.
Small-cap equities also look more attractive than they have for some time. Relative to large caps, valuations are modest, and earnings expectations are beginning to improve as growth broadens beyond technology-related winners. Small-cap equities, especially in the United States, have been held back by higher financing costs, weaker balance sheets, and the market’s overwhelming preference for scale. But that is also why they offer greater upside if capital becomes more selective and market leadership broadens.
Near-term risks remain. Global ex US equities and global small caps are more exposed than US large caps to economic disruption tied to conflict in the Middle East, and the dollar could strengthen further in the short run. But the situation is too fluid to time tactically. Investors are better served by rebuilding diversification and using periods of renewed dollar strength and US equity outperformance to add to non-US positions and reduce US dollar exposure.
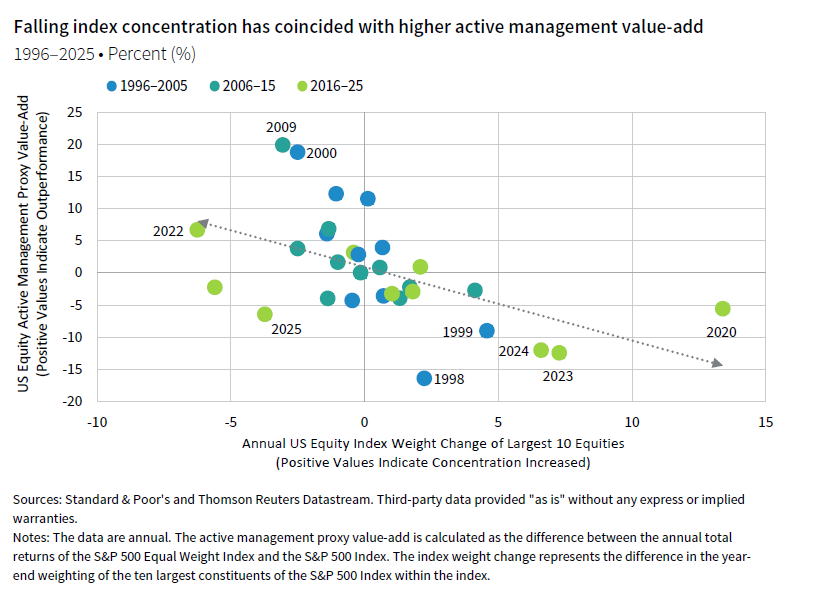
A less concentrated market would also improve the opportunity set for active management. The dominance of large-cap equity performance has created a powerful headwind for active managers. Broadening market leadership and ebbing concentration would change that. Within hedge funds, the case is strongest for strategies that benefit from greater dispersion rather than broad market direction. Equity long-short managers should have a better opportunity set in a world where valuation matters more and returns become less concentrated. This may be particularly fruitful in less efficient markets outside the United States. At the same time, less directional hedge funds, such as arbitrage, global macro, and trend-following strategies can help diversify portfolios when stock-bond relationships become less reliable and macro shocks reverberate across markets in less predictable ways. Other diversifying strategies, such as insurance-linked securities and asset-backed credit can also provide diversification. These are not perfect hedges, but they are better suited to a more fractured environment than portfolios that rely on cash and sovereign bond duration as their only ballast.
Real assets should also play a larger role, especially the resources and infrastructure needed to support a more capital-intensive and electrified economy. Electricity infrastructure and grid modernization are among the most compelling structural opportunities in real assets. The International Energy Agency estimates that $600 billion per year in grid investment is needed by 2030, roughly double current levels. The AI buildout, reshoring, and the energy transition are all increasing demand for generation, transmission, storage, and grid efficiency. The Iran War reinforces the strategic value of energy security, resource independence, and AI-related capabilities, all of which are increasingly being treated as matters of national security. These are long-duration needs with real economic importance and, in some cases, attractive supply/demand characteristics. For portfolios that have become too dependent on financial assets and intangible growth, this is one of the clearest ways to rebuild exposure to scarcity value and real-economy investment.
Commodities and natural resources offer some inflation sensitivity and exposure to supply constraints, though timing has been difficult, particularly given weakness in the Chinese economy and property sector. Years of underinvestment in mining and extraction have created meaningful supply deficits in copper, lithium, nickel, and uranium. The structural case is strong, but current pricing already reflects some of that scarcity even as Chinese demand remains soft. Should the tail risk scenario of the Iran War push the global economy into recession, valuations in parts of the complex would likely become more attractive, creating better entry points and reducing the timing risk that has frustrated investors in this space. Investors should approach this opportunistically, building positions when prices allow rather than chasing what has already moved.
Private markets also require more discrimination. Venture capital is likely to produce some of the future winners in AI, and investors who want exposure to that upside will need some exposure to the private ecosystem. But this is still an early-stage technology cycle, and the eventual winners are far from settled. Investors should be careful not to confuse access to the theme with access to the returns. Meanwhile, many existing technology investments, especially enterprise software deals struck when rates were near zero and valuations were generous, are being tested in a more demanding environment of higher rates and AI disruption. Because private commitments are long-lived, pacing matters as much as manager selection. Investors should continue to allocate to private investments selectively, with patience about timing and valuation rather than rushing to add exposure simply because a theme is compelling. If a new wave of eagerly anticipated technology initial public offerings (IPOs) comes to market this year (e.g., SpaceX, Anthropic), investors should be measured in redeploying capital to private investments, balancing those opportunities against other parts of the market offering more attractive valuations and differentiated return streams. Especially in AI- and software-focused private equity, investors should favor managers with valuation discipline, rigorous underwriting, and the ability to distinguish durable advantage from enthusiasm financed on easy terms.
In short, portfolios built with too much concentration in prior winners are increasingly fragile. We cannot know precisely when leadership will change, but we do know that portfolios are more resilient when they are not built on the assumption that the recent past will continue indefinitely. We believe the strategic response is clear: trim crowded exposures and rebuild diversification through non-US equities, value, small-cap equities, real assets, and active strategies that can benefit from greater dispersion. Investors do not need to abandon the market’s recent winners. They do need to stop treating them as the only place to look for durable long-term returns.
Drew Boyer and Justin Hopfer also contributed to this publication.
Index Disclosures
The Morningstar Global Next Generation Artificial Intelligence Index measures the performance of companies identified by Morningstar as having meaningful exposure to next generation artificial intelligence themes. Indexes are unmanaged, do not incur fees or expenses, and cannot be invested in directly.
The MSCI ACWI captures large- and mid-cap representation across 23 developed markets (DM) and 24 emerging markets (EM) countries. With 2,558 constituents, the index covers approximately 85% of the global investable equity opportunity set. DM countries include Australia, Austria, Belgium, Canada, Denmark, Finland, France, Germany, Hong Kong, Ireland, Israel, Italy, Japan, the Netherlands, New Zealand, Norway, Portugal, Singapore, Spain, Sweden, Switzerland, the United Kingdom, and the United States. EM countries include Brazil, Chile, China, Colombia, Czech Republic, Egypt, Greece, Hungary, India, Indonesia, Korea, Kuwait, Malaysia, Mexico, Peru, the Philippines, Poland, Qatar, Saudi Arabia, South Africa, Taiwan, Thailand, Turkey, and the United Arab Emirates.
The MSCI All Country World ex US Index is a free float–adjusted market capitalization–weighted index of developed and emerging markets equities excluding the United States.; it is unmanaged, cannot be invested in directly, and does not reflect fees, expenses, or taxes.
The MSCI Developed ex US Index is a free float–adjusted market capitalization–weighted index designed to measure the equity market performance of developed markets countries, excluding the United States. The index is unmanaged and is not available for direct investment. Index returns do not reflect the deduction of any fees, expenses, or taxes.
The S&P 500 Index is an unmanaged, capitalization-weighted index generally representative of the US large-cap equity market. The index is not available for direct investment. Index returns do not reflect the deduction of any fees, expenses, or taxes.
The S&P 500 Equal Weight Index is an unmanaged index of S&P 500 constituents equally weighted at each rebalance; it cannot be invested in directly and does not reflect fees, expenses, or taxes.
The S&P 500 Price Index is an unmanaged, capitalization-weighted index of 500 leading US companies that reflects price return only, excludes dividends, cannot be invested in directly, and does not reflect fees, expenses, or taxes.
Celia Dallas - Celia Dallas is the Chief Investment Strategist and a Partner at Cambridge Associates.
About Cambridge Associates
Cambridge Associates is a global investment firm with 50+ years of institutional investing experience. The firm aims to help pension plans, endowments & foundations, healthcare systems, and private clients achieve their investment goals and maximize their impact on the world. Cambridge Associates delivers a range of services, including outsourced CIO, non-discretionary portfolio management, staff extension and alternative asset class mandates. Contact us today.