Sarah Edwards on Systemic Investing with TransCap Initiative
The nascent field of systemic investing aims to help transform entire systems—such as energy, food, housing, or healthcare—rather than simply improving individual companies or projects. Capital is deployed with the intention of advancing environmental sustainability and social justice, using a systems-based lens to identify where investment can support deep, lasting change. In practice, this means […]
July 2026

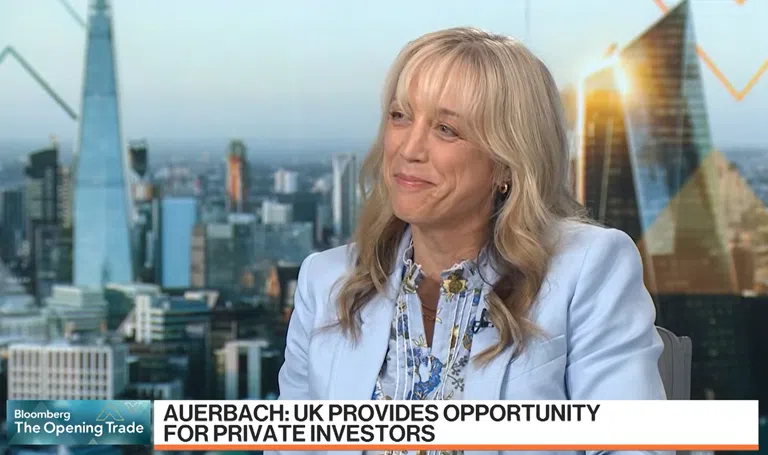
Private Equity, AI & European Markets | Andrea Auerbach on Bloomberg
With roughly 37% of private markets capital deployed in enterprise software, the stakes around artificial intelligence have never been higher for private equity investors. Cambridge Associates’ Global Head of Private Investments, Andrea Auerbach, joined Bloomberg’s Opening Trade to share her outlook on the forces reshaping private markets today. Andrea shares how investor expectations around AI are […]
July 2026
Cambridge Associates Recognized on CNBC Elite Advisors 2026 List
Cambridge Associates has been named to CNBC‘s 2026 Elite Advisors list, an inaugural recognition highlighting leading firms serving ultra-high-net-worth individuals and family offices. The distinction reflects our longstanding commitment to helping ultra-high net worth clients navigate complex investment, wealth, and legacy considerations with the depth, discretion, and sophistication these relationships demand. CNBC’s Elite Advisors list […]
June 2026
David Druley chats with Worth Media at the Milken Global Conference
At the Milken Global Conference, David Druley, Cambridge Associates’ CEO, joined Worth Media to discuss the forces reshaping today’s investment landscape, including artificial intelligence, private markets, geopolitical uncertainty, and global disruption. In the conversation, David examined how institutional investors are responding to crowded trades and a more complex market environment. He also highlighted why resilience […]
May 2026

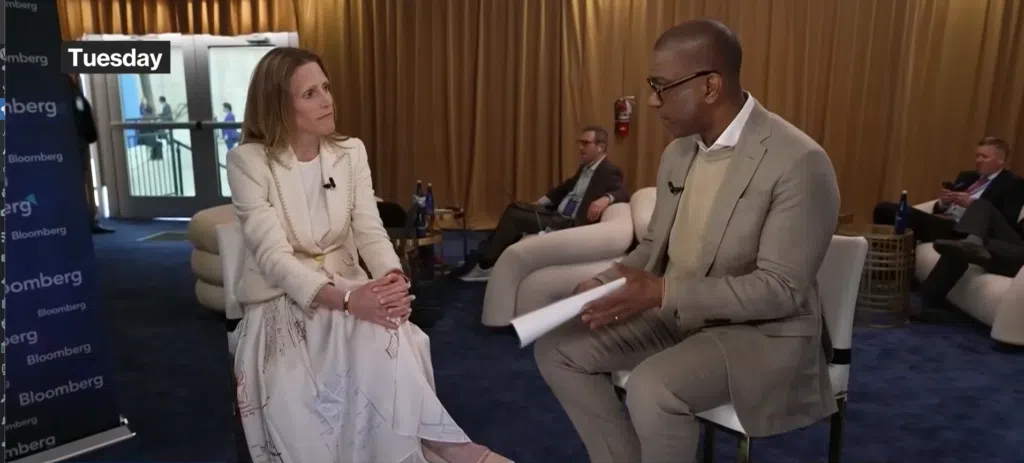
Samantha Davidson on Bloomberg at the Milken Global Conference
At the Milken Global Conference, Samantha Davidson, President and Head of Investing at Cambridge Associates, appeared on Bloomberg to discuss how investors can navigate today’s more complex investment environment. During the interview, Samantha shared Cambridge Associates’ perspective on portfolio resilience, emphasizing disciplined portfolio construction, real diversification, and planning for multiple outcomes rather than relying on […]
May 2026
Cambridge Associates Wins 2026 Family Wealth Report Outsourced CIO Award
Cambridge Associates has been named the 2026 Outsourced CIO winner at the Family Wealth Report Awards, recognizing the firm’s differentiated approach to delivering customized, client-aligned portfolio solutions for private clients. The annual Family Wealth Report Awards celebrate innovation and excellence among firms, teams, and individuals serving North America’s family offices, family wealth managers, and trusted advisor communities. Winners are chosen […]
May 2026

Why Climate Risk is Bigger Than Any Single Portfolio
Simon Hallett, Head of Climate Strategy recently appeared on A Sustainable Future Podcast, hosted by Jason Mitchell at Man Group, to discuss how investors can take a more practical and effective approach to climate action. In the conversation, Simon argued that climate investing needs to move beyond portfolio optics and performative notions of “alignment” and instead […]
April 2026

5 Questions with Cambridge Associates Managing Director Michael Pearce
Michael Pearce is a Managing Director in Cambridge Associates’ endowment and foundation practice, tasked with conducting manager due diligence and developing investment strategies for clients with mission-related, ESG or impact investment objectives. He also serves as a member of Cambridge Associates’ sustainable and impact investing group and community foundation committee. He took the time to […]
April 2026

This website is directed and intended to be accessed by persons who satisfy any of the following criteria:
- A professional client or an eligible counterparty*
- A financial advisor or financial intermediary acting on behalf of a professional client or eligible counterparty*
- An employee or prospective employee
If you satisfy any of these criteria, please click confirm to proceed:
*As defined in the Markets in Financial Instruments Directive (Directive 2014/65/EC) as amended or updated (MiFID)
This website is directed and intended to be accessed by persons who satisfy any of the following criteria:
- A regulated financial entity*
- An institutional investor, investment professional and other entities or individuals who are qualified to operate in financial markets involving regulated financial activity as defined by its local country regulator
- An employee or prospective employee
If you satisfy any of these criteria, please click confirm to proceed:
*An entity regulated by its local country regulator which may include banks, collective investment schemes, endowments, foundations, investment managers, insurance companies, pension funds and intermediaries
The information contained herein is not suitable for retail investors.
Please contact us if you have any questions: [email protected]
If you clicked decline in error, please click here