VantagePoint: Investment Opportunities Six Months Into the Pandemic


Economic, market, and healthcare circumstances have been extraordinary over the last six months. Since the World Health Organization officially declared COVID-19 a pandemic in March of this year, global equity markets sold off sharply before retracing nearly all their losses, while credit spreads widened then tightened back to averages across most markets. The market recovery has transpired as much of the global economy ground to a halt. Fiscal and monetary policies have reduced the risk of a prolonged recession, but much depends on the world’s ability to contain the spread and reduce the impact of COVID-19.
The recovery in global equities broadly masks significant dispersion. For example, global tech stocks have outperformed the broad equity market and value stocks by wide margins this year. Businesses that benefit from limited mobility, such as online shopping and videoconferencing applications, have held up well and even thrived, while those that rely on in-person activities, including travel and hospitality, have struggled. Consumer survey data across 45 countries confirm an accelerated shift from in-person to digital and omnichannel purchases, development of a “homebody” economy, and a preference for businesses that act with consideration to local communities and stakeholders. 1 At least some of these trends and preferences will persist even after it is safe to resume normal activity. At the same time, companies are rethinking work-from-home policies, office space needs, and supply chains.
Six months into this pandemic, we evaluate the investment backdrop and explore attractive opportunities. As preview, we see appeal in tech and tech-enabled businesses but remain cautious on elevated pricing; we find enough value in relatively cheap segments of public equities to justify taking measured, diversified overweights; we are broadly cautious on credit, but see pockets of opportunity in some segments less supported by central bank activity; and we are seeking opportunities that emphasize social equity and diversity.
State of Affairs
As the COVID-19 pandemic spread across the globe, most countries took decisive measures to limit the virus’ spread, while treating the resulting economic shock with aggressive monetary and fiscal policy. We have highlighted two critical areas to watch toward economic recovery: continued fiscal and monetary policy support to serve as a bridge until economic activity can normalize and containment of COVID-19 infections or significant advances in treatments. On the former, the global response overall has been strong. On the latter, cases continue to increase, and progress has been uneven, but medical progress has been impressive, enabling a more targeted policy response.
The damage has been significant, with more than 25 million confirmed COVID-19 cases, 800,000 deaths, double-digit GDP contraction, and sharp increases in unemployment. For the first six months of the year, US GDP fell 10.2%, and Eurozone GDP, 15.2%, seasonally adjusted—the worst decline since the Great Depression. The global economy bounced back sharply from April lows, but GDP remains well below pre-COVID-19 levels, even as several Asian economies have made significant strides to regain lost ground. Central banks everywhere are still committed to supporting markets for the foreseeable future. Support for fiscal policy has largely remained firm although the United States has yet been unable to pass a new stimulus bill amid political clashes. The International Monetary Fund projects that fiscal debt in advanced economies will increase from 105% to 122% between 2019 and 2021, with some countries seeing increases of roughly two times that seen in the three years following the Global Financial Crisis (GFC). Much of this debt has been monetized by central banks—multiples of what was seen in the GFC—raising questions about the risk of inflation. For now, inflation remains in check given excess capacity, and the risk to not acting is greater than that associated with stimulating growth. In short, policymakers have been willing to provide support to bridge the income gap, but this may change as COVID-19 lingers and the effects become more expensive to mitigate.
Even as the number of COVID-19 cases continues to rise globally, the trajectory of new cases is flattening out and the world’s ability to cope with the disease has improved somewhat. As various locations see spikes in cases, they have been able to use more targeted lockdowns than initially enacted, limiting the impact on business activity. Further, as our knowledge about COVID-19 treatments and therapeutics has improved, hospitalization rates and death rates have fallen. For these reasons, assuming the number of new infections keeps falling or stabilizes, economic activity should continue to improve, albeit at a gradual pace.
ECONOMIC ACTIVITY IS HIGHLY CORRELATED TO MOBILITY, WHICH IS UNLIKELY TO REVISIT PRIOR LOWS
March 7, 2020 – August 4, 2020 • Percent (%)
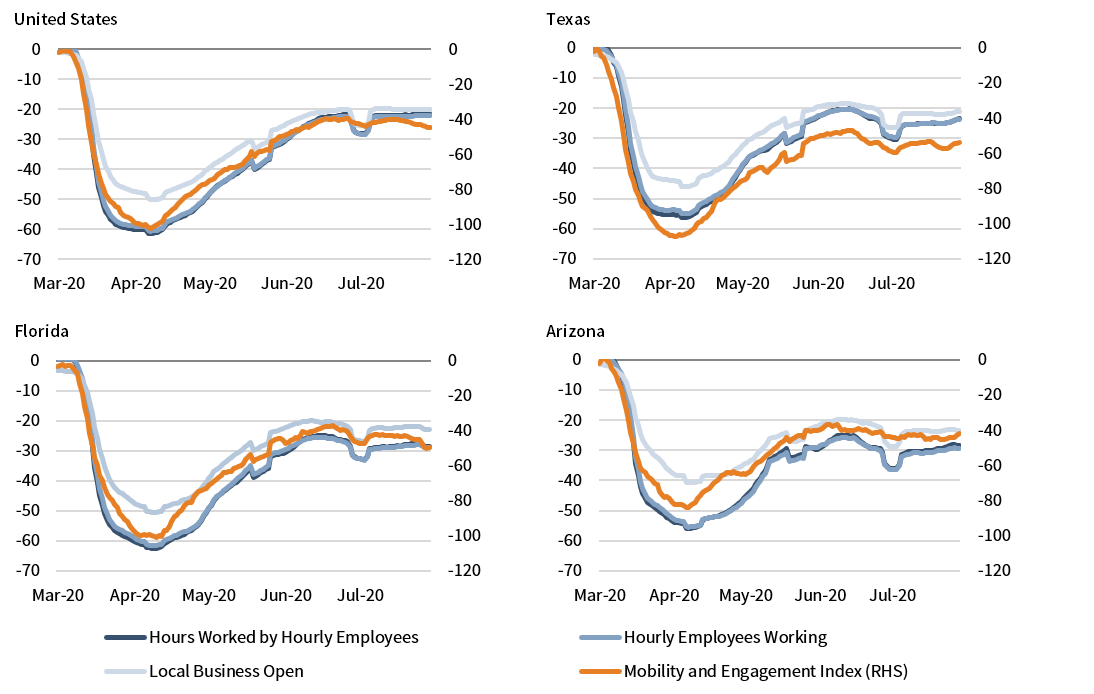
Sources: Bloomberg L.P., Homebase, and Federal Reserve Bank of Dallas.
Notes: Hours worked by hourly employees, hourly employees working, and local businesses open are based on Homebase data. All Homebase rates compare that day versus the median for that day of the week for the period January 4, 2020 – January 31, 2020. The Mobility and Engagement Index is constructed by the Federal Reserve Bank of Dallas and measures the deviation from normal mobility behaviors induced by COVID-19. All data are daily on a seven-day moving average.
At present, there are at least 170 vaccines and 379 therapeutic drugs in development with 47 and 293 in human trials, respectively. More than ten vaccines are in large scale human trials, making prospects for vaccine availability by early- to mid-2021 increasingly plausible. Concerns regarding production, effectiveness, and uptake of a new vaccine present challenges. Indeed, investors may be overestimating the ability of a vaccine to contain COVID-19 if the combination of effectiveness, production, and inoculations lead to immunity levels too low to create herd immunity.
In sum, we can expect a choppy economic recovery based on the path of the virus and responses to its path, but the worst is likely behind us. Markets remain vulnerable to a diminution in policy support and disappointment on the ability to contain and treat COVID-19, but prospects have improved.
Walking the Tech Tightrope
Limit underweights to tech for now, seek to expand if greater opportunities unfold in relative value opportunities over time.
The COVID-19 pandemic has accelerated technological disruption. Many tech businesses claim product adoption has advanced five years in the span of just eight weeks. While discriminating between winners and losers is best left to managers, we consider opportunities and risks in the sector to inform appropriate exposure on a look-through basis. Strong demand, persistent cash flow growth, and low interest rates have benefited tech and tech-enabled companies, as well as tech-related infrastructure and real estate. Yet, these investments are vulnerable to several factors, such as relatively high valuations, a sharper-than-expected reversal in demand trends, higher interest rates, regulatory backlash, US-China relations, and the potential for higher taxes. On balance, we continue to look for opportunities and would not stray too far from neutral allocations based on global equity benchmarks, while recognizing that tech cuts across sectors.
A key question is whether market pricing has gotten ahead of reality. Over the last five years, equity price appreciation has been influenced by cash flow growth. However, some stocks, including the vast majority of tech stocks and tech-enabled FAAMGs, have seen appreciation beyond that justified by trailing fundamentals indicating high confidence in the future. Indeed, the current sell-off in tech stocks following their recent parabolic ascent should come as no surprise. Over the next three years (2020–23), analysts forecast annualized EPS growth of 32% for Netflix, 30% for Amazon, 15% for Facebook, and 12% for Microsoft—lofty expectations, but not out of historical bounds. In addition, the roughly 270 basis point (bp) decrease in US ten-year Treasury yields since late 2018 has disproportionately benefited long-duration assets, like technology stocks. 2 Should rates remain tame, current pricing could be supported, although there isn’t much room for continued appreciation on this basis.
TECH STOCKS HAVE GENERALLY APPRECIATED MORE THAN FUNDAMENTALS ALONE JUSTIFY
August 31, 2015 – August 31, 2020 • 5-Yr Trailing Annualized Average Percent Change (%) • Local Currency
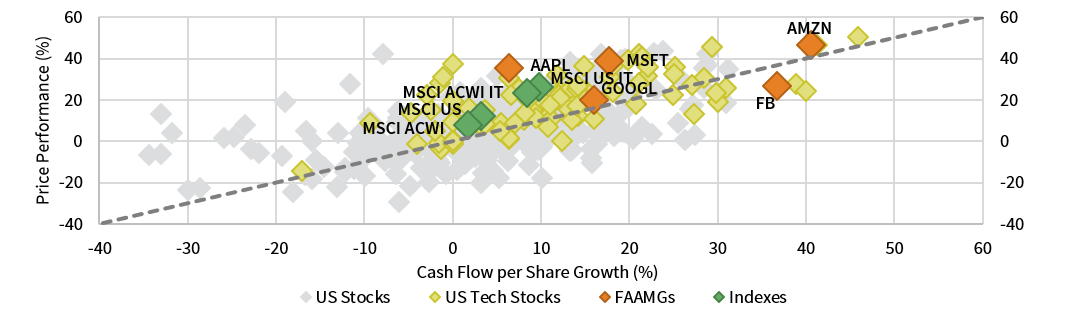
Sources: MSCI Inc. and Thomson Reuters Datastream. MSCI data provided “as is” without any express or implied warranties.
A reversal in interest rates would transpire should economic prospects improve (perhaps from rapid development of an effective vaccine), central banks seek to roll back extreme measures, and/or inflation expectations inch up. Tech stocks also face regulatory and tax risk. While a break up of tech companies seems unlikely, 3 we expect increased regulation. Continued escalation of US-China tensions also has potential to limit tech profits as companies reconsider supply chains and find their end markets constrained by regulations (e.g., inability of Huawei to include Google apps and Apple to include WeChat on their smart phones). Furthermore, an increase in corporate tax rates, as would be expected should Joe Biden win the US presidential election, would disproportionately crimp large tech, pharma, and biotech companies’ profit margins, especially if they limit use of safe harbors.
Outperformance of tech and tech-enabled companies and supporting businesses has largely been justified in the pandemic. Prices for many fast-growing businesses are starting to outstrip fundamentals, while valuations remain well below bubbly peaks reached in the late 1990s. Indeed, we may be at the early stages of a tech bubble. It will likely be detrimental to meaningfully underweight tech in the near term, but risky to overweight tech in the intermediate to long term. We would limit any underweights to tech for now, seeking to expand them should greater opportunities unfold in relative value opportunities over time.
Leaning in to Relative Value in Equities
Establish small overweights within equities across non-US, small caps, and value, and use momentum as a signal to further increase positions.
As discussed above, looking toward the remainder of 2020 (and beyond) investors face difficult tasks. They must assess the long-term impact of COVID-19 on companies, while also determining when the eventual economic recovery might allow some of these performance streaks to reverse. Although timing for the latter is uncertain, we believe investors should lean into opportunities that offer relative value, including non-US, small-capitalization, and value stocks.
US stocks have recently trounced global peers, with the MSCI US Index beating non-US equivalents by around 6,000 bps cumulatively over the past five years. This has continued throughout the pandemic. Slightly stronger macro conditions in the United States, more exposure to tech champions, and shareholder-friendly capital management have supported performance, but it is easy to overstate their impact. US earnings growth has outpaced peers, but by less than 350 bps per annum over the past five years. US stocks are now twice as expensive as developed peers, a record gap. A cyclical economic rebound could help narrow this differential, and we note the impressive policy response in the Eurozone, as well as more encouraging COVID-19 trends. Meanwhile, Asian countries like China have seen a much shallower recession and earnings hold up better throughout the pandemic, and 2021 earnings growth forecasts for EM overall are higher than in the United States. Rising political risks may also weigh on US equities, as could higher leverage levels (or political pressure), which discourage buybacks.
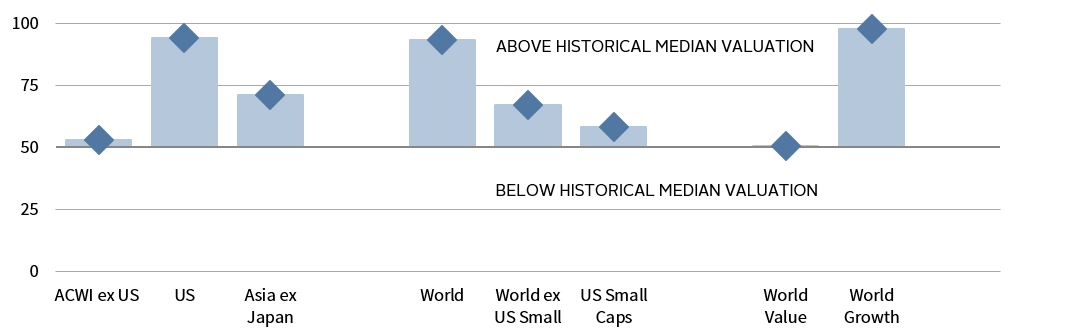
EQUITY RALLY HAS PUSHED US AND GROWTH STOCK VALUATIONS HIGHER
As of August 31, 2020 • Percentile
Source: Cambridge Associates LLC.
Notes: This exhibit compares current valuation levels to historical levels across a variety of asset classes. A percentile rank of 50 indicates that an asset class’s current valuation level is consistent with its long-term median, while a percentile rank of 75 indicates that level is higher than 75% of historical data. The valuation levels for each asset class is determined by a metric or composite of metrics relevant to that asset class.The cyclically adjusted price-to–cash earnings (CAPCE) ratio is calculated by dividing the inflation-adjusted index price by trailing ten-year average inflation-adjusted cash earnings. Cash earnings are defined as net income from continuing operations plus depreciation and amortization expense. MSCI does not publish cash earnings for banks and insurance companies and therefore excludes these two industry groups from index-level cash earnings. ACWI ex US, Asia ex Japan, US Small Cap, and World ex US Small Cap equities are cyclically adjusted by trailing five-year data. All data are monthly.
Small-capitalization stocks have also been a notable COVID-19 laggard, continuing a long-running trend. US small-cap stocks trail large-cap peers by more than 1,500 bps year-to-date and more than 600 bps per annum over the last five years. US small caps have been disproportionately impacted by COVID-19 given large weights to heavily impacted sectors like healthcare, financials, and real estate, and different types of companies within some buckets (notably, regional versus global banks and retailers versus Amazon). High debt levels and secular changes may mean many never recover from the current crisis. However, small caps typically outperform coming out of a crisis as valuations decompress; in the meantime, seldom has the valuation differential between small and large caps been so large.
The post-COVID recovery may also allow for beleaguered value stocks to rebound, which, like their international and small-cap brethren, have rarely underperformed to this degree. World growth stocks have outperformed value by more than 3,700 bps over the last 12 months, as investors have paid up for their attractive combination of yield and earnings growth amid the pandemic-related recession. Not all value stocks will stage a fierce recovery, especially if low interest rates and dividend cuts continue to weigh on sectors like financials and energy. However, the flipside is that nosebleed valuations for many growth stocks imply a robust economic rebound, which would also benefit cyclically exposed value peers, and some tech darlings are cheap enough to be included in value indexes.
The recent economic recovery remains tenuous and is vulnerable to forces like another resurgence of COVID-19 or diminished political appetite for more stimulus. Given the resulting uncertainty about when current sectors cede leadership positions, we suggest investors establish small overweights within equities across non-US, small caps, and value, and use momentum as a signal to further increase positions. To limit underweights to high-quality IT stocks, which could continue to outperform, investors implementing these overweights should ensure private investment sleeves have adequate exposure and/or implement these tilts via active managers.
Picking our Places in Credit
Choose private over public credit strategies and pursue opportunistic mandates.
Credit assets have generated mixed performance year-to-date, with eligibility for Federal Reserve purchases, exposure to a COVID-19 related slowdown, and technical factors all coming into play. US investment-grade bonds have fared best (6.9% year-to-date), high-yield bonds are barely in the black (1.7%), and many types of structured credit have underperformed. Given in many cases an unpalatable combination of average spreads but elevated risks, investors should choose private over public credit strategies and pursue opportunistic mandates as opposed to placing all their eggs in one basket.
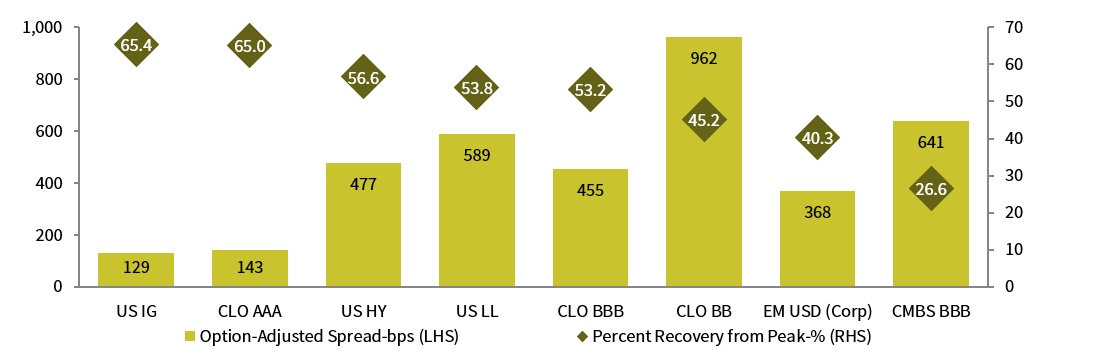
CREDIT SPREADS HAVE RECOUPED MOST OF THEIR LOSSES WITH SOME EXCEPTIONS
As of August 31, 2020
Sources: Bloomberg Index Services Limited, Credit Suisse, J.P. Morgan Securities, and Thomson Reuters Datastream.
Notes: Asset classes represented by: Bloomberg Barclays US Corporate Investment Grade Index (US IG), J.P. Morgan CLOIE AAA Index (CLO AAA), Bloomberg Barclays US Corporate High Yield Index (US HY), Credit Suisse Leveraged Loan Index (US LL), ), J.P. Morgan CLOIE BBB Index (CLO BBB), J.P. Morgan CLOIE BB Index (CLO BB), J.P. Morgan CEMBI Diversified Index (EM USD [Corp]), and Bloomberg Barclays US CMBS Baa Index (CMBS BBB). Percent recovery from peak is the recovery of the option-adjusted spread from each asset’s peak. Peak dates vary for each individual asset class.
Opportunities in liquid credit are greatest where the Fed is not providing direct support. Spreads on lower-rated collateralized loan obligation (CLO) paper (including BBB- and BB-rated bonds) have tightened yet remain elevated, though asset quality and deal structures vary and using skilled active managers is key. Strong tailwinds like record-low mortgage rates and limited new supply are likely to support housing related credit, including non-Agency residential mortgage bonds. There are also select opportunities in lower-rated legacy commercial mortgage–backed securities, but loan delinquencies are rising and vintage, collateral type, and choice of tranche come into play—some of these bonds are cheap for good reason.
In contrast, investors should pass on assets whose option-adjusted spreads offer little compensation for the possibility of another downturn in risk assets. BB-rated high-yield bond spreads have retraced more than 60% of their late-March widening and now yield just 3.9%, while investment-grade corporate bonds have retraced 65% and offer a historically low yield of just 1.9%. Structured credit is a similar story, with Fed support and stabilizing fundamentals meaning some AAA-rated assets now yield less than levels seen in early March.
Investors willing to lock up capital have more attractive alternatives. Some managers can earn attractive spreads by funding borrowers shunned by skittish banks or whose debt is ineligible for Fed largesse. Examples include lower middle-market companies targeted by direct lending funds and real estate operators looking to acquire and renovate assets. Credit opportunity funds are seeing a variety of opportunities, though massive government intervention has slowed the pace at which some are deploying capital. Looking forward, their opportunity set includes making loans to troubled companies that are unwilling or unable to tap public markets, leveraged funds needing to sell assets due to weakening collateral performance that triggers margin requirements, and ratings downgrades that trigger forced selling. In some cases, there may also be mismatches between time horizons of funds, which hold struggling corporate loans or property-backed securities, and their investors that desire more immediate liquidity, creating opportunities for those that are more patient to step in and await an asset’s recovery.
Distressed funds are in capital-raising mode, and an extended downturn could generate significant opportunities given the combined $2.5 trillion high-yield and loan markets. Still, it is unclear whether these commitments should be the first priority. Default rates are rising but have thus far been concentrated in industries like energy and retail; a plunging distressed ratio speaks to the fading possibility of a disorderly cycle, which might offer the richest pickings for investors. There is also the possibility that a quick recovery ensues, allowing even struggling companies to squeak by given loose lender protections.
Supporting Social Equity
Seek opportunities that emphasize social equity and diversity.
An opportunity also exists among social equity investments. This space is broad and deep, touching multiple thematic areas and industries: think education technology, healthcare services, and affordable housing. Investments in these areas benefit society as a whole by addressing its inequities, many of which manifest themselves along racial and gender lines. While we expect return patterns of investments in this space will be similar to other equity investments, they may diversify traditional portfolio holdings to a greater extent. Moreover, they add another dimension to success—social impact.
The tragedy of George Floyd’s death galvanized a global social movement, adding urgency to this opportunity. But data has long indicated that stark divides exist. Consider, for example, how wealth is allocated in the United States. Currently, White Americans hold 84.8% of the nation’s total wealth, which represents roughly $88.4 trillion, according to the Fed. While the share of White Americans’ wealth has fallen from its recent peak in 2001, it is still considerably larger than that racial group’s share of the population, which is 60.1% at present.
WHITE AMERICANS CONTROL THE MAJORITY OF US WEALTH
First Quarter 1990 – First Quarter 2020 • Share of Total Wealth (%)
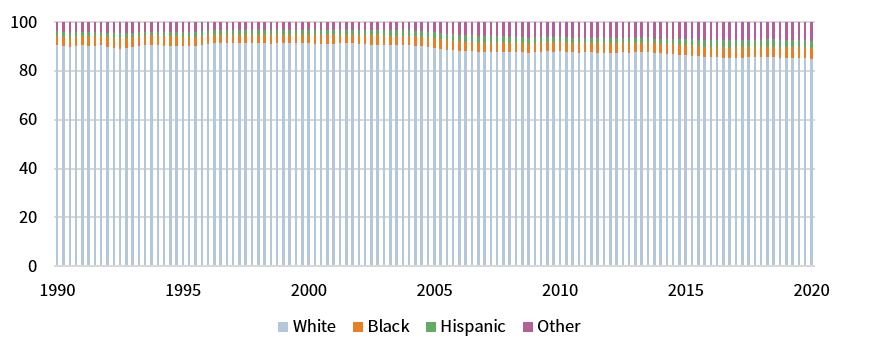
Sources: Federal Reserve and Survey of Consumer Finances and Financial Accounts of the United States.
Long-lasting concentrations of wealth such as this have ramifications for society. To see one, look no further than health outcomes for COVID-19 patients. The rate at which Black Americans have died is 2.4 times the rate of White Americans, after accounting for population sizes, according to the COVID Tracking Project. Hispanic Americans have suffered too, with death rates 1.5 times that of White Americans. Unfortunately, these inequities aren’t present in just one corner of life. Disparities occur in virtually all areas, such as financial inclusion, education, and housing.
But where there are gaps in investment focus, there are opportunities. We view the opportunity set in two ways. First, there are those managers that are diverse themselves or that have an explicit strategy of backing diverse-run businesses. Second, there are those managers whose investments would disproportionately benefit underlying communities in need. This approach is a bit more abstract, but consider a manager focused on fintech start-ups aimed at democratizing financial solutions or another seeking to improve access to healthcare services. Although the products of those firms may benefit all communities, underserved communities may find them particularly empowering.
In both approaches, we’ve seen the number of manager options increase in recent years. Like any space, return expectations vary by the manager’s focus and strategy, but broadly speaking, we don’t expect return patterns to be structurally different than other equity strategies. Still, it does seem reasonable to expect that social equity returns may be less correlated to traditional portfolio holdings than broad equity strategies, given their integration of a different lens in investment decision-making processes. 4 Said differently, these strategies may help to diversify any implicit or explicit biases against these communities in portfolios.
Conclusion
The world has changed considerably over the last six months. As many markets have rapidly snapped back in response to extraordinary fiscal and monetary policy, investors must be discriminating in pursuit of opportunities. While we believe the economy has bottomed, the road ahead may be choppy. We also recognize that investors and business leaders notoriously overestimate the near-term impact of changes, while underestimating the long-term impact. Patient investors should find attractive long-term opportunities in public and private technology and tech-enabled investments given the dramatic change under foot but should limit exposures at elevated valuations. At the same time, investors should initiate small overweights to relatively cheap equities, such as value, global ex US, and small-cap equities that have considerable upside if conditions improve given their propensity to outperform during recoveries. Selective opportunities remain in credit and managers with the ability to be flexible as the opportunity set evolves should be best positioned for success. Finally, the importance of investing in social equity and diversity has been brought into sharp relief by this crisis. We expect such investments to offer diversification at competitive returns relative to the broad market.
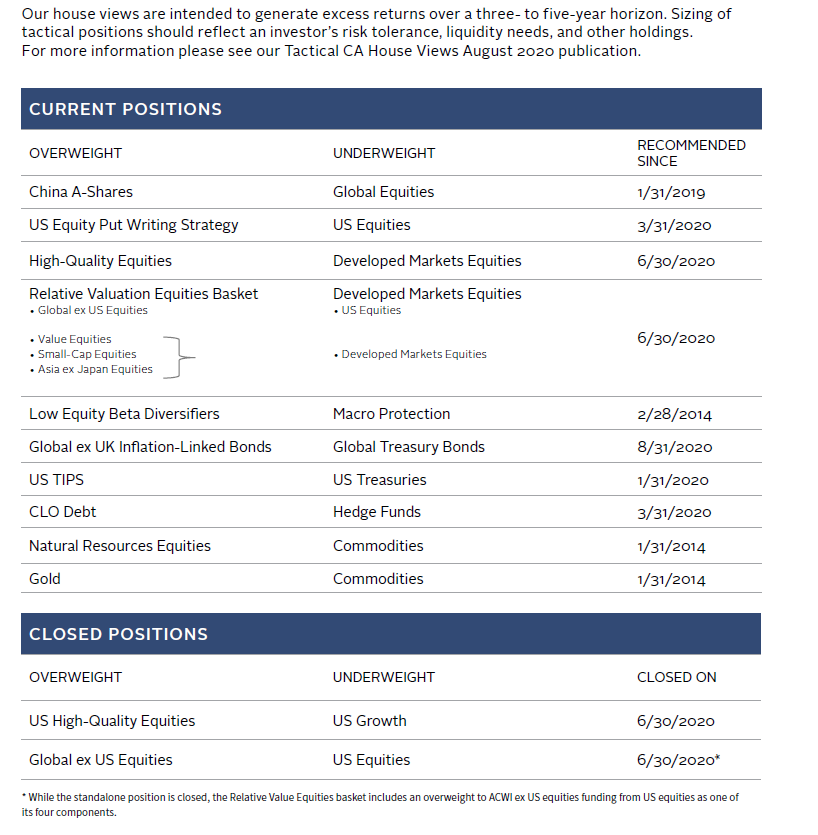
OVERVIEW OF TACTICAL CA HOUSE VIEWS
August 31, 2020
Index Disclosures
Bloomberg Barclays US CMBS Baa Index
The Bloomberg Barclays CMBS Index has been designed to measure the performance of investment-grade commercial mortgage-backed securities (CMBS) market. This index is the Baa component of the Investment Grade CMBS index. For investment-grade sectors, securities must be rated investment grade (Baa3/BBB- or higher) by at least two of the following ratings agencies: Moody’s, S&P, and Fitch. If only two of the three agencies rate the security, the lower rating is used to determine index eligibility. If only one of the three agencies rates a security, the rating must be investment grade.
Bloomberg Barclays US Corporate High Yield Bond Index
The Bloomberg Barclays US Corporate High Yield Index measures the US corporate market of non-investment grade, fixed-rate corporate bonds. Securities are classified as high yield if the middle rating of Moody’s, Fitch, and S&P is Ba1/BB+/BB+ or below.
Bloomberg Barclays US Corporate Investment Grade Bond Index
The Bloomberg Barclays US Corporate Investment Grade Bond Index measures the investment-grade, fixed-rate, taxable corporate bond market. It includes USD-denominated securities publicly issued by US and non-US industrial, utility, and financial issuers.
Credit Suisse Leveraged Loan Index
Credit Suisse Leveraged Loan Index is a market-weighted index that tracks the performance of institutional leveraged loans.
J.P. Morgan CEMBI Diversified Index
The J.P. Morgan Corporate Emerging Markets Bond Index Broad Diversified (CEMBI Broad Diversified) is an expansion of the J.P. Morgan Corporate Emerging Markets Bond Index (CEMBI). The CEMBI is a market capitalization weighted index consisting of USD-denominated emerging markets corporate bonds.
J.P. Morgan Collateralized Loan Obligation Index (CLOIE)
CLOIE offers total returns and analytics based on observable pricings of a representative pool of bonds following a stated methodology and is published daily. The index holistically captures the USD-denominated CLO market, representing more than 3,000 instruments at a total par value of US $236.1 billion. Market participants can track securitized loan market valuations. CLOIE tracks floating-rate CLO securities in 2004–present vintages. Additional sub-indices are divided by ratings AAA through BB, and further divided between pre- and post-crisis vintages. CLO 2.0, or post-crisis vintages, consists of deals issued in 2010 and later. CLOIE utilizes a market-value weighted methodology.
Footnotes
- Nidhi Arora et al., “Consumer sentiment and behavior continue to reflect the uncertainty of the COVID-19 crisis,” McKinsey & Company, July 8, 2020.
- As an example, the present value of a perpetual cash flow stream of $100 growing at 4% a year with an equity risk premium of 500 bps would increase in value nearly three times with a drop in the discount rate of 270 bps. Increasing the growth rate to 5% would result in a more than six-fold increase in market value from the decline in the risk-free rate.
- What benefit would such actions have on monopolistic influences since much of the mega-cap companies’ influence stems from network effects?
- Numerous studies have found a significant relationship between diversity and business performance exists, with more inclusive firms performing better. As an example, please see Vivian Hunt et al., “Delivering through Diversity,” McKinsey & Company, January 18, 2018.
Celia Dallas - Celia Dallas is the Chief Investment Strategist and a Partner at Cambridge Associates.
Wade O’Brien - Wade O’Brien is a Managing Director for the Capital Markets Research team at Cambridge Associates.
Kevin Rosenbaum, CFA, CAIA - Kevin Rosenbaum is Head of Global Capital Markets Research and Investment Communications at Cambridge Associates.
About Cambridge Associates
Cambridge Associates is a global investment firm with 50+ years of institutional investing experience. The firm aims to help pension plans, endowments & foundations, healthcare systems, and private clients achieve their investment goals and maximize their impact on the world. Cambridge Associates delivers a range of services, including outsourced CIO, non-discretionary portfolio management, staff extension and alternative asset class mandates. Contact us today.