VantagePoint: Have US Equities Hit Bottom?


US equities have entered official bear market territory with a more than 20% price decline. Some markets have seen sharper drops with speculative tech stocks (e.g., the Ark Innovation ETF) falling more than 75% from early 2021 peaks and many crypto assets seeing similar declines. Given the uncertain economic and profit environment, have markets bottomed yet? In this edition of VantagePoint, we address this question by comparing current market conditions to those of historical bear markets, evaluating economic conditions to better understand near-term recession prospects, and considering how much further the market may have to go based on historical precedents.
We suspect that US equities have probably not hit a bottom yet. Volatile inflation readings, the potential for the Federal Reserve to remain aggressive in hiking rates, and waning economic activity all suggest to us that equities are not out of the woods. Still, timing a market bottom is notoriously difficult. This uncertainty, along with the potential harm from being under-allocated to equities, leads us to recommend investors avoid being under-allocated to equities.
In times of heightened market uncertainty, skilled investors follow pre-established plans for managing through periods of stress. Thoughtful decisions during chaotic environments lay the groundwork for top performance. Key points of preparation include knowing the market history reviewed in this publication, stress testing portfolio liquidity, understanding the diversification capacity of portfolios, guarding against behavioral risks, and positioning to play offense, including rebalancing into assets that become cheap and maintaining adequate diversification (including high-quality sovereign bond duration) to capitalize on opportunities as they develop.
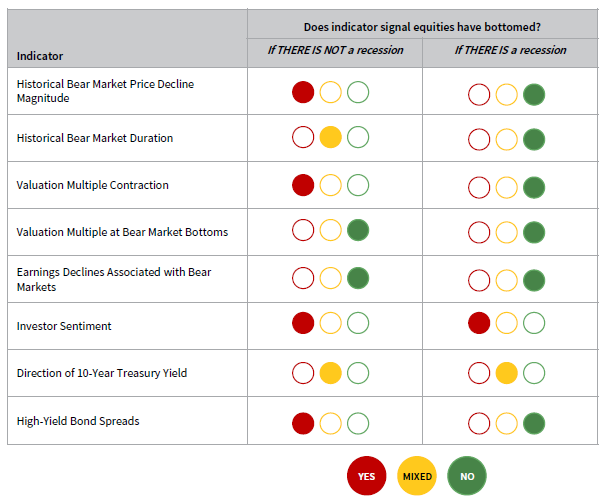
Indicators signal equities have not bottomed unless recession can be avoided
If the United States does not enter a recession in the next year or two, the market may have bottomed with the decline in prices and valuation multiples close to non-recessionary bear market averages. However, if a recession comes soon, the equity market is only 50% to 70% of the way to the bottom if history proves to be a useful guide.
US equity earnings are well above their trendline, and profit margins are stretched. With slowing economic growth, rising inflation and interest rates, and changing consumption patterns, meeting earnings growth expectations will be challenging.
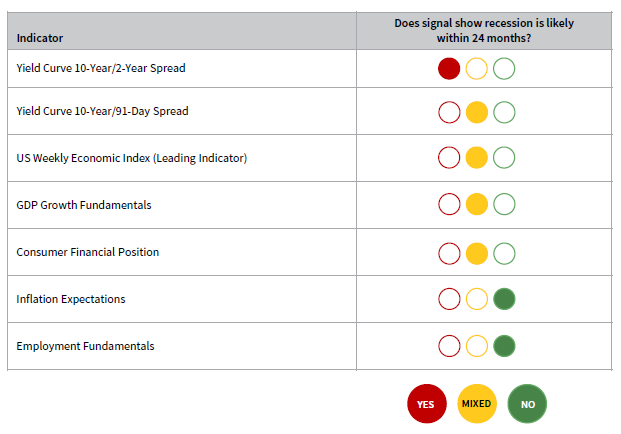
Economy is slowing; unclear if recession is on the horizon for 2022–23
The ten-year/two-year Treasury yield spread has inverted, while other prominent yield spread signals have not. Following the surprisingly strong inflation print on July 13, other metrics like the ten-year/three-month yield spread have narrowed considerably. Should these trends persist, a recession is highly likely. However, timing remains uncertain as the lag between yield curve inversion has been varied, ranging from six to 24 months.
Below your average bear
The current bear market has been relatively short and shallow thus far. At six months and 24.7% down, this bear ranks fourth shortest and the second most shallow among the last ten 20%+ bear markets (without a subsequent 20%+ increase). While the cyclically adjusted price-to–cash earnings (CAPCE) ratio has fallen 29.1% to a multiple of 16.9, the decline falls short of—and the valuation level remains well above—those seen at prior bear market bottoms. The valuation adjustment was only lesser in the 1976–78 and 2009 bear markets, but in those instances, valuations fell to much lower levels.

Notes: The cyclically adjusted price-to–cash earnings (CAPCE) ratio is calculated by dividing the inflation-adjusted index price by trailing ten-year average inflation-adjusted cash earnings. Cash earnings are defined as net income from continuing operations plus depreciation and amortization expense. CAPCE data prior to 1980 represent S&P 500 Shiller P/E. Data for 2022 are ongoing and may change. MSCI does not publish cash earnings for banks and insurance companies and therefore excludes these two industry groups from index-level cash earnings.
Real yields are in the driver’s seat
The decline in equity valuations has largely been driven by rising real yields. As interest rates have increased, equities have rerated to lower valuations reflecting the rising cost of capital. The US equity market is top-heavy with large growth stocks that are particularly sensitive to higher rates. For example, Facebook (Meta), Amazon, Apple, Netflix, Google (Alphabet), and Microsoft (FAANGM) account for 22% of the S&P 500’s market cap.
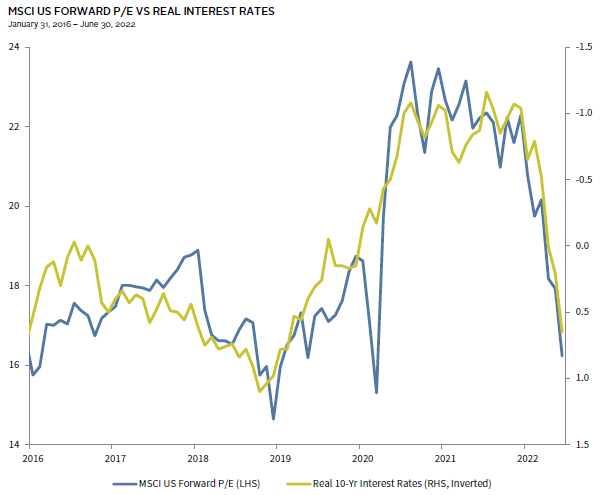
Notes: Real ten-year interest rates are represented by the ten-year TIPS yield. Data are monthly.
Don’t forget about the E in P/Es
The price-to–forward earnings multiple has contracted a similar amount to the cyclically adjusted price-to–cash earnings (CAPCE) ratio. However, forward earnings expectations have increased over the course of this bear market. Should earnings expectations adjust downward, as we expect will transpire, equities will suffer further losses, particularly if the US economy enters a recession.
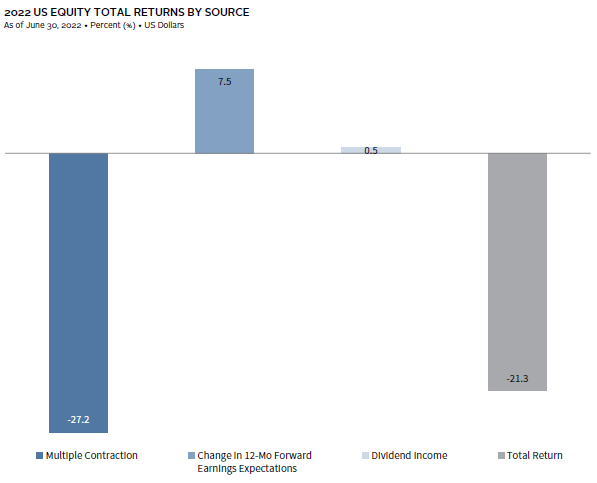
Notes: EPS growth is based on the percent change in aggregate 12-month forward earnings. Multiple expansion is based on the percent change in 12-month forward price-earnings ratio. Dividend income is the compound difference between the 12-month total return and the 12-month price return. All three components of return geometrically compound to total return. Total return data for all MSCI indexes are net of dividend taxes.
Will earnings be the next shoe to drop?
Earnings rarely remain steady or appreciate during bear markets; timing relative to bear markets can vary but the trend generally holds, especially for bear markets associated with recessions. A lesson from the 1970s period is that inflation may support nominal earnings growth, but real earnings remain more challenged. While it is possible earnings will stay flat or appreciate if the United States avoids a recession, we regard this as unlikely. Earnings sit at levels 27% above their ten-year nominal trendline, a precarious position with stretched profit margins, slowing economic growth, rising inflation and interest rates, and changing consumption patterns.
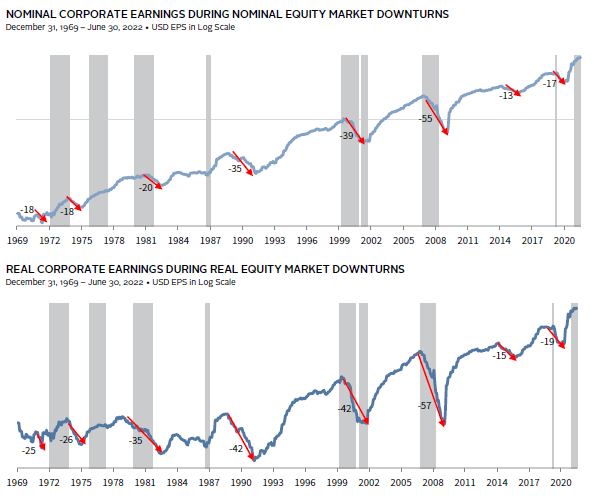
Notes: Shaded bars represent US equity bear market periods. Red lines and data labels represent major corporate earnings declines.
Drilling down, earnings expectations are starting to fade
Strong earnings expectations come primarily from the energy sector, with industrials and materials also making positive contributions. Excluding energy, expectations for 2022 and 2023 earnings are starting to fall, but nowhere near the pace of decline experienced in previous bear market recessions.
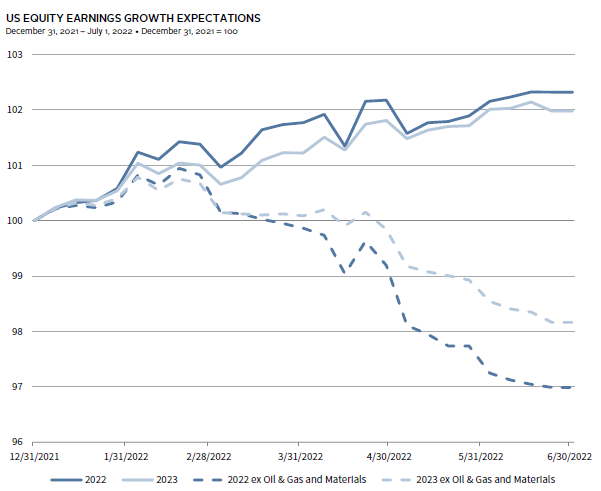
Note: Data are weekly.
Investor sentiment stands apart as signaling equities have hit bottom
Our composite US investor sentiment metric includes the CBOE VIX and Put/Call indexes and AAII Investor Sentiment Survey. An index z-score less than -1.0 implies investor sentiment is at low extremes. This measure does not always identify bear market bottoms but has signaled each of the last three and is signaling a bottom today. This signal also tends to mark bottoms after more commonplace 10%+ market corrections. Subsequent six-month, one-year, and three-year equity returns were generally positive after this negative sentiment signal.
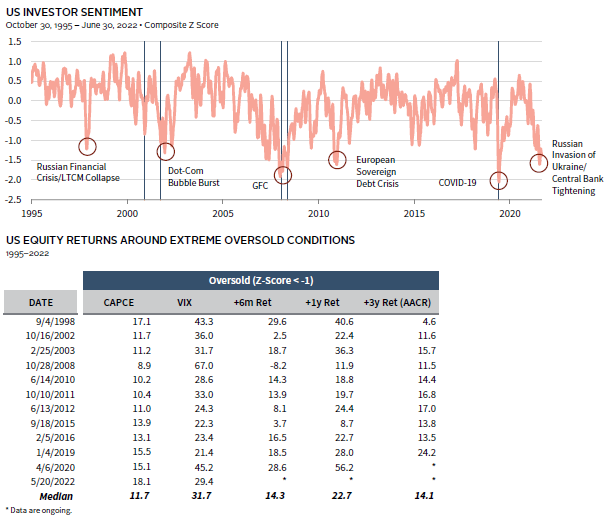
Notes: Data are a composite of the CBOE Volatility Index, CBOE Put/Call index, and AAII Investor Sentiment Survey on a 22-day moving average. Blue lines represent equity bear market bottoms. Dates are based on the initial date the Z-score moved beyond -1/+1. Data for 2022 are not included in median calculations.
Ten-year Treasury yields may be starting to trend down
Historically, bear markets have not bottomed until ten-year yields peak. Timing of rate declines has varied. Prior to 1982, when yields were in a secular uptrend, peaks tended to be coincident indicators. For bear markets since 1982, a period of secular rate declines, the ten-year Treasury tended to peak earlier, providing some advance warning. Rates may be in a nascent down trend, as the ten-year yield has fallen 70 basis points (bps) peak-to-trough from its mid-June peak of 3.5% amid rising recession concerns that have brought down inflation and Fed tightening expectations.
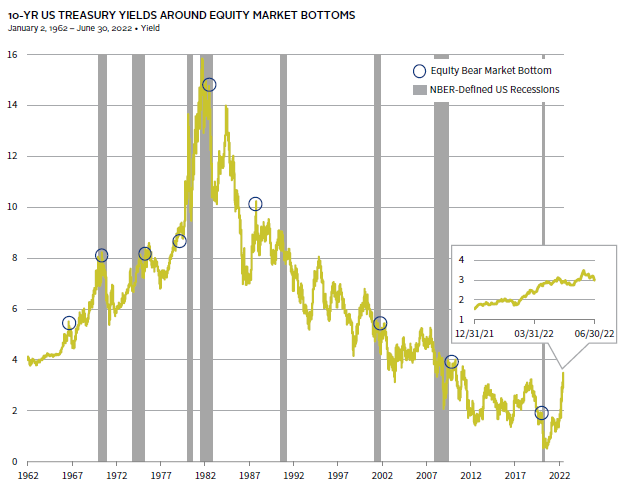
Notes: Equity bear market bottoms are based on MSCI US Index since 1970 and S&P 500 Index prior. Data are daily.
High-yield bond spreads are widening, but below typical bear market bottom levels
At 569 bps, high-yield bond option-adjusted spreads (OAS) are well off their cycle lows and are at the low end of spread levels seen at the start of recessions. Current spreads also remain well below averages marking historical bear market bottoms. However, if a recession is avoided, high-yield spreads are right about where we would expect to see them at the market bottom based on historical precedent. In contrast, during recessionary bear markets, spreads widened to an average of 12.6 percentage points.
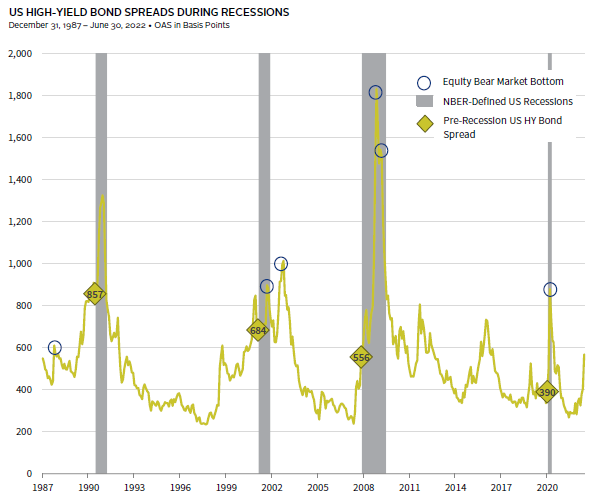
Notes: Equity bear market bottoms are based on MSCI US Index since 1970 and S&P 500 Index prior. Data in diamonds represent US HY bond spreads at the end of the last month before each recession began.
Is a recession imminent? Yield curve signals should not be ignored
One of the most reliable advance indicators of recessions is the yield curve, with inversion signaling a recession ahead. While many economists favor the ten-year/three-month spread over the ten-year/two-year spread, the two tend to be highly correlated. The recent gap in these signals has been significant, with the ten-year/two-year inverting slightly intra-month three times this year, with the most sustained period starting on July 6. While the ten-year/three-month spread remained unremarkable this year, following the June CPI release of 9.1%, this indicator significantly narrowed as investors have priced in accelerated expectations for Fed tightening.
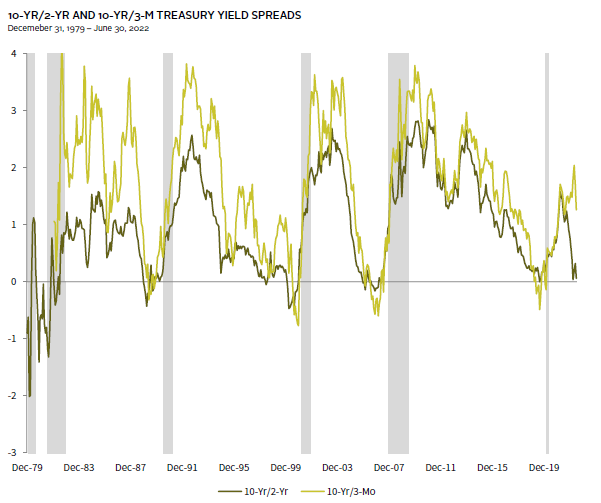
Notes: Ten-year/three-month data begin January 31, 1982. Grey bars represent NBER-defined US recessions. Data are monthly.
Yield spreads are not a useful timing tool
Over the last 56 years, the ten-year/two-year segment of the yield curve has inverted nine other times, each of which signaled a recession within six to 24 months—too wide a range to provide a useful timing signal. The market has tended to peak following yield curve inversions, but also with a long lead time. The current period and the 1973 inversion were the only two instances where the market peaked in advance of the inversion.
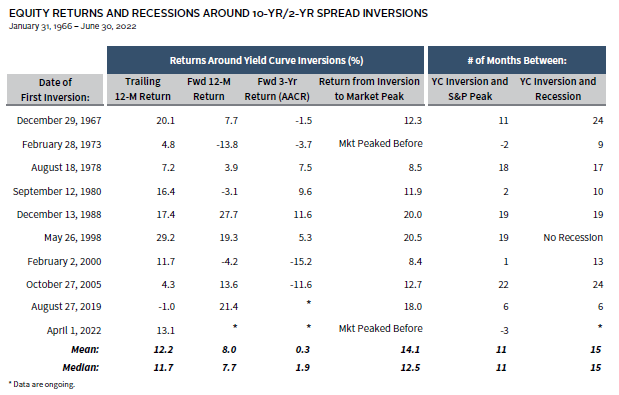
Notes: Data reflect monthly price returns of the S&P 500 Index from January 1966 through May 1976 and daily price returns from June 1976 to present. Two-year US Treasury yields are represented with monthly data from Global Financial Data from 1966 to May 1976 and daily data from June 1976 to present.
US Weekly Economic Index reflects normalizing growth, not recession
The Weekly Economic Index has served as a useful leading indicator for GDP growth. A pessimist looking at this chart will focus on its sharp decline and conclude the economy is headed straight for recession. An optimist would focus on the growth deceleration to more sustainable levels that should alleviate some inflationary pressures. The preponderance of data supports the optimists, for now; however, economic drags such as monetary and fiscal tightening, a strong US dollar, and high prices work with a lag. Should the data continue to trend in the same direction, a recession will eventually materialize.
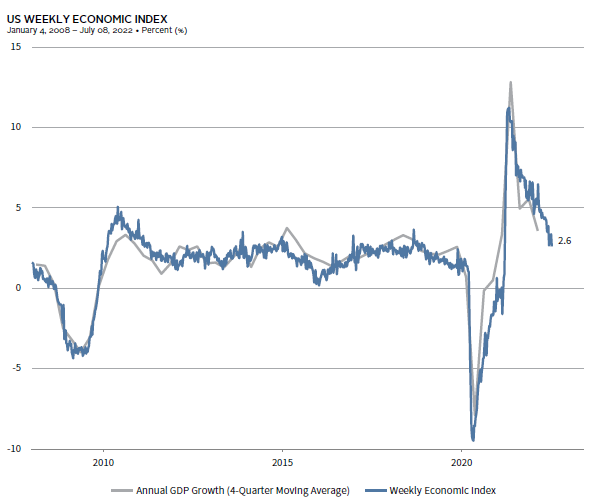
Notes: The WEI is an index of ten weekly indicators of real economic activity, scaled to align with the four-quarter percent change of real GDP. The indicators included are: Redbook same-store sales, Rasmussen Consumer Confidence, new claims for unemployment insurance, continued claims for unemployment insurance, adjusted income/employment tax withholdings, railroad traffic originated, the American Staffing Association Staffing Index, steel production, wholesale sales of gasoline, diesel, and jet fuel, and weekly average US electricity load.
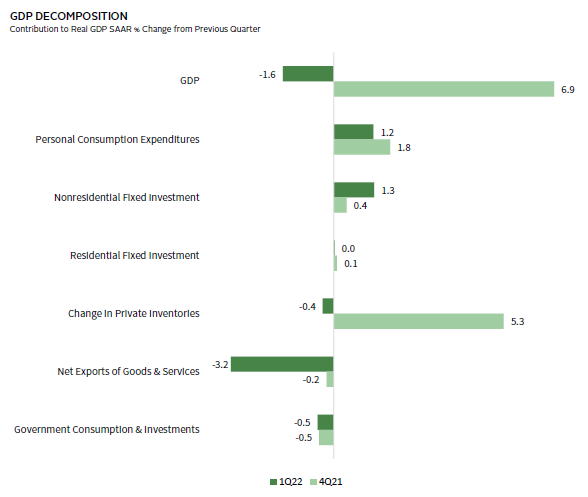
First quarter 2022 negative GDP reflects still-strong domestic growth
GDP turned negative in first quarter 2022, yet its composition reveals still-strong domestic demand. Weak net exports, which would be expected in a strong US dollar environment, were the key culprit. Inventories were an additional drag as retailers have reported they are overstocked with delayed shipments that don’t meet evolving investor preferences. Even if GDP is negative in second quarter, as the Atlanta Fed GDPNow metric now predicts, two consecutive quarters of contraction may not mark an official recession and/or a shallow recession, provided domestic demand remains strong.
COVID-19 consumption trends are reversing
Consumer demand is undergoing a shift from goods to services—a reversal of COVID-19 trends. The reversal has been resulting in a decline in manufacturing metrics, making it imperative to look at demand for goods and services combined. As demand for goods declines to more normal levels, goods price inflation should moderate. Since services prices did not drop as demand fell, it is not clear how far it will rise as demand normalizes, although labor market tightness could push up costs that businesses may seek to pass along.

Notes: Demand data are based on personal consumption expenditures. All consumption is based on pre-pandemic trends data from Q1 2010–Q4 2019. Goods and services are based on pre-pandemic trends data from Q1 2015–Q4 2019.
Excess savings built up during pandemic support consumption
Consumer demand is supported by $2.2 trillion in excess savings—much of which is liquid —that households accumulated during the pandemic; median wages growth of 6.8% annualized on a rolling three-month basis; and depreciating goods prices. However, if consumer confidence remains low in the face of still-elevated inflation, reduced government spending, and tightening financial conditions, households could hold on to their surplus savings and a recession could be closer than we anticipate.
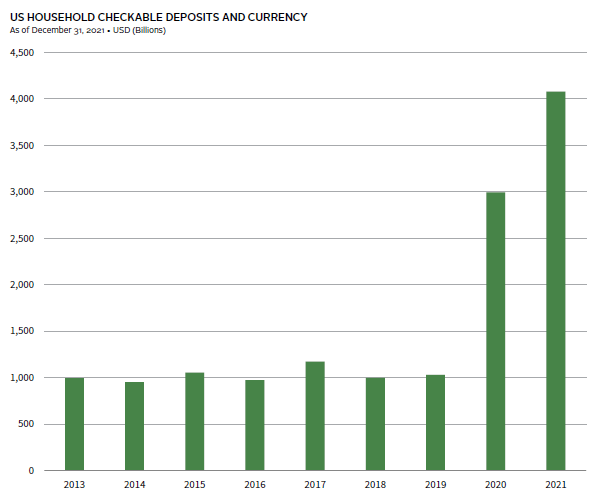
Note: Data are annual.
Inflation expectations are falling along with economic growth expectations
As economic growth has been decelerating and the Fed has taken a more aggressive stance against inflation, expressing a willingness to tighten into economic weakness, markets have started to price in softening demand by reducing expectations for Fed tightening and inflation. Inflation expectations priced into five-year bonds peaked in late March at nearly 3.6% before coming back down 90 bps, while ten-year bond inflation expectations have remained more muted, but followed a similar pattern. Surprisingly high June headline inflation of 9.1% has the potential to push up inflation expectations, but the initial reaction has been to front load Fed tightening expectations.
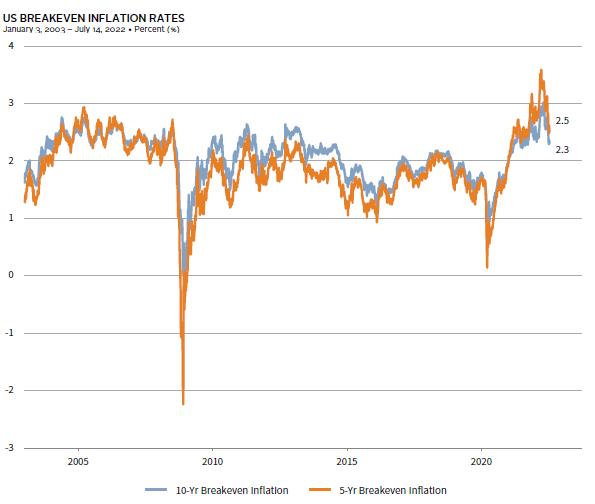
Note: Breakeven inflation is the difference between Treasury and TIPS yields of the same maturity.
No sign of recession in strong US employment stats
The United States has always entered a recession when the trailing three-month unemployment rate has increased by more than 33 bps, suggesting it is highly unlikely we are in an NBER-type recession. However, unemployment is a coincident indicator. Initial unemployment claims have been modestly increasing, but are being reabsorbed as continuing claims are falling. The Fed’s projections indicate expectations that the unemployment rate will increase 50 bps without triggering a recession. While it is possible unemployment increases come primarily from decreases in job openings and/or increases in labor force participation, this would be unprecedented.
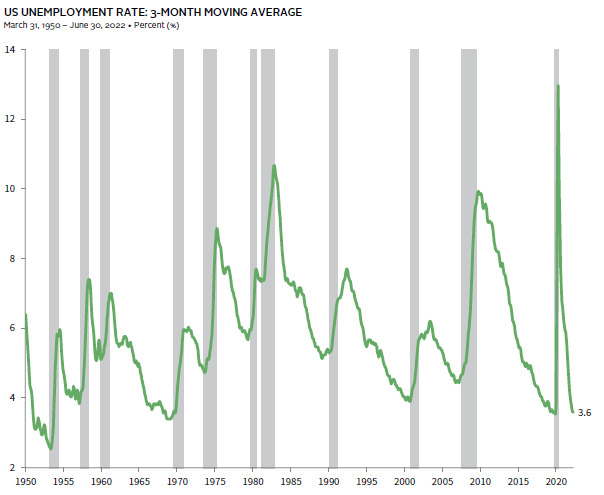
Note: Grey bars represent NBER-defined US recessions.
The lowest paid workers are seeing the highest boost to earnings
Increasing wages can lead to increased prices, putting further pressure on employers to increase wages in a classic wage-price spiral. However, real private wages have been stagnant—the index of aggregate weekly payrolls (product of jobs, income, and hours worked) has increased 9% year-over-year in June, close to the rate of inflation. Low-income workers account for the majority of workers who left the workforce during the pandemic. Increased wages and diminishing pent-up savings among these workers could entice them back into the workforce, adding some slack to the labor market.
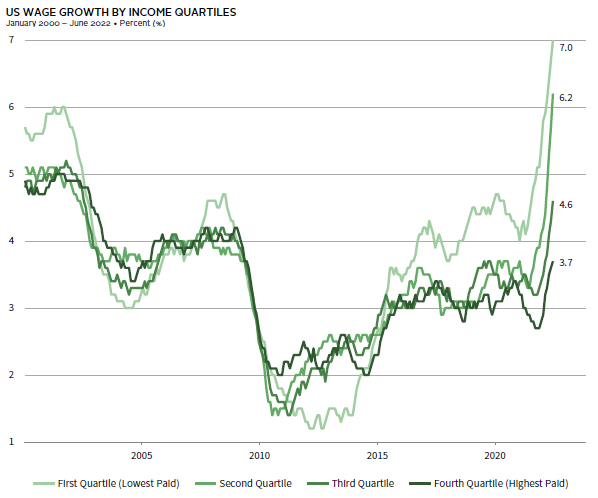
Note: Data are the 12-month moving average of median wage growth for each category and based on hourly data.
Perfect timing not required
On average, investing in equities and other risk assets after a 20% US equity decline has produced strong returns the subsequent year. Of course, the best results are earned by investing with perfect timing but, realistically, being early or late has been profitable, on average, following an initial 20% drawdown. Using momentum as an additional tool has produced positive benefits. Momentum has not yet turned positive over a 12-month horizon, so investors may choose to be patient in rebalancing, but we would begin doing so.
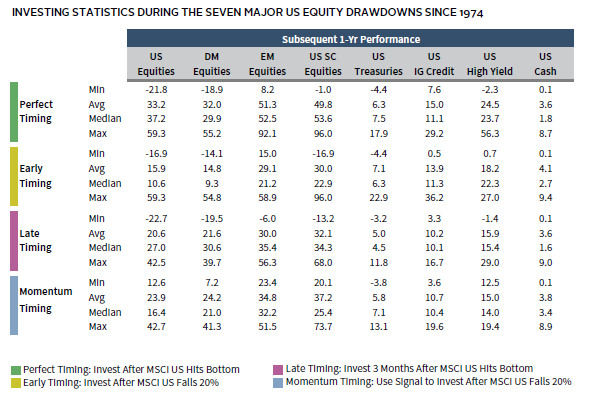
Notes: Data are monthly and reflect MSCI US Index (US Equities), MSCI World Index (DM Equities), MSCI Emerging Markets Index (EM Equities), S&P SmallCap 600® Index (US SC Equities), Bloomberg US Treasury Index (US Treasuries), Bloomberg US Investment Grade Corporate Bond Index (US IG Credit), Bloomberg US High Yield Index (US High Yield), and Federal Reserve Treasury bill secondary market total returns (US Cash). Scenarios reflect the average performance across the seven major downturns where the MSCI US price level dropped 20% before a 20% increase based on monthly data. The US Equity Momentum scenario highlights returns after US equity momentum—which is defined as the annual MSCI US price change—has turned positive following each downturn.
Celia Dallas - Celia Dallas is the Chief Investment Strategist and a Partner at Cambridge Associates.
About Cambridge Associates
Cambridge Associates is a global investment firm with 50+ years of institutional investing experience. The firm aims to help pension plans, endowments & foundations, healthcare systems, and private clients achieve their investment goals and maximize their impact on the world. Cambridge Associates delivers a range of services, including outsourced CIO, non-discretionary portfolio management, staff extension and alternative asset class mandates. Contact us today.