VantagePoint: Fourth Quarter 2018

Advice in Brief
Because the US economy has entered the late stage of the economic cycle, investors should consider the prospect of a bear market recession, even though one does not seem imminent.
We have been evaluating the appeal of different asset classes through a late-cycle lens. In this edition of VantagePoint, we evaluate several potentially defensive equity strategies to see whether they are attractive today.
- We find that US equities, while defensive, are too expensive to overweight at this juncture. Furthermore, because of their expense, retaining a small underweight seems sensible. As an additional measure of defense, hedging the non-US developed markets currency exposure associated with any overweight would be helpful to USD investors in the event of a bear market. Similarly, adjusting hedge ratios to be neutral USD positioning would be advantageous to non-USD-based investors adopting a US equity underweight.
- High-quality stocks are expensive, but relatively attractive if we control for tech sector overweights. US mega-cap growth stocks, as represented by the Russell Top 200® Index, are too tech heavy to be reliably defensive. We prefer a more sector-neutral approach, such as the MSCI Sector Neutral Quality Index or a quality-focused active manager.
- Counterintuitively, value stocks just may be cheap enough to outperform the broad market in the next down cycle, but it is too early to overweight them just yet.
It’s never too early to have a plan. As discussed in recent publications, we believe that the US economy has entered the late stage of the economic cycle. By contrast, other markets generally have more room to grow without spurring inflationary pressures that often bring the cycle to a close. In this environment, risky assets tend to generate low positive returns, but with increased volatility and pressure on valuations. Given how prolonged this cycle has been to this point, the late stage of the cycle may be extended too, particularly if economic growth slows to a more moderate pace and the reversal of unconventional monetary policies progresses slowly.
Although timing of the end of the cycle is highly uncertain, it is late enough that prospects for a bear market recession should be considered. We have been evaluating the appeal of different asset classes through a late-cycle lens to determine if procyclical assets that tend to perform particularly poorly in bear markets are cheap enough to compensate investors for this risk, while also looking for defensive assets that are attractive in this environment. In this edition of VantagePoint, we evaluate several potentially defensive equity strategies to see if they are attractive today. Investors might be tempted to overweight US equities at this stage in the cycle due to their defensive posture; however, we believe their high valuations merit a continued small underweight. High-quality stocks are expensive, but they are relatively attractive if we control for tech sector overweights. Counterintuitively, value stocks just may be cheap enough to outperform in the next down cycle, but it is too early to overweight them just yet. Fundamentally, investors should closely monitor liquidity needs to keep uses and sources of liquidity in balance to meet cash obligations in the event of a bear market recession, while remaining neutral on risky assets.
US Equities Defensive, but Expensive
US equities have a strong track record of outperforming both other developed markets equities and emerging markets equities during bear markets, especially in common currency terms, given the defensive characteristics of the US dollar. However, there are two major considerations that keep us underweight on US equities today, despite their defensive history. The first and most important is that US equities are among the most expensive globally, meaning that from a long-term perspective, expected returns are lower than that of other equity markets, most of which are at least fairly valued. Second, since US equities are priced for perfection, there are a number of scenarios in which US equities could disappoint in the near term, especially should a recession take time to materialize.
For adequate data, we look at bear market declines of 20% or greater and market corrections of 10% or greater in the MSCI ACWI in local currency terms. There are 12 such periods, three of which were bear markets. We examine peak-to-trough returns for each market to capture the full drawdown associated with each MSCI ACWI bear market, rather than a common set of dates, to capture timing mismatches.
US EQUITIES TEND TO BE DEFENSIVE IN BEAR MARKETS
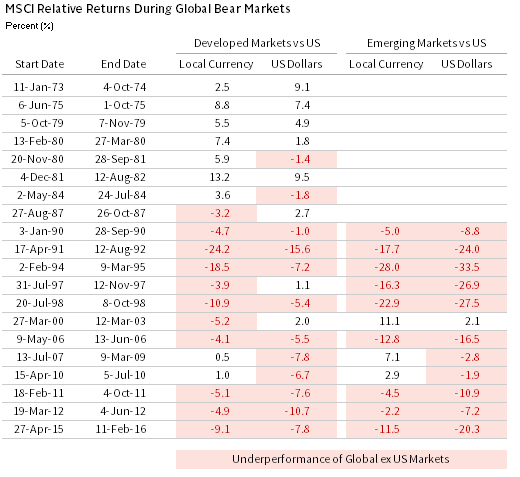
Sources: MSCI Inc., Ned David Research, and Thomson Reuters Datastream. MSCI data provided “as is” without any express or implied warranties.
Notes: “Global Bear Markets” are based on the MSCI World Index from 1973 to 1987 and are based on the MSCI All Country World Index thereafter. Bear markets are defined as a decline in price level of 10% or greater without an intervening increase of at least 10%. “Developed Markets” are represented by the MSCI EAFE ex Japan Index, the “US” is represented by the MSCI US Index, and “Emerging Markets” are represented by the MSCI EM Index. Relative performance figures are based on monthly price returns from 1973 to 1983 and daily price returns thereafter. Performance is calculated based on the respective peak-to-trough dates for each index associated with each global bear market.
Relative to emerging markets, US equities outperformed in nine of these 12 periods in local currency terms and 11 out of 12 in USD terms. The only period in which US equities underperformed emerging markets in USD terms was in the 2000–03 dot-com bust, as US mega-cap tech stocks were the locus of the excess. Similarly, over this period, MSCI EAFE only outperformed the US market during two of 12 bear markets in local currency and USD terms. However, the sample size of declines of 10% or greater defined by the MSCI ACWI is limited by the short emerging markets history. When looking back further using the MSCI World Index to identify developed market declines of 10% or greater, we find non-US markets outperformed the United States in each of seven from 1973 to 1984, bringing its hit rate up to nine out of 20 in local currency terms, and eight out of 20 in USD terms.
Clearly US equities have been defensive, but today this defense comes at quite a high price. Relative to non-US equities, US equities are about as expensive as they have ever been. High relative valuations mean that future return prospects for US equities are relatively low over a long-term horizon where valuations tend to hold more sway (e.g., between seven and ten years). Such high US equity valuations leave little cushion for equity fundamentals to disappoint. For example, US equities appear to have been largely immune to market volatility related to trade war actions and rhetoric even though they remain at risk due to disruption in supply chains, higher tariffs, and punitive retaliatory action by other governments (namely China, where affiliates of US companies earned approximately $500 billion in revenue last year). We agree with the consensus that economic implications are likely to be somewhat muted, assuming tariffs continue to be concentrated on the US and China trade relations. However, the risk for US equities appears more significant than is being reflected.
US EQUITIES ARE DEFENSIVE, BUT EXPENSIVE
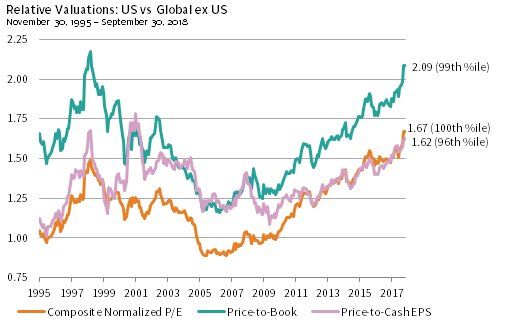
Sources: MSCI Inc. and Thomson Reuters Datastream. MSCI data provided “as is” without any express or implied warranties.
Notes: “US” is represented by the MSCI US Index and “Global ex US” is represented by the MSCI All Country World ex US Index. The composite normalized price-earnings (P/E) ratio is calculated by dividing the inflation-adjusted index price by the simple average of three normalized earnings metrics: ten-year average real earnings (i.e., Shiller earnings), trend-line earnings, and return on equity–adjusted earnings. All data are monthly.
Furthermore, US regulations may also constrain US tech activities and profits. A controversial report in early October by Bloomberg Businessweek alleging that Chinese companies are inserting microchips into US computing components to spy on the United States may create backlash for US companies. Similarly, Vice President Mike Pence called on US companies to reconsider business activities that involve turning over intellectual property to Chinese companies or helping Beijing’s censorship efforts. Moreover, if the trade environment were to improve, US equities would not be expected to rebound, but other markets where the pain of tariffs have been priced in, particularly in China, stand to benefit considerably.
An additional potential source of disappointment for US equities relates to slower earnings growth prospects in 2019, as the benefits from tax cuts and fiscal stimulus begin to fade. To the extent that input costs increase and wage pressures accelerate in the United States, margins could also get squeezed. Debt-financed stock buybacks may also be a weaker support to earnings at a higher cost of capital.
Though it is clear that US equities have historically been defensive, they are priced to perfection and are particularly expensive relative to other markets. Given this combination of characteristics, we would not overweight US equities, despite their defensive character. Furthermore, because of their expense, retaining small underweights seems sensible. Our recommendation that US investors hedge the non-US developed markets currency exposure resulting from this tilt provides a further measure of defense that would be helpful in the event of a bear market, given the tendency for the US dollar to strengthen in such an environment. Similarly, we would recommend investors with non-USD-based currencies also maintain neutral USD positioning rather than underweight relative to policy benchmarks when adopting a US equity underweight.
Adjust Quality for Tech Overload
Quality has historically been quite defensive, at least in relative terms. However, today we are not so sure. Quality has become increasingly expensive and concentrated in tech stocks, including Facebook, Amazon, Apple, Netflix, and Alphabet (FAANG). This raises the questions of whether the factor will continue to be defensive.
When markets become significantly concentrated in one sector, that sector tends to underperform during the next bear market. Based on analysis of the S&P 500 Index, when sectors account for more than 20% of the index’s market capitalization, they may continue to grow more concentrated, but when the next bear market arrives, these winning sectors tend to be the worst performers. In other words, history suggests that tech will underperform in the next bear market, and quality may fail to be defensive.
QUALITY TENDS TO BE DEFENSIVE IN DOWN MARKETS
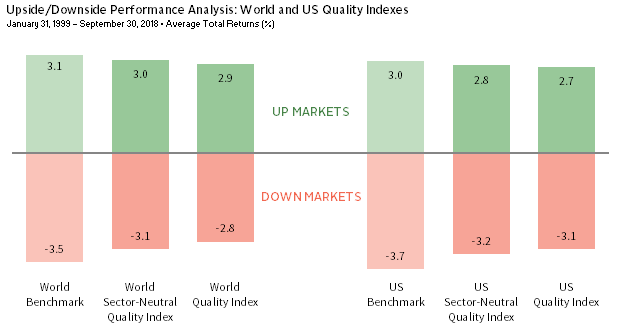
Sources: MSCI Inc. and Thomson Reuters Datastream. MSCI data provided “as is” without any express or implied warranties.
Notes: Total returns are in USD terms and are net of dividend withholding taxes. All data are monthly.
We have used the Russell Top 200® Growth Index as a proxy for quality in the US market since the mid-2000s, while recognizing that its appropriateness for this mandate must be monitored, since the mega-cap growth index is not a quality index by design. Indeed, by year-end 1999, the Russell Top 200® Growth Index had a 39.6% weight to tech stocks and a P/B ratio of 11.4. It should come as no surprise that the index underperformed the broad US market by 12.3 percentage points from early 2000 to the market’s bottom in 2002. Today, the index has a 37.8% weight to the tech sector, with 30% in the FAANG stocks. Given this concentration, we are concerned the index may suffer similar underperformance in the next bear market.
As a result, we have evaluated MSCI’s quality family of indexes and find that the MSCI US Sector Neutral Quality Index provides superior exposure to quality today. Skilled active managers that are sensitive to valuation are also a good choice, and in select cases, may offer higher potential returns than the index. MSCI offers quality indexes based on characteristics that we agree represent high quality—low leverage, high ROE, and stable earnings growth. The sector-neutral versions of their quality indexes use the same quality selection criteria, but constrain sector weights to match that of the broad market index. The MSCI US and World Quality Indexes were able to outperform 1 the broad market in the aftermath of the tech and telecom bubble, as well as during the global financial crisis; however, like the Russell Top 200® Growth Index, current overweights to tech are quite high, at roughly 20% greater than the broad market. 2 The sector-neutral version of quality is still concentrated, but no more so than the broad market and has the relative benefit of a quality orientation. Furthermore, though quality is expensive in absolute terms and relative to the broad market, it is more reasonably priced relative to growth. We have been recommending an overweight to quality relative to small-cap growth within US equities, but today mid-cap and large-cap growth is a more appealing underweight on a valuation basis, so our revised recommendation is to overweight sector-neutral quality versus large- and mid-cap growth stocks.
WITH HIGH WEIGHTS TO TECH, IS QUALITY STILL DEFENSIVE?
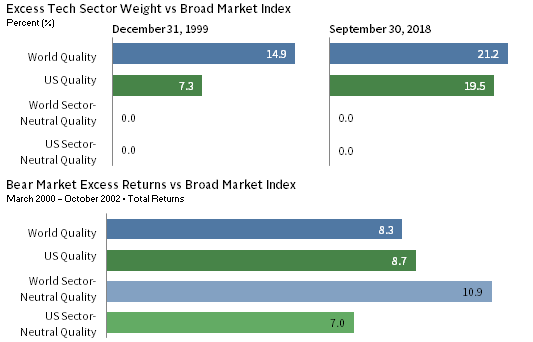
Sources: FactSet Research Systems and MSCI Inc. MSCI data provided “as is” without any express or implied warranties.
Notes: Total returns are in USD terms and are net of dividend withholding taxes. Performance data are monthly prior to January 1, 2001, and are daily thereafter.
The active managers we track in this sector of the market are not explicitly trying to position themselves to be defensive. They tend to be low turnover strategies that are always biased to more stable, more predictable cash flow streams and remain disciplined on valuation. As such, they tend to be more defensive. To the extent investors use active managers to implement quality, this is a reasonable time to evaluate the degree to which they own sizeable allocations to FAANG stocks. In general, such managers tend to have relatively limited exposure to FAANG stocks today, but may own them when attractively valued. For example, some managers acquired Facebook shares this spring after the market sold off on privacy concerns.
Quality has tended to be defensive in bear markets, but there are two key considerations for investors regarding prospects for the strategy to be less defensive in the next bear market. Even after adjusting for tech concentration, quality stock valuations are high today in absolute terms and higher in relative terms compared to the broad market than was the case ahead of the last two major bear markets in which quality outperformed. This is one of the main reasons we recommend quality relative to growth stocks, but not necessarily relative to the broad market (growth stocks are both lower quality and relatively expensive). The second consideration is that high-quality stocks are very long duration assets, and as such would do quite poorly in an environment of rising interest rates. In five of the last six periods since 2000 when the US ten-year Treasury yield increased 100 bps or more, the US Sector Neutral Quality Index underperformed the broad market—a worse track record than incurred by the Russell 1000® Growth Index, which underperformed the broad market in half of the last six rising rate periods. Even with these considerations, we maintain a preference for quality over growth.
SECTOR-NEUTRAL QUALITY ISN’T CHEAP, BUT OFFERS RELATIVE VALUE

Sources: FTSE Russell, MSCI Inc., and Thomson Reuters Datastream. MSCI data provided “as is” without any express or implied warranties.
Note: For relative “Price-to-Cash EPS” valuations, data for the Russell 2000® Growth Index are price-to-cash flows.
*Relative price-to-cash EPS ratio data begin January 31, 2002.
Value for Defense? Really?
Value, typically a laggard during recessions, may ultimately prove to be defensive within equities this cycle. Since our data begin in 1978, 3 value underperformed growth in five of seven bear market declines of roughly 20% or greater. The exceptions are the bear markets from 1980 to 1982 and from 2000 to 2002; during both periods, valuations for value relative to growth began below their 10th percentile—a level where valuations trade today in the United States and in developed markets in aggregate. For value to resume leadership over growth, financials and energy sectors must resume leadership over the tech sector, given the relative weights of these sectors in the growth and value indexes.
VALUE MAY BE CHEAP ENOUGH TO OUTPERFORM IN A BEAR MARKET

Sources: FTSE Russell and Thomson Reuters Datastream.
Notes: The composite normalized price-earnings (P/E) ratio is calculated by dividing the inflation-adjusted index price by the simple average of three normalized earnings metrics: ten-year average real earnings (i.e., Shiller earnings), trend-line earnings, and return on equity–adjusted earnings. Relative performance are total returns gross of dividend withholding taxes. All data are monthly. Bear markets are based on a peak-to-trough change in the S&P 500 Price Index in USD terms of at least 19%.
Sector differences across MSCI World Growth and Value indexes account for 90% of value’s underperformance since 2007, with poor performance from financials in the aftermath of the global financial crisis generating much of the negative attribution. Over the last five years, technology accounted for almost 30% of sector effects, while financials and energy together accounted for 40%. With sector differences neutralized, growth and value indexes are performing neck-and-neck.
From a longer-term perspective, large energy stocks face pressures from technological innovations like fracking and horizontal drilling, and the financial sector has had its wings clipped by regulatory constraints that have reduced its profitability and helped non-bank competitors gain market share. At the same time, advances in the tech sector have been broad based, building on many of the developments of the 1990s tech innovation wave. These trends have supported the dominance of growth over value.
However, the weakness of bank and energy fundamentals in contrast to tech fundamentals could moderate or reverse, even as technology continues to influence dynamics across all economic sectors. For example, banks are reducing their cost structure, replacing costly branches with more convenient online and mobile banking, and tools like artificial intelligence and big data could improve loan screening and enhance banks’ ability to market new products. Banks that embrace these technological developments should fare well. Financials should also benefit if continued economic growth supports loan growth and a rise in longer-term interest rates (without a yield curve inversion). A further back-up in rates beyond minimal expectations priced into the yield curve could also pressure growth stocks, which tend to have longer duration than value stocks. The recent rise in oil prices could also benefit value stocks if enough price gains are sustained to support continued earnings recovery in the energy sector.
Beyond rising interest rates, the biggest risk to growth stocks may be the potential for further escalation in trade tensions between the United States and its trading partners. Large-cap US multinationals that are fully integrated into global supply chains dominate the growth indexes. As discussed above, market prospects for these companies have not been downgraded by investors despite potential risks to future earnings.
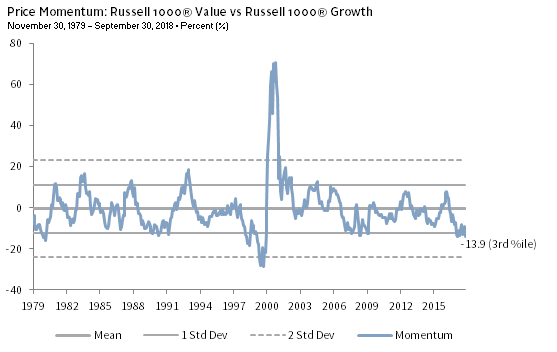
In both the United States and developed markets as a whole, relative valuations are in the bottom decile for value relative to growth, and momentum is so bad that it has reached extremes where reversals are more likely. We remain neutral on value relative to growth, given the combination of cheap valuations and strongly negative momentum. We are watching for a change in momentum to favor value before overweighting the style outright. For investors that have seen their portfolios become overweight in growth as the style has outperformed, we would rebalance to at least neutral positioning today.
WAITING FOR MOMENTUM TO IMPROVE
Sources: FTSE Russell and Thomson Reuters Datastream.
Note: Momentum is calculated as the percent change from the trailing 12-month price level to the trailing one-month price level.
Conclusion
While the next US recession could still be years away, there is no better time than the present to start planning for this eventuality. Defensive equities are hard to come by at a reasonable price now. Despite the defensive characteristics of US equities, they are just too pricey to overweight today. We maintain modest underweights relative to global ex US markets and recommend investors do so while maintaining neutral USD exposure relative to policy benchmarks. High-quality stocks are expensive, but attractive relative to growth stocks if we control for tech sector overweights. Even though value stocks are not regarded as defensive, their ultra-cheap valuations may enable outperformance in the next bear market, if history serves as a useful guide. Although we expect these portfolio tilts to be helpful on the margin, the most important element of defense should be careful liquidity management.
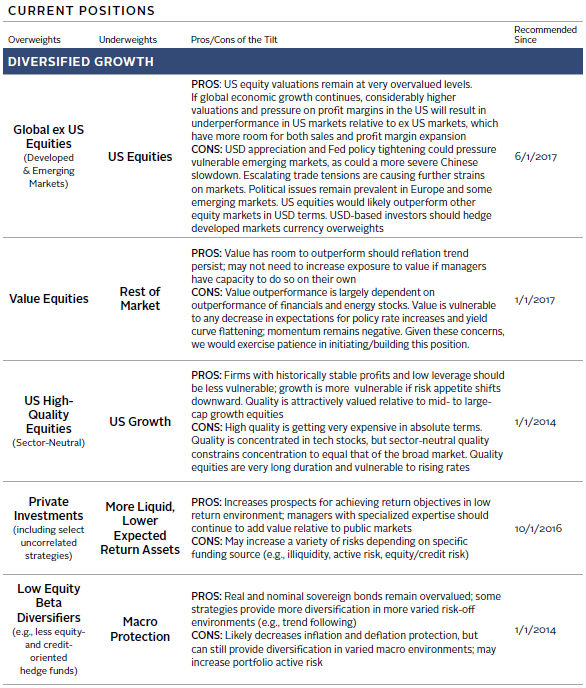
Portfolio Tilts from CA’s Chief Investment Strategist
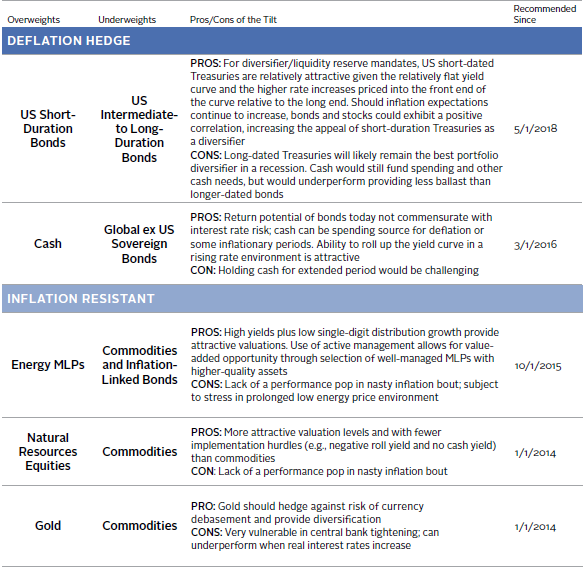
Portfolio Tilts from CA’s Chief Investment Strategist (continued)
Index Disclosures
MSCI All Country World Index
The MSCI ACWI Index is a free float–adjusted market capitalization–weighted index designed to measure the equity market performance of developed and emerging markets. The MSCI ACWI consists of 46 country indexes comprising 23 developed and 23 emerging markets country indexes. The developed markets country indexes included are: Australia, Austria, Belgium, Canada, Denmark, Finland, France, Germany, Hong Kong, Ireland, Israel, Italy, Japan, Netherlands, New Zealand, Norway, Portugal, Singapore, Spain, Sweden, Switzerland, the United Kingdom, and the United States. The emerging markets country indexes included are: Brazil, Chile, China, Colombia, Czech Republic, Egypt, Greece, Hungary, India, Indonesia, Korea, Malaysia, Mexico, Peru, Philippines, Poland, Qatar, Russia, South Africa, Taiwan, Thailand, Turkey, and United Arab Emirates.
MSCI World Index
The MSCI World Index captures large and mid-cap representation across 23 developed markets (DM) countries. The developed markets countries include Australia, Austria, Belgium, Canada, Denmark, Finland, France, Germany, Hong Kong, Ireland, Israel, Italy, Japan, Netherlands, New Zealand, Norway, Portugal, Singapore, Spain, Sweden, Switzerland, the United Kingdom, and the United States. The index is reviewed quarterly in February, May, August and November. During the May and November semi-annual index reviews, the index is rebalanced and the large and mid- capitalization cutoff points are recalculated.
MSCI USA Quality Index
The MSCI USA Quality Index is based on the MSCI USA Index, its parent index, which includes large- and mid-cap stocks in the US equity market. The index aims to capture the performance of quality growth stocks by identifying stocks with high quality scores based on three main fundamental variables: high return on equity (ROE), stable year-over-year earnings growth and low financial leverage. The MSCI Quality Indexes are constructed with a fixed number of securities approach. All securities eligible for inclusion in the MSCI Quality Indexes are weighted by the product of their market cap weight in the parent index and their quality score. Issuer weights are capped at 5%. The Quality indexes are rebalanced semi-annually at the close of the last business day of November and May.
MSCI World Quality Index
The MSCI World Quality Index is based on MSCI World, its parent index, which includes large- and mid-cap stocks across 23 developed markets (DM) countries. Developed markets countries include: Australia, Austria, Belgium, Canada, Denmark, Finland, France, Germany, Hong Kong, Ireland, Israel, Italy, Japan, Netherlands, New Zealand, Norway, Portugal, Singapore, Spain, Sweden, Switzerland, the United Kingdom and the United States. The index aims to capture the performance of quality growth stocks by identifying stocks with high quality scores based on three variables: high return on equity (ROE), stable year-over-year earnings growth, and low financial leverage. The MSCI Quality Indexes are constructed with a fixed number of securities approach. All securities eligible for inclusion in the MSCI Quality Indexes are weighted by the product of their market cap weight in the parent index and their quality score. Issuer weights are capped at 5%. The Quality indexes are rebalanced semi-annually at the close of the last business day of November and May.
Russell 2000® Growth Index
The index consists of those Russell 1000® securities with a greater-than-average growth orientation. These securities tend to exhibit higher price-to-book and price-earnings ratios, lower dividend yields and higher forecasted growth values than the value universe.
Russell 1000® Value Index
The index consists of those Russell 1000® securities with a less-than-average growth orientation. These securities tend to exhibit lower price-to-book and price-earnings ratios, higher dividend yields and lower forecasted growth values than the growth universe.
Footnotes
- The MSCI World and US Quality indexes were launched in December 2012, and the sector-neutral versions were launched in December 2014. Performance prior to these dates is based on back tests.
- MSCI and S&P Dow Jones implemented revisions to the Global Industry Classification Standard (GICS) structure as of the close of September 28, 2018. MSCI will implement the GICS changes in their indexes as part of their November 2018 Semi-Annual Index Review. Russell uses their own sector classification methodology. Based on FactSet data, if GICS changes were implemented as of September 30, the communications and tech overweights to MSCI US and World Quality indexes would be 17 percentage points and 19 percentage points, respectively.
- We do not have access to a reliable, consistent data for global growth and value strategies prior to 2003, so we use US data, but believe these observations hold globally.
Celia Dallas - Celia Dallas is the Chief Investment Strategist and a Partner at Cambridge Associates.
About Cambridge Associates
Cambridge Associates is a global investment firm with 50+ years of institutional investing experience. The firm aims to help pension plans, endowments & foundations, healthcare systems, and private clients achieve their investment goals and maximize their impact on the world. Cambridge Associates delivers a range of services, including outsourced CIO, non-discretionary portfolio management, staff extension and alternative asset class mandates. Contact us today.