US PE/VC Benchmark Commentary: Calendar Year 2020

In 2020, the US private equity and venture capital (PE/VC) indexes shook off first quarter declines to enjoy one of their best years ever, with returns in each quarter surpassing the previous one; for the year, the Cambridge Associates LLC US Private Equity Index® returned 27.8% and the Cambridge Associates LLC US Venture Capital Index® gained 50.1%. For PE, 2020 was the fourth-best year and for VC, it was the second. Macro factors, such as historic fiscal stimulus, an active IPO market, and pandemic-related tailwinds for some of the largest sectors in private investing, helped boost performance. Figure 1 depicts performance for the private asset classes compared to the public markets. Cambridge Associates’ mPME calculation is a private-to-public comparison that seeks to replicate private investment performance under public market conditions.
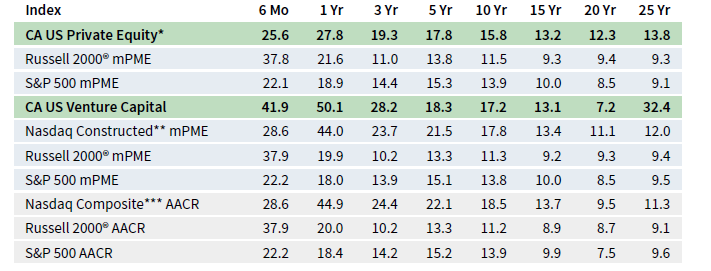
FIGURE 1 US PRIVATE EQUITY AND VENTURE CAPITAL INDEX RETURNS
Periods Ended Demeber 31, 2020 • Percent (%)
Source: Cambridge Associates LLC.
Calendar Year 2020 Highlights
- As of December 31, 2020, the private equity benchmark had outperformed the public indexes in all time periods, except for second half 2020, which was an exceptionally strong period for small-cap companies represented by the Russell 2000® Index. The VC index posted double-digit performance in all but the 20-year period (which was dominated by the tech wreck and the Global Financial Crisis), and it outperformed the Russell and the S&P 500 indexes in each of those horizons. Its record against the tech-heavy Nasdaq Composite Index has remained mixed, driven at least in part by the extremely strong performance of public information technology (IT) companies in 2019 and 2020.
- By the end of 2020, following a strong period for IPOs, public companies accounted for an increased percentage of the VC index (almost 25% of market value); they were less than 10% of the private equity index. The relationship between the indexes was the reverse when looking at exposures to non-US companies. They were nearly double in US PE than in US VC, at close to 20% and 10% of the US PE and VC benchmarks, respectively, as of December 31, 2020.
- IT took top honors among the large sectors in both the US PE and VC indexes.
US Private Equity Performance Insights
Marked by a global pandemic, economic closures, and massive changes to the way people worked, shopped, and interacted with others, 2020 was a watershed year for private investing. Interest rates remained at historic lows; IPO and special purpose acquisition company (SPAC) activity was high; and while IT dominated equity markets, segments of other sectors also performed well. In the public markets, small-cap stocks (represented by the Russell 2000® Index) had a banner second half, and the tech-heavy Nasdaq Composite Index outperformed other public indexes. With its return of nearly 28%, the US PE benchmark extended its streak of double-digit calendar year returns to 12 (2009–20). At year-end, virtually all of the index’s value resided in 14 vintage years (2006–19). Ten of the 14 posted annual results of at least 24.8%.
According to Dealogic, 89 PE–backed companies went public either via IPO or SPAC in 2020 with a combined value of $53.9 billion. There were 13 IPOs worth more than $1.0 billion, and all but two were in either technology or healthcare industries. The three largest were Airbnb Inc, DoorDash Inc., and Royalty Pharma plc. By number and by value, 2020 was significantly more active than the previous year for PE-backed IPOs when there were 33 valued at $15.6 billion. By number and by value, nearly 90% of the year’s IPOs and SPACs took place in technology, finance, or healthcare. The finance sector public offerings are overstated, as they include SPACs, many of which targeted acquisitions in sectors other than finance. Not surprisingly given the COVID-19 pandemic, PE-backed merger & acquisition (M&A) transactions in 2020 numbered about 100 fewer than in 2019 (825 versus 928), with the real shortfall occurring in second quarter as the world adjusted to the pandemic. Nearly 30% (or 238 deals) had publicly disclosed valuations and based on the data available, the average transaction size among those deals was $961 million. When excluding second quarter deals, the average jumped to about $1.1 billion.
Vintage Years
As of December 2020, nine vintage years were meaningfully sized—representing at least 5% of the benchmark’s value—and, combined, accounted for more than 88% of the index’s value. Across the board, second half returns were much stronger than those of the first half, and for the year, returns among the meaningfully sized vintages ranged from 10.3% for vintage year 2007 to 43.5% for vintage year 2018 (Figure 2). The worst- and best-performing groups represented the “oldest” and “youngest” of the large vintages, respectively, and in general, the more recent vintages outperformed the more mature ones.
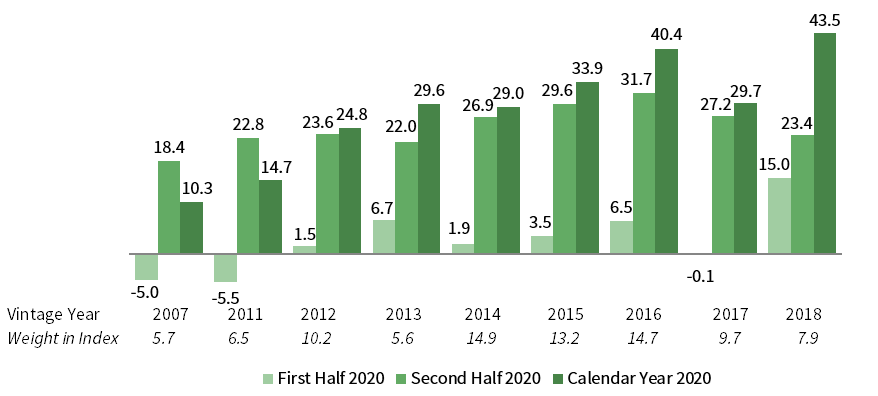
FIGURE 2 US PRIVATE EQUITY INDEX VINTAGE YEAR RETURNS:
NET FUND–LEVEL PERFORMANCE
As of December 31, 2020 • USD Terms • Percent (%)
Source: Cambridge Associates LLC.
The IT sector was the primary return driver for the top two performing vintages (2018 and 2016), but for vintage year 2016, other key sectors—including communication services, consumer discretionary, healthcare, and industrials—posted significant gains, as well.
In the two vintages where calendar year returns were below 20% (vintages 2007 and 2011), writeups were spread among four or five sectors. For the 2007 funds, consumer discretionary, IT, financials, and healthcare (in rank order) saw gains. In the 2011 vintage, sectors that performed well included IT, healthcare, consumer discretionary, industrials, and communication services.
LP Cash Flows
LP contributions and distributions, which were slowed a bit by the COVID-19 crisis in the first half of the year, roared back in the second half. While fund managers called about $10 billion more than they distributed in the first six months, the relationship flipped and distributions outpaced capital calls by more than $22 billion in the second half. When all was said and done, 2020 ended up being the most active year for capital calls (fund managers called $109.9 billion) and the fourth most active year for distributions ($121.6 billion) behind 2014, 2017, and 2015 (in rank order) (Figure 3).
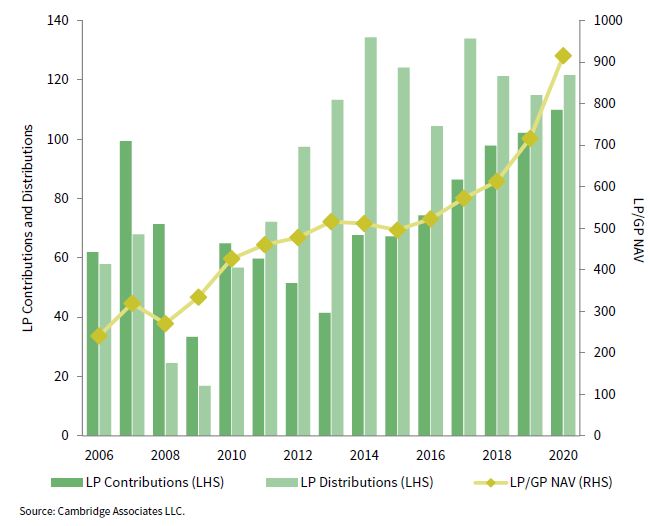
FIGURE 3 US PRIVATE EQUITY CONTRIBUTIONS, DISTRIBUTIONS,
AND NET ASSET VALUE (NAV)
Calendar Years 2006–20 • USD Billions
Source: Cambridge Associates LLC.
Six vintage years (2014–19) represented 93% ($102.7 billion) of the capital calls, with each drawing down at least $8.6 billion in 2020; two of those vintages, 2017 and 2018, together called almost $53 billion. For the year, there were eight vintages (2007–08; 2011–16) that distributed at least $9.8 billion each for a combined total of nearly $101 billion (or 83% of the total); more than $64 billion of it was distributed in the second half.
Sectors
Figure 4 shows the Global Industry Classification Standard (GICS®) sector breakdown of the PE index and a public market counterpart, the Russell 2000® Index. The comparison provides context for the performance of the two indexes. The largest differences are in IT, where the PE index’s exposure is 2.5 times that of the Russell 2000® Index, and in financials, where the public index’s weight is nearly 2.0 times larger than the PE index. The chart also highlights a sizable private equity overweight in communication services and a considerable underweight in real estate, which is reflected in the “other” sector bucket.
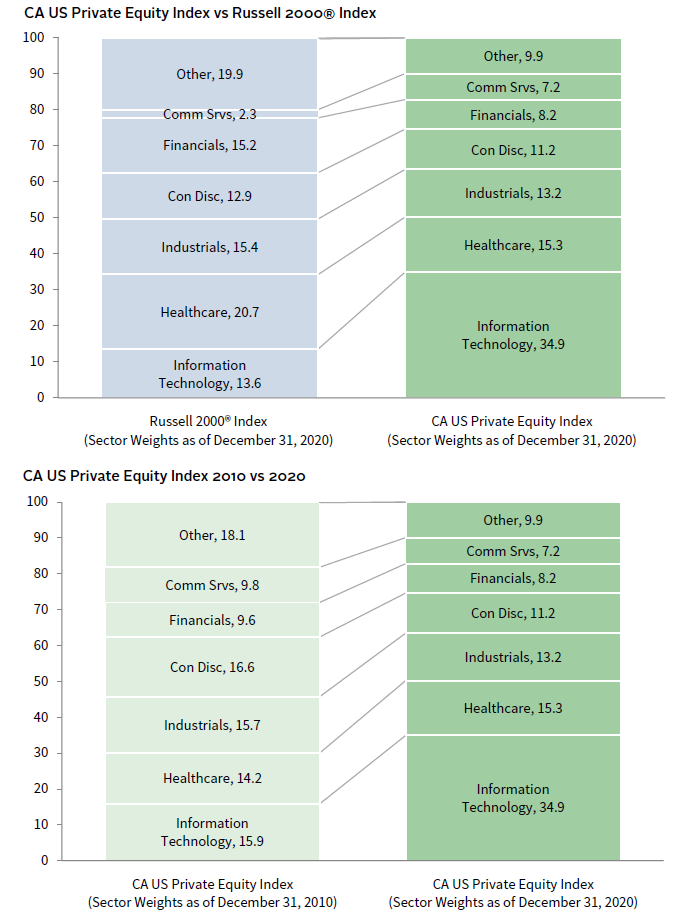
FIGURE 4 GICS® SECTOR COMPARISONS
As of December 31, 2020 • Percent (%)
Sources: Cambridge Associates LLC, Frank Russell Company, and FTSE International Limited.
The second chart in Figure 4 compares the US PE index’s sector weightings in 2010 and in 2020. In the past decade, the index’s exposure to IT has increased significantly while weights in sectors such as consumer discretionary, industrials, energy, and materials (which are in “other”), have shrunk. The large IT allocation helped performance in 2020.
As of December 2020, among the six meaningfully sized sectors, IT remained the largest by a wide margin, representing 35% of the index’s value at year-end. Calendar year returns for the six sectors ranged from 17.7% (financials) to 46.8% (IT) (Figure 5). Write-ups for IT companies were widespread. Every vintage from 2007 to 2019 earned a return of at least 25% on their IT investments. Write-ups in financials were much more muted, with only three vintages earning more than 30% for the year (of which only one, 2015, was meaningfully sized). The vintage with the highest cost basis in the sector, 2014, earned a 25% return in 2020. The pandemic tailwinds were particularly helpful for the consumer staples sector (which represented 3.7% of the index’s value); it returned 35.1% for the year.
In 2020, five sectors garnered more than 80% of the capital invested by the managers in the PE index: IT (34%), healthcare and industrials (each 14%), consumer discretionary (12%), and financials (10%). Since the inception of the index (1986), those sectors have attracted about 74% of capital, with the difference largely attributable to IT.
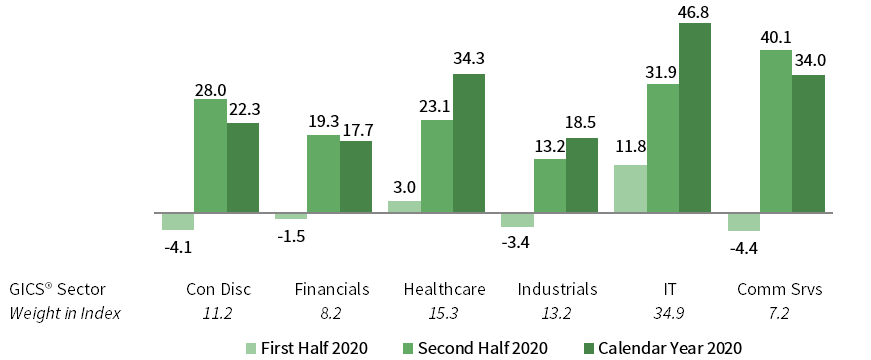
FIGURE 5 US PRIVATE EQUITY INDEX GICS® SECTOR RETURNS:
GROSS COMPANY–LEVEL PERFORMANCE
As of December 31, 2020 • USD Terms • Percent (%)
Source: Cambridge Associates LLC.
US Venture Capital Performance Insights
The CA US VC index returned 50.1% in 2020, marking its second-best calendar year ever (next to 1999), and easily outperforming the public markets. While IT sector investments were the strongest performers, results for healthcare and consumer discretionary businesses were not far behind. Despite the pandemic, VC fundraising hit a record high, investment pace (in terms of dollars invested) surpassed 2019, cash flows in and out of venture managers were strong, and exits (via M&A, IPOs, and SPACs) were plentiful.
According to the National Venture Capital Association and Pitchbook, the number of deals completed in 2020 was lower than those done in 2019, but their value was much higher ($166 billion versus $140 billion). One factor driving that increase in value was later-stage deals, which accounted for 28% of the total, the highest percentage since 2010. Exit activity, measured by public listings (IPOs and SPACs), M&A, and PE buyouts, was particularly strong in 2020. Exits were valued at $301 billion, far exceeding the record hit in 2019 ($266 billion). Among the largest IPOs were DoorDash and Airbnb. In total, the 136 public listings in 2020 were valued at $227 billion; 95 of the listings (valued at $205 billion) took place in the second half of the year. There were 699 venture-backed M&A transactions worth $64 billion, a drop in number but a rise in value when compared with 2019. Sales to financial buyers (PE buyouts) numbered 216 (the same as in 2019), and were worth nearly $11 billion.
Vintage Years
As of December 31, 2020, the ten meaningfully sized vintages represented about 82% of the venture index’s value. For the year, returns among them ranged from 37.7% (2015) to 85.8% (2011). Without exception, second half performance was much stronger than that of the first half (Figure 6). Performance for the more mature vintages (2007, 2010–11) exceeded that of the more recent ones (2012 on).
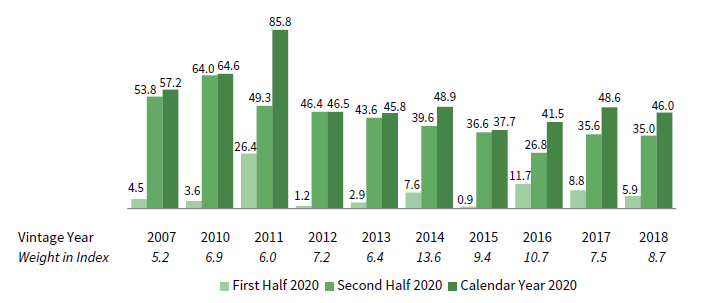
FIGURE 6 US VENTURE CAPITAL INDEX VINTAGE YEAR RETURNS:
NET FUND–LEVEL PERFORMANCE
As of December 31, 2020 • USD Terms • Percent (%)
Source: Cambridge Associates LLC.
For the best-performing vintage (2011), three sectors—IT, healthcare, and consumer discretionary—earned returns of 100% or higher in the year. In IT and healthcare, there were write-ups and realizations, but in consumer discretionary, the returns were largely unrealized. The IT sector was the key driver for most of the vintages prior to 2012, whereas healthcare and sometimes consumer discretionary were more influential in vintages 2012–18. Healthcare company valuation increases were the largest contributor to results in the lowest performer, 2015, with IT write-ups coming in a close second. All other sectors in the 2015 vintage posted more muted returns.
LP Cash Flows
Despite expectations that LP capital calls and distributions would slow during the pandemic, 2020 ended as the most active year ever for LP contributions and the second- most active year for distributions (after 2000) (Figure 7). At $27.2 billion, contributions were 14% higher than 2019 levels, and distributions increased 22% to $40.0 billion. It was the ninth straight year that more capital was distributed than called.
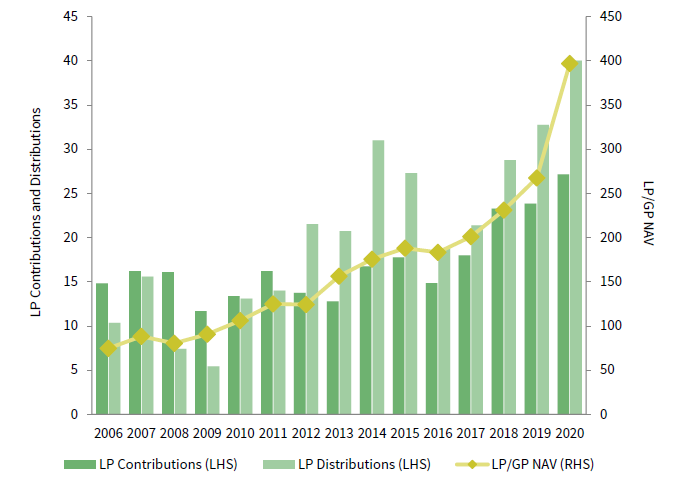
FIGURE 7 US VENTURE CAPITAL CONTRIBUTIONS, DISTRIBUTIONS, AND NAV
Calendar Years 2006–20 • USD Billions
Source: Cambridge Associates LLC.
Nearly all the capital calls during the year were made by funds formed from 2015 to 2020 ($26.1 billion). Each of these six vintage years called at least $1.0 billion; the 2018 vintage led the way with capital calls of almost $8.0 billion. Distributions were more widespread than calls as 12 vintages returned at least $1.0 billion to LPs. Vintage years 2007–08, 2010–11, and 2014 all distributed more than $3.0 billion. The 2010 and 2011 fund groups combined to return $11.1 billion, or 28% of the total for the year.
Sectors
Figure 8 shows the GICS® sector breakdown of the VC index and a public market counterpart, the Nasdaq Composite Index. The breakdown provides context when comparing the performance of the two indexes. The chart highlights the venture index’s meaningful overweight in healthcare, as well as its considerable underweights in communication services and consumer discretionary. The gap between public and private IT exposure has narrowed significantly from 7.5% in 2018 to 1.3% at the end of 2020.
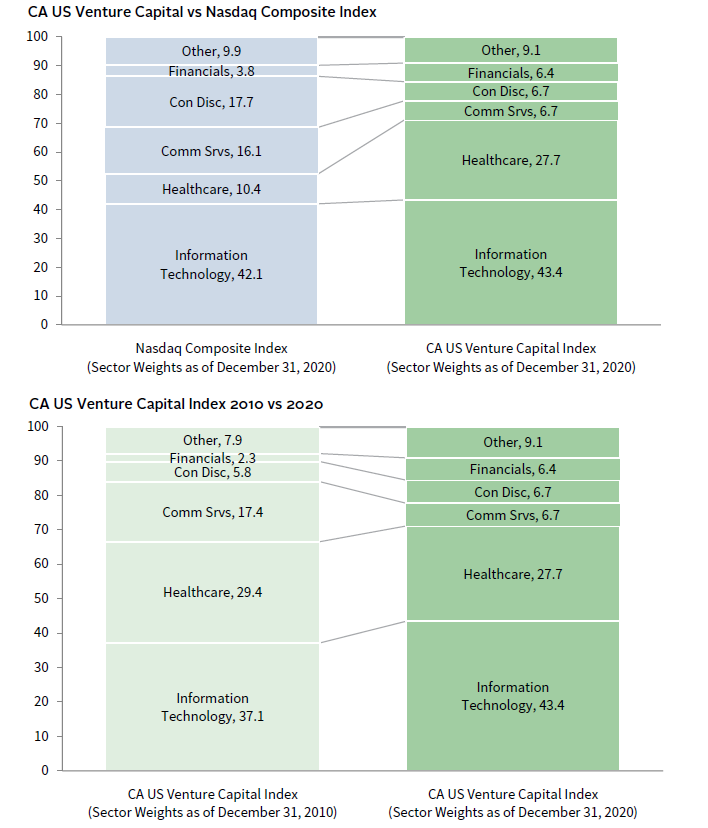
FIGURE 8 GICS® SECTOR COMPARISONS
As of December 31, 2020 • Percent (%)
Sources: Cambridge Associates LLC, Nasdaq, and Factset Research Systems.
The second chart in Figure 8 compares the US VC index’s sector weightings in 2010 and in 2020. Similar to the experience in US PE over the past decade, the index’s exposure to IT has increased. In VC, however, the sector that decreased the most is communication services. Given the resilience that the IT sector has shown thus far in the COVID-19 pandemic, the VC index’s outsized weight in the sector has helped boost its performance.
Sector weightings in the venture index have always been skewed. At the end of 2020, they were still lopsided, with two sectors—IT and healthcare—representing more than 71% of the index, and three others—consumer discretionary, communication services, and financials—together accounting for another 20% (between 6% and 7% for each). Combined, the five large sectors accounted for 91% of the index’s value at the close of 2020, and industrials represented an additional 4% (Figure 9). Capital invested during the year was allocated roughly along the same lines, with about 75% of it going into healthcare and IT businesses and around 16% going into communication services, consumer discretionary, and financials.
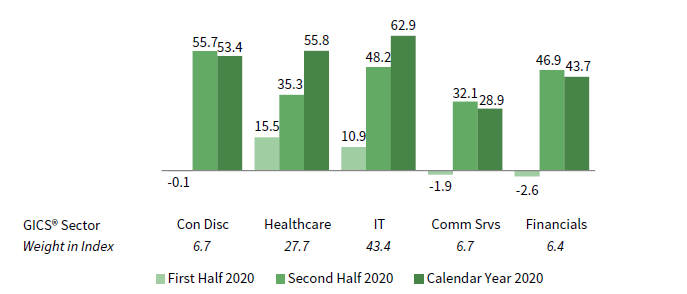
FIGURE 9 US VENTURE CAPITAL INDEX GICS® SECTOR RETURNS:
GROSS COMPANY–LEVEL PERFORMANCE
As of December 31, 2020 • USD Terms • Percent (%)
Source: Cambridge Associates LLC.
Among the key sectors, three earned returns higher than 50.0% for the year (IT, healthcare, and consumer discretionary, in rank order), and only communication services gained less than 30%. The IT sector’s performance was driven by widespread write-ups and realizations, with many vintages since 2007 earning returns in the sector of at least 50%. With the exceptions of vintages 2012–13, every vintage from 2011 on posted annual returns in healthcare of at least 50%. Gains in consumer discretionary and communication services were more concentrated, generally occurring in five or fewer vintages.
Figure Notes
US Private Equity and Venture Capital Index Returns
Private indexes are pooled horizon internal rates of return, net of fees, expenses, and carried interest. Returns are annualized, with the exception of returns less than one year, which are cumulative. Because the US private equity and venture capital indexes are capitalization weighted, the largest vintage years mainly drive the indexes’ performance.
Public index returns are shown as both time-weighted returns (average annual compound returns) and dollar-weighted returns (mPME). The CA Modified Public Market Equivalent replicates private investment performance under public market conditions. The public index’s shares are purchased and sold according to the private fund cash flow schedule, with distributions calculated in the same proportion as the private fund, and mPME net asset value is a function of mPME cash flows and public index returns.
Vintage Year Returns
Vintage year fund-level returns are net of fees, expenses, and carried interest.
Sector Returns
Industry-specific gross company-level returns are before fees, expenses, and carried interest.
GICS® Sector Comparisons
The Global Industry Classification Standard (GICS®) was developed by and is the exclusive property and a service mark of MSCI Inc. and S&P Global Market Intelligence LLC and is licensed for use by Cambridge Associates LLC. The public index exposures are as of December 31, 2020 and represent the index’s sector breakdown after the GICS® reclassification that went into effect after close of business (ET) September 28, 2018. Cambridge Associates LLC implemented the GICS® reclassification for private companies with the release of September 30, 2018 benchmark data. “Other” includes sectors that make up less than 3% of the CA benchmark.
About the Cambridge Associates LLC Indexes
Cambridge Associates derives its US private equity benchmark from the financial information contained in its proprietary database of private equity funds. As of December 31, 2020, the database included 1,244 US buyouts and growth equity funds formed from 1986 to 2020, with a LP/GP value of $916 billion. Ten years ago, as of December 31, 2010, the index included 757 funds whose LP/GP value was $427 billion.
Cambridge Associates derives its US venture capital benchmark from the financial information contained in its proprietary database of venture capital funds. As of December 31, 2020, the database comprised 2,006 US venture capital funds formed from 1981 to 2020, with a LP/GP value of $397 billion. Ten years ago, as of December 31, 2010, the index included 1,323 funds whose LP/GP value was $106 billion.
The pooled returns represent the net end-to-end rates of return calculated on the aggregate of all cash flows and market values as reported to Cambridge Associates by the funds’ general partners in their quarterly and annual audited financial reports. These returns are net of management fees, expenses, and performance fees that take the form of a carried interest.
About the Public Indexes
The Nasdaq Composite Index is a broad-based index that measures all securities (over 3,000) listed on the Nasdaq Stock Market. The Nasdaq Composite is calculated under a market capitalization– weighted methodology.
The Russell 2000® Index includes the smallest 2,000 companies of the Russell 3000® Index (which is composed of the largest 3,000 companies by market capitalization).
The Standard & Poor’s 500 Composite Stock Price Index is a capitalization-weighted index of 500 stocks intended to be a representative sample of leading companies in leading industries within the US economy. Stocks in the index are chosen for market size, liquidity, and industry group representation.
About Cambridge Associates
Cambridge Associates is a global investment firm with 50+ years of institutional investing experience. The firm aims to help pension plans, endowments & foundations, healthcare systems, and private clients achieve their investment goals and maximize their impact on the world. Cambridge Associates delivers a range of services, including outsourced CIO, non-discretionary portfolio management, staff extension and alternative asset class mandates. Contact us today.