Rising Rates and the Implications for Fixed Income


In Outlook 2021: A Year of Healing, we expressed the view that yields would most likely rise this year on the back of strengthening economic activity. At the time of writing in December 2020, ten-year US Treasuries were yielding 0.84%, just slightly above their all-time daily low of 0.52% reached in August 2020 and still well below pre-pandemic levels. Since then, yields have moved meaningfully higher as the economic recovery has continued to gain steam.
In this paper, we analyze the drivers behind the recent rise in yields and compare the current bond sell-off to major bond sell-offs of the past to assess whether the rise in yields can continue. While the bond sell-off has cooled somewhat in April, we believe developed markets (DM) sovereign bond yields will move modestly higher in 2021 and 2022. We anticipate vaccine distribution and economic momentum will continue to put upward pressure on yields, but that further upside will likely be constrained by major central banks, who will probably remain cautious about tightening existing easy policies. While unlikely in our view, a redux of the 2013 Taper Tantrum can’t be completely discounted. Given this outlook, we prefer inflation-linked bonds and China sovereign bonds from a tactical perspective within core fixed income portfolios.
Why are Yields Rising?
After rallying in 2020, DM sovereign bonds started off 2021 on the opposite foot. Global yields have increased sharply, and the FTSE® World Government Bond Index declined 3.2% in local currency terms in first quarter 2021 (prices fall when yields rise)—its worst start to a year since its inception in 1985. A sharp improvement in the economic outlook is driving this year’s bond sell-off, thanks to both the distribution of highly effective COVID-19 vaccines and highly supportive government stimulus. US Treasuries have led the backup in yields, with ten-year US Treasury yields up 81 basis points (bps) year-to-date as of March 31 (Figure 1).
FIGURE 1 SEVERAL MAJOR 10-YR SOVEREIGN BOND YIELDS HAVE INCREASED SHARPLY IN 2021
December 31, 2020 – March 31, 2021 • Basis Points • December 31, 2020 = 0
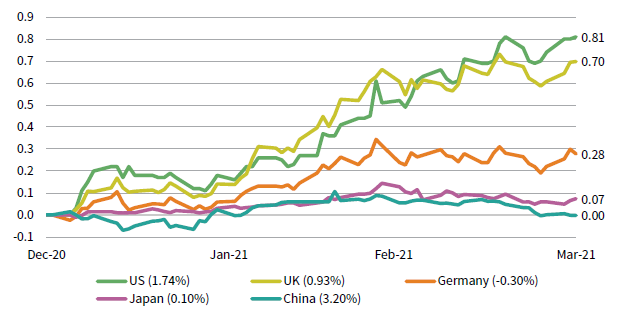
Sources: Federal Reserve and Thomson Reuters Datastream.
Notes: Data are daily. Current yields are shown in parentheses in the legend.
US Treasuries have repriced more quickly than their global counterparts in large part because there is an expectation that the recovery in global growth this year will be US-driven given its relatively successful vaccine rollout and stronger fiscal impulse. In March, the Organisation for Economic Cooperation and Development (OECD) more than doubled its 2021 growth forecast for the United States to 6.5%. Ten-year US Treasuries were yielding 1.74% as of the end of March, up more than 100 bps versus eight months ago and back above their pre-pandemic lows. Given the speed and magnitude of the sell-off, investors are starting to ask: How much more can bond yields rise?
Anatomy of a Bond Sell-off
If we look back at the past 30 years, we can see that cyclical bond sell-offs aren’t as rare as one might expect, considering the secular downtrend in yields over this time frame. Since 1990, there have been 12 episodes in which ten-year US Treasury yields have increased by at least 100 bps over a relatively short period before ultimately continuing their long-run trend lower (Figure 2). In this context, the current move in ten-year yields doesn’t stand out relative to past sell-offs. Both the length (8 months) and magnitude (+119 bps) of the current sell-off remain slightly below their historical averages (11 months and +147 bps, respectively) and are still far off the max of their historical ranges (17 months and +251 bps, respectively). So, while yields have risen a lot over a short period, there appears to still be room for this trend to continue. If we look beneath the surface, a few characteristics stand out about the current bond sell-off that might help us better understand just how much higher yields might rise and why.
FIGURE 2 A BREAKDOWN OF PAST US TREASURY SELL-OFFS
July 31, 1989 – March 31, 2021
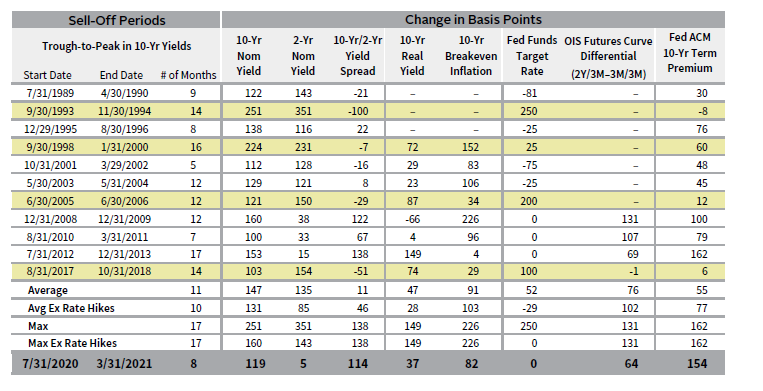
Sources: Federal Reserve, Global Financial Data, Inc., and Thomson Reuters Datastream.
Notes: Highlighted rows indicate periods where bond sell-offs coincided with a hike in the Federal Funds Target Rate. Calculations are based on monthly data.
Firstly, the yield curve has steepened significantly, with the ten-year/two-year yield spread rising 114 bps. In fact, with the short-end of the curve anchored by US Federal Reserve policy, the two-year yield has barely budged during the current sell-off and the increase in yields has almost entirely been contained to the long-end of the curve. The ten-year/two-year yield spread is now back in line with its trailing 20-year median, but the yield curve could steepen further if economic activity continues to strengthen and policy remains accommodative (Figure 3).
FIGURE 3 YIELD CURVES TEND TO OVERSHOOT DURING THE INITIAL STAGE OF AN ECONOMIC RECOVERY
December 31, 1960 – March 31, 2021 • Percent (%)

Sources: Federal Reserve, Global Financial Data, Inc., National Bureau of Economic Research (NBER), and Thomson Reuters Datastream.
Note: Gray bars represent NBER-defined US recessions.
Secondly, the rise in yields wasn’t driven by just an improvement in growth expectations but stronger inflation expectations, as well. Yes, the rise in US Treasury yields has coincided with an improvement in the economic outlook. But, while ten-year nominal yields have risen by more than 100 bps, market-based inflation expectations have also increased sharply, as measured by the ten-year breakeven inflation rate (Figure 4). As a result, the change in ten-year real yields has been relatively subdued.
FIGURE 4 NOMINAL YIELDS HAVE INCREASED MORE THAN REAL YIELDS, PUSHING-UP MARKET-BASED INFLATION EXPECTATIONS
January 1, 2020 – March 31, 2021 • Percent (%)
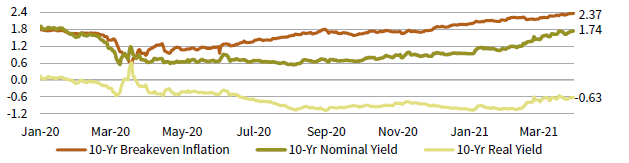
Sources: Federal Reserve and Thomson Reuters Datastream.
This is typical of a bond sell-off that takes place during the initial stage of an economic recovery, with reflationary policies and strengthening economic activity combining to push up the market’s inflation expectations. But this trend has reversed somewhat in 2021. The rise in ten-year US real yields (43 bps) has outpaced the rise in ten-year US breakeven inflation rates (38 bps) in first quarter 2021. Also, the ten-year US breakeven inflation rate is currently 2.37%, its highest level in nearly eight years. However, to the extent that nominal yields continue to rise, we anticipate that inflation expectations will remain a contributing factor. Based on the experience following the previous two recessions (i.e., 2001 and 2007–09), ten-year US breakeven inflation rates have more room to rise (Figure 5). There is also the possibility that the combination of strong realized inflation over the next few months (due largely to base effects), 1 the Fed’s shift to a flexible average inflation target (FAIT) framework, and the potential for another $2 trillion to $3 trillion in US fiscal stimulus increase the upside for breakevens relative to history.
FIGURE 5 10-YR US BREAKEVEN INFLATION RATE BEFORE & AFTER RECESSIONARY LOWS
As of March 31, 2021 • Percent (%)
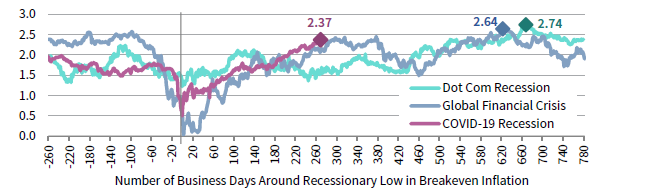
Sources: Federal Reserve and Thomson Reuters Datastream.
Thirdly, as we just highlighted, real yields have remained relatively stable during the current bond sell-off. This is in large part because real yields depend on both market expectations about future real economic growth and the likely path of monetary policy rates. While the economic outlook has improved significantly, the Fed is on hold. The Fed has signaled it does not intend to hike policy rates through at least the end of 2023, and it does not plan to taper asset purchases until “the economy has all but fully recovered.” A stronger-than-expected recovery in actual economic data could force the Fed to recalibrate the timing of policy normalization, but it will likely be overly cautious about tightening policy while the coronavirus remains a potential threat to global growth.
Furthermore, the Fed’s own research suggests that monetary policy needs to remain accommodative for longer when policy rates are coming from the zero-lower bound. Its recent shift to a FAIT framework, which is designed to keep monetary policy more accommodative for longer versus past recoveries, only reinforces this thinking. The Fed’s clear communication of its goals and dovish rhetoric has (so far) kept market expectations about the timing and pace of policy normalization, and in turn the rise in real yields, relatively well anchored (Figure 6). We expect this to continue given the Fed likely wants to avoid a repeat of the 2013 Taper Tantrum at all costs.
FIGURE 6 THE MARKET HAS NOT YET SIGNIFICANTLY PULLED FORWARD ITS EXPECTATIONS OF THE TIMING AND PACE OF FUTURE RATE HIKES
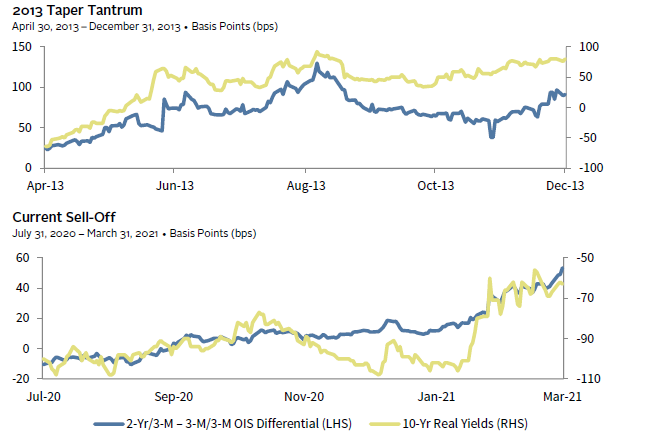
Sources: Federal Reserve and Thomson Reuters Datastream.
Notes: The two-year/three-month – three-month/three-month OIS differential is a proxy for the expected number of rate hikes (in basis points) over the next two years based on the futures market. It is calculated by taking the difference between the two-years forward, three-months swap rate and the three-months forward, three-months swap rate.
Finally, estimates of the term premium embedded in US Treasuries have increased sharply during the current sell-off. The New York Fed’s ACM ten-year US Treasury term premium has increased by more than 150 bps, compared to an increase of 55 bps during the average bond sell-off. A rise in the term premium suggests the market has become more concerned about an upside surprise in interest rates and is demanding more compensation for taking on interest rate risk. The ten-year term premium (0.66%) turned positive in February for the first time in two and a half years and it is now back in line with its average level of 0.74% between 2010–19 (Figure 7). Yet, it could have more upside given elevated uncertainty about the impact of the Fed’s new FAIT framework and unprecedented fiscal stimulus on growth and inflation.
FIGURE 7 FED RESERVE BANK OF NEW YORK ACM 10-YR TREASURY TERM PREMIUM ESTIMATE
January 31, 2010 – March 31, 2021 • Percent (%)
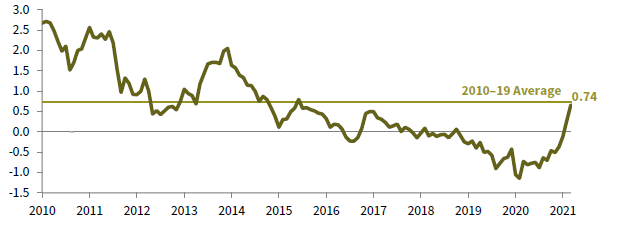
Sources: Federal Reserve and Thomson Reuters Datastream.
Tying it all together, the recent bond sell-off has the most in common with past bond sell-offs that took place during the initial stage of an economic recovery (i.e., a typical market correction), such as the 2008–09 bond sell-off. During both episodes, the long end of the curve drove the rise in yields, with the rise in the ten-year yield mostly reflecting an increase in inflation expectations and the term premium. Dynamics supported by strengthening economic momentum, reflationary policies, and elevated policy uncertainty. In 2008–09, ten-year US Treasury yields increased by a total of 160 bps, roughly 40 bps more than the trough-to-peak rise in yields during the current sell-off. Another 40 bp move today would put the ten-year yield at roughly 2.25%. It is hard to see yields having much more upside without the Fed significantly changing its forward guidance for its long-run neutral target rate (2.5%), which has recently acted as a ceiling for ten-year yields. So, while US Treasury yields are clearly in a cyclical upswing (Figure 8), further upside is likely to be limited because of the magnitude of the move to-date, the forces driving yields higher, and the Fed’s accommodative policy stance.
FIGURE 8 10-YR US TREASURY YIELDS ARE ABOVE BOTH THEIR 50-DAY AND 200-DAY MOVING AVERAGE
December 31, 2007 – March 31, 2021 • Percent (%)
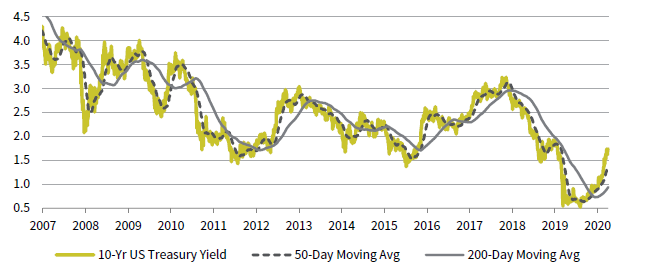
Sources: Federal Reserve and Thomson Reuters Datastream.
The biggest risk to this view is if real yields were to spike from bond investors significantly pulling forward their expectations of tighter monetary policy. The market has a history of being overly optimistic about the timing and pace of future rate hikes. This time around will likely be no different, especially given uncertainty about the Fed’s new FAIT framework. While we believe market expectations about policy normalization are better anchored today, a repeat of the 2013 Taper Tantrum can’t be completely discounted. A miscue between the Fed and the market or perhaps an inflation scare could prompt the market to further test the Fed’s determination to remain accommodative.
Another potential risk is if the Fed itself significantly pulls forward its expectations about the timing of policy normalization. The possibility of higher policy rates would significantly increase the upside for long Treasury yields. The two largest bond sell-offs (i.e., 1998–00 and 1993–94) both coincided with a Fed rate hike cycle. In fact, if we remove bond sell-offs that were accompanied by Fed rate hikes from the analysis, then the current rise in ten-year US Treasury yields is closer to the top end of historical events (160 bps).
Investment Implications for Core Fixed Income
Investors should favor assets that are likely to outperform in both a rising, and to a lesser extent relatively stable, interest rate environment relative to broad sovereign bonds over the next year or two. Typically, we would expect shorter-duration sovereign bonds or cash, investment-grade credit, inflation-linked bonds, and sovereign bonds that are less correlated with global growth, such as China sovereign bonds, to all deliver positive relative returns when interest rates are rising. However, the risk/reward trade-off for short-duration sovereign bonds isn’t very appealing following the recent rise in yields, based on long-term trends in economic fundamentals (adjusted for short rates) [Figure 9]. Similarly, investors are not being well compensated for taking credit risk. The option-adjusted spread on investment-grade US corporate bonds was 91 bps as of March 31, near its all-time low of 51 bps.
FIGURE 9 10-YR US TREASURY YIELDS ARE IN LINE WITH LONG-TERM ECONOMIC FUNDAMENTALS (ADJUSTED FOR SHORT RATES)
January 31, 1990 – March 31, 2021 • Percent (%)
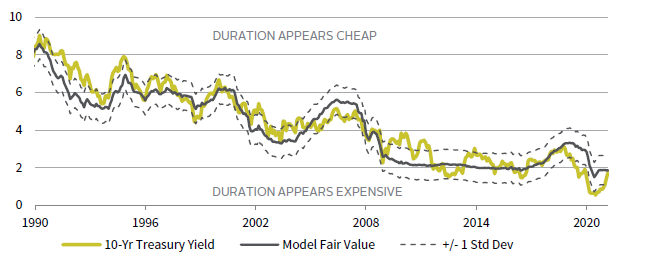
Sources: Federal Reserve, Thomson Reuters Datastream, and US Department of Commerce – Bureau of Economic Analysis.
Note: The Model Fair Value is based on a multiple-linear regression where the trailing ten-year annual nominal GDP growth rate and one-year Treasury yield are the independent variables and the ten-year yield is the dependent variable.
Instead, we continue to prefer inflation-linked bonds and China sovereign bonds. We’ve recommended tilting away from broad sovereign bonds and toward inflation-linked bonds from a tactical perspective since the start of the pandemic given supportive relative valuations and economic fundamentals. That said, relative valuations are less appealing today following the sharp rise in breakeven inflation expectations. Historically, relative US TIPS and US Treasury returns have been flat on average over subsequent three-years based on the current ten-year US breakeven inflation rate. But, as discussed, positive economic fundamentals should continue to support breakeven inflation expectations and their upside is potentially higher today given the accommodative policy backdrop. And even if inflation doesn’t surprise to the upside, inflation-linked bonds should hold-up relative to sovereign bonds in a stable interest-rate environment, according to our steady-state return projections. 2
We’ve also been in favor of holding China sovereign bonds in place of a portion of high-quality core fixed income allocations since late last year. Historically, China sovereign bonds have offered a similar risk-return profile to DM sovereign bonds. And given that China sovereign bonds currently yield more than 3% in nominal terms, they offer meaningful yield pickup at little additional risk compared to both DM sovereign bonds and investment-grade credits. Additionally, China sovereign bond yields tend to be less correlated to global yields than US Treasuries, so the spread between Chinese and US yields tends to compress as yields rise. Which, in addition to their yield advantage, should help them outperform in both a relatively stable and rising interest rate environment.
Figure Notes
Nominal Yield
The nominal yield is the yield before taking inflation into account.
Real Yield
The real yield is the nominal yield adjusted for expected inflation. It is represented by the yield on ten-year Treasury
inflation-indexed constant maturity securities.
Breakeven Inflation Rate
The breakeven inflation rate represents a measure of expected inflation derived from ten-year Treasury constant maturity securities and ten-year Treasury inflation-indexed constant maturity securities. The latest value implies what market participants expect inflation to be in the next ten years, on average.
Fed Funds Target Rate
The fed funds target rate is the target interest rate at which depository institutions trade federal funds (balances held at Federal Reserve Banks) with each other overnight. The Federal Open Market Committee (FOMC) meets eight times a year to determine the federal funds target rate.
2-Yr/3-M – 3-M/3-M OIS Differential
The two-year/three-month – three-month/three-month OIS differential is a proxy for the expected number of rate hikes (in basis points) over the next two years based on the futures market. It is calculated by taking the difference between the two-years forward, three-months swap rate and the three-months forward, three-months swap rate.
Term Premium
The term premium is the compensation that investors require for bearing the risk that short-term Treasury yields do not evolve as they expected.
Fed ACM Term Premium
New York Fed economists Tobias Adrian, Richard Crump, and Emanuel Moench (or “ACM”) present Treasury term premia estimates for maturities from one to ten years from 1961 to present. The ACM term premium is based on a five-factor, no-arbitrage term structure model, described in detail on the Federal Reserve Bank of New York’s website.
Footnotes
- Base effects as it relates to inflation refers to the impact of the price level of the corresponding period of the previous year on year-over-year calculations. Year-over-year inflation data is expected to rise over the next several months in part because of last year’s depressed price levels during the first wave of the pandemic.
- Our Steady-State Scenario assumes inflation averages of 2% over three years, nominal rates are 1%, and economic growth is 3%. Our return estimates under steady state conditions assume current valuations and trendline fundamentals, with no assumption of valuation mean reversion.
TJ Scavone - T.J. is a Senior Investment Director in the Capital Markets Research Group at Cambridge Associates.
About Cambridge Associates
Cambridge Associates is a global investment firm with 50+ years of institutional investing experience. The firm aims to help pension plans, endowments & foundations, healthcare systems, and private clients achieve their investment goals and maximize their impact on the world. Cambridge Associates delivers a range of services, including outsourced CIO, non-discretionary portfolio management, staff extension and alternative asset class mandates. Contact us today.