Maintaining Strategic Direction through Peaks and Valleys

An extended bull market can tempt even the savviest investors into abandoning their long-term discipline. Resisting the impulse to switch horses in the middle of the race is hard, but necessary—the most important trait of successful investors is their ability to maintain discipline in sticking to a long-term strategy during good times and bad. Diversified portfolios—structured to earn returns comparable to their rate of spending at tolerable levels of risk—have benefitted long-term investors and grown their purchasing power for decades, and we have no reason to expect a different outcome when today’s bull market inevitably corrects.
Since 2009, US equities have outperformed every major asset class by a considerable margin, returning over 14% a year on average. Over the same period, a portfolio of 70% US equities and 30% US bonds has returned about 11% a year, on average. Given these returns, many investors are wondering whether to invest 100% in US equities, or to move to a simple, passive 70/30 portfolio.
The same questions about the diversified approach were raised in the late 1990s. During the sustained bull market of 1995 to 1999, a simple portfolio outperformed a diversified one until the equity bubble burst and investors that stuck with the diversified strategy were rewarded. A key difference between then and now is portfolios’ starting positions. In 1999, endowments allocated 45%, on average, to US equities. Today, the average allocation to long-only US equities is just 20%, which could make the feeling of missing out seem even greater.
However, investors should not be tempted by historical returns—as we know, past performance is no guarantee of future results. The most important trait of successful investors is their ability to maintain discipline in sticking to a long-term strategy during good times and bad. Of course, it is always sensible to consider if times have changed enough that one’s strategy is no longer well suited to meet long-term investment objectives. This means understanding where the markets are today in relation to long-term secular trends and cycles, and asking if anything fundamentally different about today justifies changing course.
We don’t believe it does. Over the last ten years an investor with the fortitude and foresight to maintain a 100% allocation to US equities would have outperformed most diversified portfolios, but what about over the next ten years? We suspect the future holds what we have seen time and time again: the tide eventually turns, and diversification protects investors from maintaining too much exposure to any one asset class, as top recent performers become poorer performers, and vice versa. A highly diversified portfolio approach has benefitted long-term investors and grown their purchasing power for decades, and we have no reason to expect a different outcome when today’s bull market inevitably corrects.
The Fundamentals of Diversified Portfolios
A diversified portfolio strategy provides investors a superior means for maximizing spending while preserving or growing purchasing power. However, such a strategy is not easy to successfully implement. Investors must be willing to accept returns that look different from simple stock/bond reference portfolios, take illiquidity risk, remain focused on a long time horizon, and dedicate adequate resources to effective implementation. When well executed, investors able to hold on through periods of inevitable underperformance relative to simple reference portfolios are rewarded over the long term.
To better understand the value-added potential of diversified portfolios, we compare the return profile of a simple portfolio of 70% developed markets equities and 30% US government bonds to a highly diversified portfolio constructed to have the same level of volatility as the 70/30 portfolio. 1 Based on our conservative long-term performance assumptions, 2 the highly diversified portfolio has an expected annual compound return nearly 100 basis points (bps) higher than the 70/30 portfolio. The higher return is expected because the portfolio seeks to earn incremental returns from various sources including illiquidity premiums and pursuit of more diverse market risks. Even after spending more over time, highly diversified portfolios are expected to create more wealth. This effect is particularly pronounced over longer horizons.
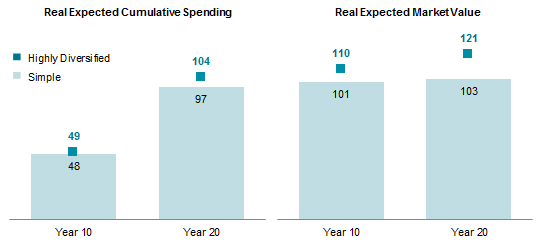
Even after spending more over time, highly diversified portfolios are expected to create more wealth
Based on $100 beginning market value. See last pages for more information and important disclosures.
Importantly, our modeling shows the upside potential of a highly diversified portfolio is much more significant than the upside from a simple stock/bond portfolio, while the downside is comparable. Further, the highly diversified portfolio has a lower probability of experiencing significant declines and is more likely to recover over the long term than a simple portfolio.
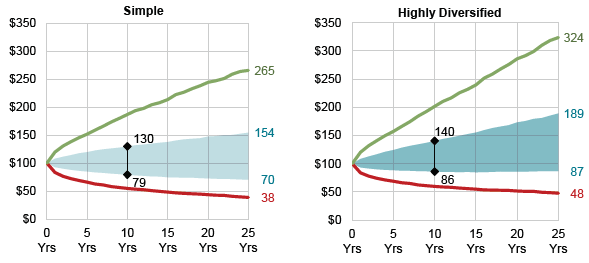
Diversified portfolios offer more potential upside with similar downside over the long term
See last pages for more information and important disclosures.
Over the last 26 years for which we have performance data, the conceptual framework shown in this modeling has largely been borne out. 3 The highly diversified portfolio, like the simple portfolio, fell sharply during the severe bear market of 2000–03, when the tech and telecom bubble popped, and during the global financial crisis of 2007–09, but its declines were more muted, particularly during the earlier period.
The simple portfolio returned a cumulative -26.8% over the 12 quarters ended first quarter 2003, much worse than the -14.5% experienced by the highly diversified portfolio, and the simple portfolio returned -32.6% during the six quarters ended first quarter 2009, south of the -29.5% for the highly diversified portfolio. Performance was more comparable during the 2007–09 market decline, as all asset classes were lifted by a common source—excessive leverage—which sent all assets falling sharply once higher rates set off a vicious cycle of deleveraging. Among major asset classes, only high-quality bonds were able to post positive returns over this period—an important reminder of why investors diversify their portfolio exposures.
Following the 2000–03 bear market (based on quarterly data), the highly diversified portfolio recovered its previous high-water mark in just three quarters, while the simple portfolio took seven quarters. Following the global financial crisis, the recovery period for both portfolios was comparable, with the simple portfolio edging the highly diversified portfolio by one quarter.
What to Expect When You’re Investing
Since 1990, diversified portfolios have underperformed a simple 70/30 stock/bond portfolio in two periods: 1995–99 and 2009–16. To study the cycles, we augment the simple and highly diversified portfolios we’ve been discussing with data from roughly 100 endowment & foundation portfolios in our database with at least 15% of their portfolios in private investments. 4 On an annual basis, the highly diversified portfolio underperformed the simple stock/bond portfolio by 195 bps during the late 1990s and 300 bps during the most recent period. The median investor in our database fared a bit better, underperforming by 140 bps and 100 bps, respectively. Over the full period, 1990–2016, both the highly diversified portfolio and the median endowment & foundation portfolio returned roughly 150 bps more than the simple stock/bond portfolio, with comparable volatility. 5
While clearly disappointing, periods of underperformance are to be expected from time to time even as highly diversified portfolios have a higher expected return than simple stock/bond portfolios. Based on historical performance and our long-term equilibrium assumptions, a simple portfolio should be expected to outperform more diversified portfolios periodically. Despite higher return expectations over the long term, the diversified portfolio is expected to underperform the simple portfolio by as much as 100 bps a year in 21% of five-year periods and 12% of ten-year periods. Thus today’s experience, while rare, is not outside of expectations.
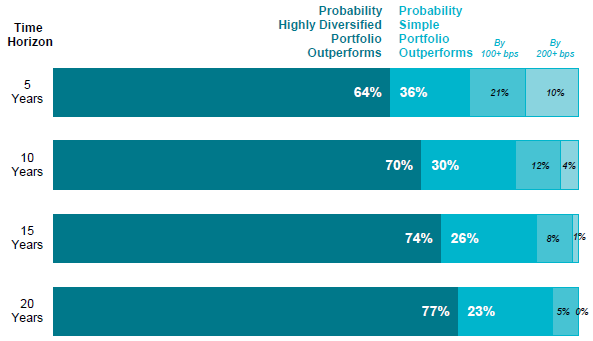
While diversified portfolios are more likely to outperform, simple portfolios will outperform over some periods, occasionally substantially
See last pages for more information and important disclosures.
Cyclical versus Secular Forces
It is clear that diversified portfolios have been in a period of cyclical underperformance. These cycles are normal and should be expected to occur regularly over time. Of greater importance to investors is whether there are secular reasons to believe that diversified portfolios could fail to achieve superior returns to simple portfolios over the long term.
The most pressing question along these lines is the degree to which hedge funds, private equity, venture capital, and other diversifying strategies can be expected to deliver on their long-term expectations as these markets have matured. Clearly investors who were early adopters of alternative assets reaped huge premiums for taking a chance on new investment strategies.
It is true that the challenge of adding value to simple portfolios by diversifying into hedge funds and private investments has become more difficult as an increasing number of investors have sought to participate in these markets. Hedge fund performance has trended down at the same time as the number of hedge funds has grown tremendously. The upper end of five-year excess returns over cash more recently has been closer to 8% or 9% as the industry has matured, significant value add, but far from the over 15% annualized excess returns reached in the late 1990s. Similarly, investors should not expect a maturing private investment market to produce the 4x–5x venture capital multiples and 2x buyout multiples that were prevalent in the United States in the 1990s. A surfeit of capital chasing higher returns in a low yielding environment has flowed into private investments in search of alpha and illiquidity premiums. As the market has matured, median net returns (net of fees, expenses, and carried interest) have been falling from the high teens and low 20s toward the mid-teens, which still represents significant value to investors.
Even during this challenging period for active managers, hedge fund performance has been highly dispersed, reflecting both strategy differences and the wide dispersion in manager skill. While past performance tells us little about the future, the dispersion reflects the importance of not treating all hedge fund strategies and managers as if they are the same. Superb managers should be maintained, as should managers providing exposures that would be difficult to replicate outside of the hedge fund arena.
Please see David Shukis and David Thurston, “The 15% Frontier,” Cambridge Associates, 2016.
Similarly, private managers’ ability to add value to public markets in aggregate has fluctuated with market cycles, but also has a secular component. Private investments have been a strategically important driver of performance for decades. We continue to expect carefully constructed, high-quality private investment allocations to add value relative to public markets.
Overall, we continue to find investments in private equity and hedge funds that we believe have an ability to add value to portfolios over the long term. Expectations should be ratcheted down from the glory days of the 1990s, and the job of finding alpha has become more difficult. However, the opportunity is still there for those with appropriate skill that are willing to put in the effort and stick with the strategy.
Diversification Today
Simple is not so sweet in the current environment. In a world of global uncertainty, investors should place a premium on diversification. The siren song of the simple portfolio may be difficult to resist, but its appeal is based on recent performance that is unlikely to be repeated over the next decade.
Prospective long-term returns of simple stock/bond portfolios are unappealing. While timing is anyone’s guess, valuations are sufficiently elevated that we do not see a way for an inexpensive, indexed portfolio of stocks and bonds to meet most investors’ return objectives. In fact, if valuations, inflation, and fundamentals were to return to normal conditions over the next decade, we would expect simple 70/30 portfolios to produce real returns of about 0%–2%. Even without valuations mean reverting, it is difficult to develop a plausible scenario where the return after inflation would be much more than 3.5%, unless earnings growth improved significantly and/or multiples expanded further. 6
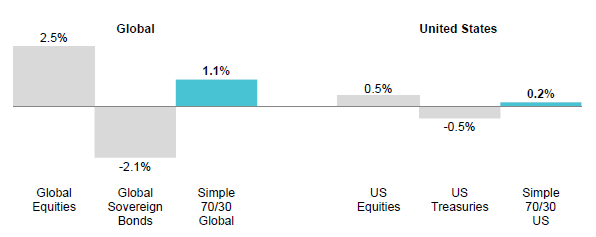
Prospective returns for simple portfolios are unappealing
See last pages for more information and important disclosures.
At the most fundamental level, diversified portfolios—structured to earn returns comparable to their rate of spending at tolerable levels of risk—provide a better long-term strategy for meeting the common investment objective of seeking to preserve or grow purchasing power while supporting a steady flow of spending. As investors consider where returns will come from in the future and how the transition from low yields/high valuations to more “normal” conditions may evolve, investing in a diversified basket of assets that balances between return seeking and stability will be particularly critical.
Notes and Disclosures
The scenario modeling found in this report has used index data from Barclays, Bloomberg L.P., Cambridge Associates, Global Financial Data, Inc., Hedge Fund Research, Inc., MSCI Inc., National Association of Real Estate Investment Trusts, National Council of Real Estate Investment Fiduciaries, and Thomson Reuters Datastream. MSCI data provided “as is” without any express or implied warranties.
The 70/30 and highly diversified portfolios analyzed in this report have the asset allocation shown in the table below. To determine the return and standard deviation of these portfolios we used our equilibrium assumptions. These assumptions represent a base case of long-term equilibrium real returns that are independent of current valuations, are targeted toward a generic 25-year-plus time horizon, and incorporate a reasonable equity risk premium. When modeling cumulative real wealth after spending, the inflation rate is assumed to be 3% and the spending rule is 5% of ending trailing 12-quarter market value. The models assume annual rebalancing of the portfolio. In our analysis of the upside/downside of these two portfolios, the shaded regions show the 25th to 75th percentile range of expected outcomes for each portfolio given the aforementioned rules for both annual spending and cumulative spending. Green and red lines on the chart show the 5th (upside) and 95th (downside) percentile outcomes, respectively. To determine the likelihood of outperformance, we used a Monte Carlo simulation of the two portfolios based on the equilibrium return assumptions of the asset classes listed in the below. The simulation assumed lognormal distribution and the returns referenced in the results are all compound returns. To illustrate prospective returns of various 70/30 portfolios, we used our return to normal scenario, which incorporates current valuations and assume equity valuations revert to fair value over ten years. This scenario makes assumptions about the market environment including mild inflation; moderate real earnings growth; and low corporate default rates, government bond yields, and credit spreads.
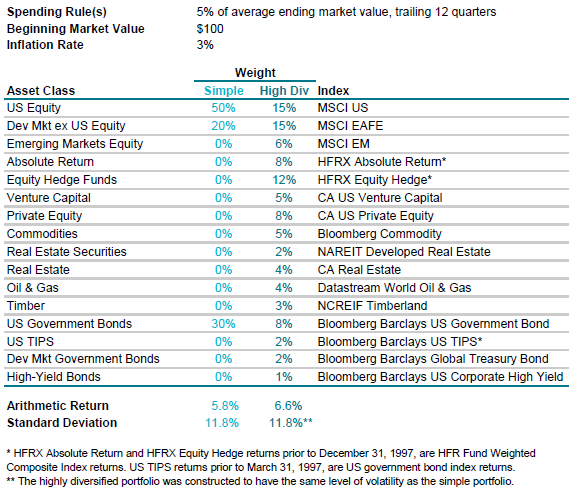
Simple and Highly Diversified Portfolio Summary
Footnotes
- See the last pages for asset allocation specifics and important disclosures. We use a 70/30 reference portfolio with developed markets equities as the equity component as institutional investors diversified beyond US equities years ago, and the returns of this simple portfolio are a more appropriate point of comparison for broadly diversified portfolios.
- We seek to reflect the average expectations in conducting this analysis, hence our conservative assumptions, which do not reflect any estimates of alpha. Successful practitioners of the endowment model also seek to benefit from superior active management.
- We use historical index data to examine returns over this period; indexes used for this evaluation are shown in the last pages.
- Includes institutions with an average annual asset allocation to private investments of at least 15% over the time horizon. Private investments include private equity, venture capital, private distressed securities, private real estate, private oil & gas/natural resources, and timber.
- Astute readers will recognize that private investments tend to have lower volatility than public investments. There are a number of reasons for this, including the autocorrelation of private investment quarterly returns and the methodology used to annualize quarterly standard deviations. Calculating standard deviations using annual return data diminishes the impact of smoothing. Using this methodology, standard deviations of all three portfolios were comparable over the full period. When annualizing quarterly data, the simple stock/bond portfolio had a standard deviation higher than the highly diversified index portfolio (10.7 compared to 9.3). We do not have quarterly return data for the full sample of client portfolios.
- See last pages for more information about this modeling and important disclosures.
Celia Dallas - Celia Dallas is the Chief Investment Strategist and a Partner at Cambridge Associates.
About Cambridge Associates
Cambridge Associates is a global investment firm with 50+ years of institutional investing experience. The firm aims to help pension plans, endowments & foundations, healthcare systems, and private clients achieve their investment goals and maximize their impact on the world. Cambridge Associates delivers a range of services, including outsourced CIO, non-discretionary portfolio management, staff extension and alternative asset class mandates. Contact us today.