Endowment Radar Study 2020: The Endowment as Ballast

While colleges and universities have faced several financial fissures due to the disruptions of COVID-19, their endowments have been a source of financial stability. Four key financial indicators tell this story.
- Operating margins were compressed by higher costs and lower-than-expected revenues.
- Continuing a multi-year trend tuition discounts grew to meet student need and respond to a competitive pricing environment, reducing net tuition revenues.
- Institutions borrowed more debt to meet liquidity and capital needs.
- Endowment spending was consistent despite disruptions to other revenues and costs.
This note will review these financial pressures and the endowment implications that emerged in Cambridge Associates’ second annual Endowment Radar Study of private college and university finances. The pandemic that commenced in 2020 has taken a different toll than the 2008–09 Global Financial Crisis (GFC) that stressed endowments, but was less disruptive to campus enterprises. In 2020, we saw major disruptions to higher education enterprises, while endowment market values and distributions remained steadfast. Our endowment radar analysis shows that endowments have provided consistent support for institutional budgets and pricing, while serving as a ballast on the balance sheet for today’s borrowing and future spending.
Compressed Operating Margins
Operating margin analysis in 2020 shows the financial stress wrought by the pandemic, which particularly disrupted the last quarter of the year. To evaluate the financial health of the enterprise we focus on two operating margins: the overall margin, which considers all revenues and expenses, and the core margin, which measures operating results before subsidies from endowment, other investment income, and annual gifts (Figure 1).
FIGURE 1 CORE OPERATING MARGINS SHOW STRAIN, BUT OVERALL MARGINS HOLD UP
Fiscal Year 2020 • Constant Universe • n = 41

Source: Data gathered from audited financial statements by Cambridge Associates LLC.
Notes: Overall Operating Margin is calculated as (Total Operating Revenues – Total Operating Expenses)/Total Operating Expenses. Core operating margin excludes revenues from endowment distribution, other investment income, and current year gifts; and expenses from fundraising (institutional advancement).
While we expect the core operating margin to be negative—the private colleges and universities in this analysis are nonprofit organizations that depend on the subsidies of endowment distributions and philanthropy to balance the budget—we saw the average core margin drop from -18.2% to -20.3% in 2020. The average overall operating margin dropped by a smaller amount, from 2.6% in 2019 to 2.2%. This shows that the subsidies provided by gifts and endowments were more consistent compared to core revenues, and therefore helped to bolster overall results against the weaker core margins. For some, however, these subsidies could not fully make up the difference; the number of institutions that reported negative overall margins increased from ten in 2019 to 15 in 2020.
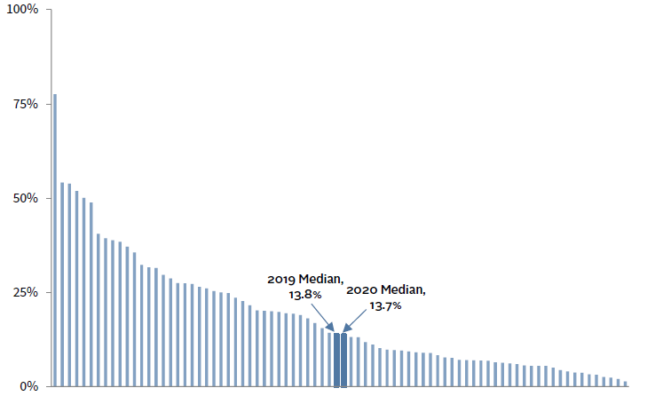
The endowments in this study range from supporting a small fraction of the university budget to more than half (Figure 2), but the level of support has been steadfast from year-to-year. Average and median endowment dependence was nearly unchanged from 2019. It was particularly notable and helpful that the endowment provided a consistent source of budget support in a year when so many other sources of revenue were disrupted. Institutions with a higher reliance on the endowment enjoyed less disruption to their overall operating revenues and operating results.
FIGURE 2 ENDOWMENT DEPENDENCE HAS BEEN CONSISTENT
Fiscal Year 2020 • Constant Universe • n = 78
Source: Data as reported to Cambridge Associates LLC where available, or gathered from audited financial statements by Cambridge Associates LLC.
Growing Tuition Discounts
One of the pressure points for the operating margin is the growing “cost” of forgone revenue in the form of discounted tuition that is provided to students as financial aid and scholarships. The average discount rate for the colleges and universities in our study has climbed every year and went from 40% in 2018 to 42% in 2020. 1 This means that, on average, an institution collected 58% of the tuition charged to students. This line item has eroded net tuition revenue in 2020 2 as schools have increased financial and merit aid to respond to growing student needs and the competitive enrollment landscape.
The endowment distribution directly supports financial aid and scholarships via endowments restricted for those purposes and indirectly by subsidizing total costs and thus increasing the availability of other funds that can be used to support financial aid. The endowment support to financial aid is a coverage ratio that considers the direct and indirect role the endowment plays in pricing strategy. It measures the relationship between endowment distribution and tuition discounts to compare the endowment subsidy to the budget to the forgone revenue discounted to students.
The institutions that have endowment “coverage” for financial aid can offset forgone tuition revenue with endowment payout (Figure 3). This enables them to deliver their discounted price 3 to students from a position of strength as shown in light blue shading in the upper-right of Figure 3. The diamonds in yellow shading on the lower-right side are offering high discount rates from a weaker financial position. Without a higher subsidy from the endowment to offset this forgone revenue, they will need to employ other financial levers—such as auxiliary revenue and annual fund gifts and careful expense management—to balance the budget.
FIGURE 3 COLLEGES HAVE MORE PRICING POWER WHEN TUITION DISCOUNT HAS ENDOWMENT SUPPORT
Fiscal Year 2020 • n = 76
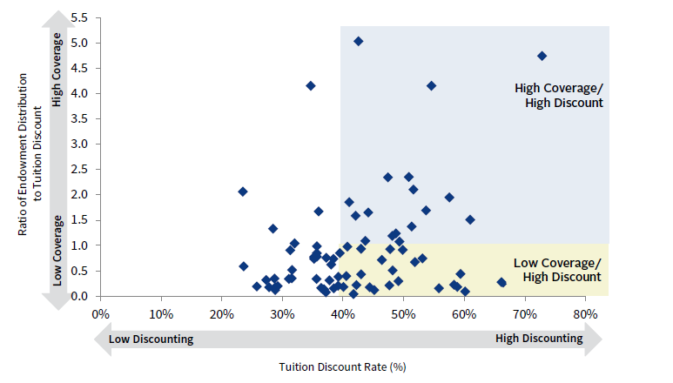
Source: Data gathered from audited financial statements by Cambridge Associates LLC.
Notes: Coverage for tuition discount is correlated with endowment support. A ratio of endowment payout & other investment income to institutional grants that exceeds 1.0 indicates “coverage” for discounted tuition revenue.
More Debt
In 2020, the endowments in our constant universe grew, on average, at a rate of 2%, but that growth was outpaced by institutional debt, which grew 12% in the same period (Figure 4).
FIGURE 4 GROWING DEBT TO ENDOWMENT
June 30, 2013 – June 30, 2020 • Constant Universe • n = 42
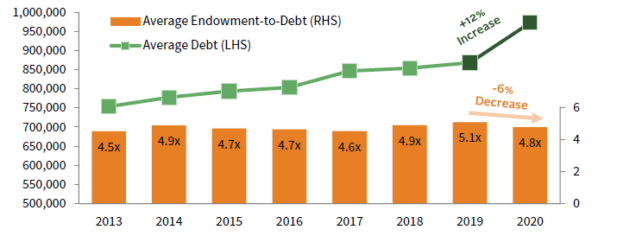
Source: Data as reported to Cambridge Associates LLC.
This spike in debt obligations far exceeded any recent increase and reduced the ratio of endowment to debt, but most institutions in our study continue to have healthy balance sheets. Debt has been a valuable tool in securing enough liquidity in 2020, but going forward institutions will need to consider long-term borrowing capacity and the additional costs of debt service. It will be interesting to see if the debt appetite has been satiated and this pace flattens in 2021.
Consistent Endowment Spending
The effective endowment spending rate is a function of the portfolio’s market value and the dollars spent from the endowment, which is most often determined by a spending policy designed to distribute endowment wealth fairly across generations. In certain years, non-endowment funds or emergency draws may boost the rate of spending, but 2020 was not that year for the majority of colleges and universities in our study. Despite the financial upheaval during the last few months of the year, schools adhered to their spending policies and spent at a consistent rate compared to 2019 (Figure 5). This consistency may be explained by the fact that the disruptions to finances came toward the end of the fiscal year and schools did not need liquidity immediately, or if they did they had access to liquidity sources outside of the endowment, including reserves that had been set aside for emergency purposes and lines of credit and long-term debt. The steady level of spending could also be explained by the long-term discipline that is built into most endowment spending policies to provide equitable spending for multiple generations of stakeholders.
FIGURE 5 ENDOWMENT SPENDING HOLDS STEADY
Fiscal Year 2020 • Effective Spending Rates • n = 51
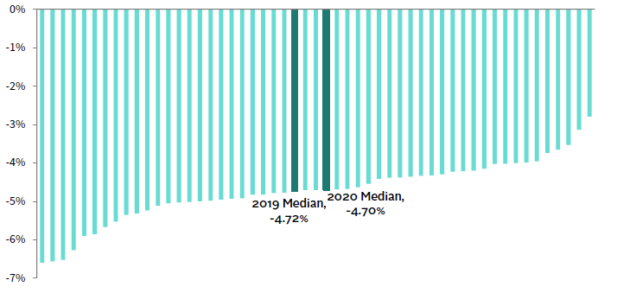
Source: Data as reported to Cambridge Associates LLC.
In addition to long-term performance, net flow (the ratio that calculates the net rate of spending and inflows), is an indicator of whether the endowment will keep pace with the enterprise, lose purchasing power, or take on a greater role in the future. Net flow is a metric that tends to vary considerably by institution, and from year-to-year for some institutions because it is sensitive to cash flow timing and the unanticipated event, such as the gift of a large bequest.
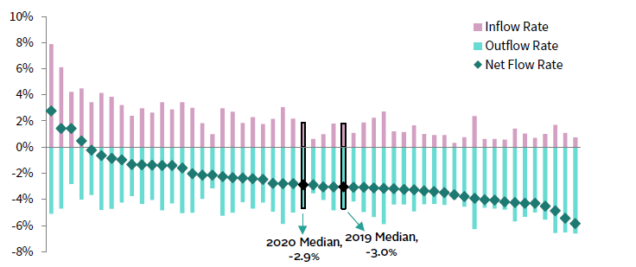
In 2020, institutions with positive net flow were driven by strong inflows and in some cases more muted spending rates (Figure 6). Net flow is a source of endowment growth when inflows outpace outflows. At the lower end of the net flow range (on the right-hand side of Figure 6), high spending significantly overshadowed inflows. To grow the endowment those institutions must rely on performance outpacing a low net–flow rate. In the middle of the net flow chart, we see a variety of experiences. In some cases, high spending is partially offset by successful fundraising; in others, we see lower spending accompanied by low inflows.
FIGURE 6 NET FLOW RATES HAVE ALSO BEEN STEADY
Fiscal Year 2020 • n = 51
Source: Data as reported to Cambridge Associates LLC.
Endowment Radar – A Holistic View of the Role of the Endowment
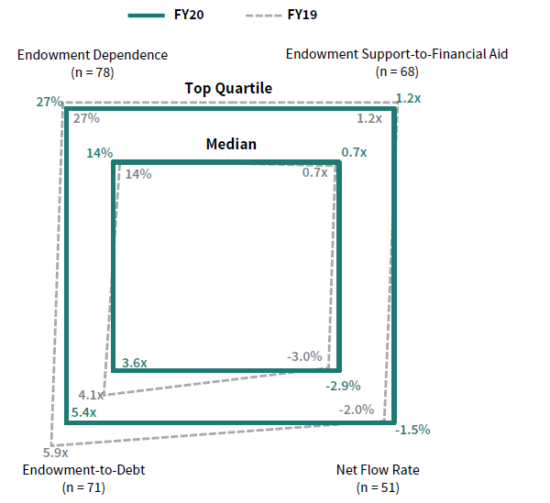
Endowment radar is a visual tool that enables us to look at how the key financial indicators have impacted the endowment’s role and sustainability in the institutional business model. The endowment radar chart plots endowment dependence, endowment support to financial aid, endowment to debt, and net flow. When an institution’s endowment radar metrics plot toward the exterior of the chart the endowment plays a significant role in supporting the mission. When the endowment radar data points are closer to the center of the chart, the endowment plays a limited role.
This is our second year of conducting the Endowment Radar Study and we can look across the universe of participating colleges and universities and analyze how aggregate results have shifted (Figure 7). The top half of the chart shows that the endowment’s role in supporting the budget and pricing did not shift significantly from 2019 to 2020. Both the median and top quartile statistics were unchanged for endowment dependence and endowment support to financial aid. The sharp increase in debt does have an impact on the endowment to debt ratio on the bottom left of the endowment radar chart. The endowment to debt quadrant contracted, because of the additional borrowing for many institutions outpaced endowment growth reduced that ratio for the median- and top-quartile institutions. The consistent net flow metrics provide optimism that the endowment will be able to maintain its role in supporting the institution. While median net flow improved slightly from -3.0% to -2.9%, the top quartile improved more substantially from -2.0% to -1.5%. This shift can be explained by strong fundraising offsetting a higher portion of spending.
FIGURE 7 ENDOWMENT RADAR MAP 2020 VS 2019: CONSISTENT SUPPORT, SHIFTS ON THE BALANCE SHEET
Source: Data as reported to Cambridge Associates, LLC or as reported in publicly available audited financial statements.
Conclusion
The year 2020 brought many surprises and changes, and while investment markets were volatile, by the end of the fiscal year, the endowment’s role was relatively unchanged from prior years. Comparing two years of endowment radar metrics, we see that the role of the endowment was consistent for many private colleges and universities, but balance sheets are absorbing growing debt loads. Fortunately, net flow did not weaken for most and even improved for some, as spending rates adhered to policy and fundraising contributed to endowment health.
Financial disruptions highlighted the importance of the endowment to bolster operations and anchor the balance sheet. Colleges and universities where the endowment played a more significant role were better positioned to weather disruptions to other operating revenues and, also, had more capacity to access liquidity through the debt markets. As the pandemic’s disruptions continue to strain finances in fiscal year 2021, we will watch these metrics and the role of the endowment in supporting colleges and universities during these tumultuous times.
Notes on Data
This report includes data on 91 private college and university clients of Cambridge Associates, with endowment market values as of June 30, 2020, ranging from $59 million to $45 billion, with a median of $914 million. Most of the data used in this report was provided to Cambridge Associates LLC through our annual survey of colleges and universities. We have accessed additional data through publicly available audited financial statements, specifically on tuition discounting and to fill gaps in reported data. “Endowment” is used throughout to refer to the entire long-term investment portfolio (LTIP); the vast majority of college and university LTIPs are composed of endowment, though operating funds and other capital is often invested alongside.
Footnotes
- The 2019 to 2020 comparison is for a constant universe of 76 institutions. Tuition discount is calculated as all scholarship aid provided to students as reported on financial statements, including aid for undergraduate and graduate students, and aid to tuition, fees, room, and board. Discount rate is calculated as total tuition discount as a percentage of gross tuition and fees.
- Median net tuition and fees declined 0.7% from 2019 to 2020 for a constant universe of 142 private colleges and universities rated by Moody’s.
- Note that the endowment distribution is not all designated for financial aid. We are simply comparing the subsidy from endowment to the forgone revenue of student aid. Also, we are using discount rate as a barometer of price, recognizing that is an imperfect assumption.
About Cambridge Associates
Cambridge Associates is a global investment firm with 50+ years of institutional investing experience. The firm aims to help pension plans, endowments & foundations, healthcare systems, and private clients achieve their investment goals and maximize their impact on the world. Cambridge Associates delivers a range of services, including outsourced CIO, non-discretionary portfolio management, staff extension and alternative asset class mandates. Contact us today.