China’s Onshore Bond Market: An Update


Interest in China’s onshore bond market has been rising steadily since 2016 when the market was thrown open to foreign investors. Foreign holdings of onshore bonds now exceed US$400 billion and are set to rise further as Chinese bonds are added to major global fixed income indexes.
Yet foreign holdings remain relatively low at just 4% of the total market, despite China having one of the largest bond markets in the world. We think the market warrants further attention from global investors, given Chinese bonds continue to offer higher yields and lower correlations than those found in other major bond markets, with the potential to bring portfolio diversification benefits.
This paper provides an update to our 2017 introduction 1 to the onshore Chinese bond market and discusses the outlook for the market and other considerations for investors.
China’s Three Bond Markets Defined
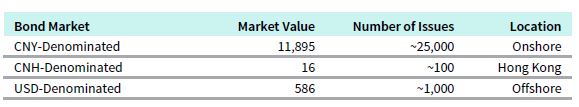
Broadly speaking, China has three bond markets 2 : an onshore CNY-denominated market, an offshore CNH-denominated market, and an offshore “international” market denominated in other currencies, predominantly US dollars (Figure 1).
FIGURE 1 CHINA HAS THREE BOND MARKETS
As of October 31, 2020 • US Dollar (billions)
Sources: China Central Depository & Clearing Co., Ltd., FTSE Fixed Income LLC, J.P. Morgan Securities Inc., and Wind.
Notes: CNY-denominated market is represented by the ChinaBond New Composite Index; CNH-denominated market is represented by FTSE Dim Sum Bond Index; and USD-denominated market is represented by the J.P. Morgan Asia Credit Index (JACI) China.
Historically, exposure to China in most global fixed income benchmarks was limited to USD-denominated China bonds. However, this market is relatively small at US$586 billion in size, or 0.7% of the Bloomberg Barclays Global Aggregate Bond Index.
The offshore CNH or “dim sum” market comprises bonds issued in Hong Kong and denominated in CNH. Launched in 2010 to help internationalize the RMB by encouraging the growth of CNH assets, this market remains small (US$16 billion) with limited liquidity and market concentration issues.
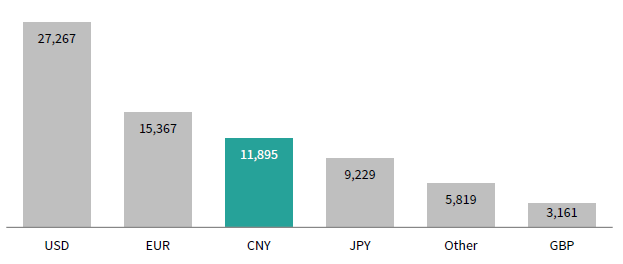
The onshore CNY-denominated market is the true Chinese bond market, with a size of RMB 79.7 trillion (or approximately US$11.9 trillion), making it the second-largest individual bond market in the world (or third largest considering the Eurozone bond market as a whole) (Figure 2).
FIGURE 2 CHINA’S ONSHORE BOND MARKET IS THIRD LARGEST IN THE WORLD
As of October 31, 2020 • US Dollar (billions)
Sources: Bloomberg Index Services Limited and China Central Depository & Clearing Co., Ltd.
Notes: Market size is based on the Bloomberg Barclays Global Aggregate Bond Index, except for the CNY-denominated bond market, which is based on the ChinaBond New Composite Index.
The onshore bond market can further be subdivided into the Chinese Interbank Bond Market (CIBM) and the exchange-traded bond market. This paper will focus on the CIBM since it accounts for close to 90% of outstanding bond issuance and is the market that foreign investors have been given access to via the CIBM Access Program and Bond Connect Program.
Accessing the Onshore Market
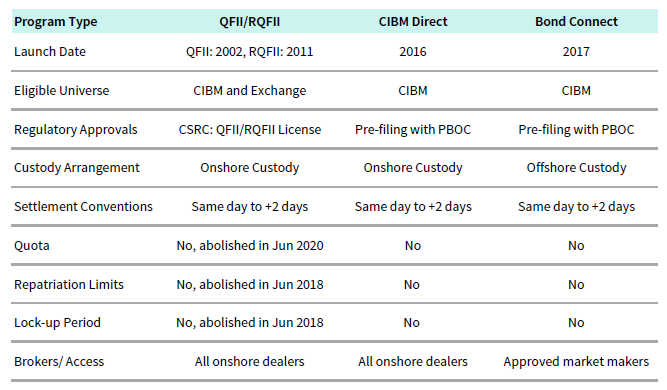
Since 2016, Chinese authorities have implemented various programs and measures to improve the accessibility of the onshore bond market for foreign investors. In February 2016, the introduction of the CIBM Direct Access program allowed foreign institutional investors to access the CIBM with no investment quotas or repatriation restrictions applied. All that was required was to register with the PBOC and appoint an onshore custody bank. Since the launch of the CIBM Direct, further reforms have been made to address investor concerns surrounding settlement cycles and the ability to trade onshore CNY currency forwards for hedging.
A separate Bond Connect program, launched in July 2017, provides another route to access the CIBM. Rather than register and settle trades onshore, investors can register offshore in Hong Kong and use the Hong Kong Monetary Authority (the de facto central bank) as the clearing bank and counterparty through its Central Money Markets Unit (CMU), an entity with a credit rating (AA+) currently higher than the Chinese government (A+). The Bond Connect further eases investor concerns over repatriation and capital account risk since the assets are held and settled offshore. Onshore currency hedging provisions are also available to help investors manage foreign exchange risk, and block trading has been allowed for sizeable trades. The ease and scalability of the access channel has contributed to its popularity, and as of October 2020, there are more than 2,200 approved investors from across 33 jurisdictions on the Bond Connect.
While the CIBM Direct and Bond Connect schemes have helped to facilitate foreign investors’ access to onshore China bonds, reforms have also been made to the original inbound schemes—the Qualified Foreign Institutional Investors (QFII) and Renminbi Qualified Foreign Institutional Investors (RQFII) schemes (Figure 3). In June 2018, repatriation and holding period restrictions for QFII/RQFII funds were removed, and in June 2020, quota restrictions were abolished and procedures for the repatriation of funds were simplified. Finally, in response to investor feedback regarding the ease of access, Chinese authorities announced that from November 2020 onward, qualification requirements for QFII/RQFII will be integrated and relaxed, and the application process will be streamlined.
FIGURE 3 INBOUND BOND PROGRAMS FACILITATE FOREIGN INVESTMENT IN CHINA
As of October 31, 2020
Sources: BlackRock, China Securities Regulatory Commission, and J.P. Morgan Asset Management.
Overview of the CIBM
The CIBM is the dominant market in China because commercial banks are the largest holders of bonds in China. Thus, the CIBM has the highest trading volumes and the widest range of bonds available. The CIBM is regulated by the PBOC and is supported by the China Central Depository & Clearing Co., Ltd. The CIBM can be broadly grouped into four main segments (Figure 4).
FIGURE 4 CENTRAL GOVT BONDS ACCOUNT FOR 1/5 OF THE MARKET
As of October 31, 2020
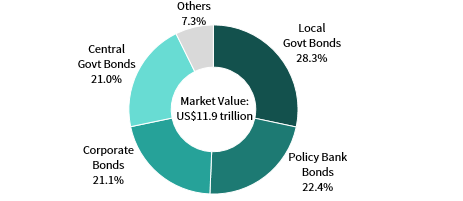
Source: China Central Depository & Clearing Co., Ltd.
Notes: Categories are based on the ChinaBond New Composite Index. Others includes commercial papers and agency bonds.
- Policy Bank Bonds. Bonds issued by the three main development banks (China Development Bank, Agricultural Development Bank of China, and the Export-Import Bank of China) account for 22% of the market and are the most actively traded segment. Though not technically sovereign bonds, they are viewed as such by local investors and traded similarly.
- Central Government Bonds. China’s central government bonds (CGBs), are typical sovereign bonds issued in a range of maturities. These bonds are the second most actively traded segment.
- Local Government Bonds. Created to allow local governments to refinance short-term bank loans into longer-term bonds, local government bonds are largely held by banks. These obligations of provincial-level governments are considered illiquid. Though not backed by the central government, local investors view these bonds as having an implicit government guarantee.
- Corporate Credit. The various types of corporate bonds issued in China account for more than a fifth of the market. 3 Most of the corporate credit segment is made up of bonds from state-owned enterprises (SOEs) and liquidity can be poor for some segments. Some analysts make a distinction for the bonds issued by the four major central government–owned banks (Agricultural Bank of China, Bank of China, China Construction Bank, and Industrial and Commercial Bank of China), which are viewed as having implicit government guarantees.
Credit Quality and Ratings
Most bonds in China are rated by domestic rating agencies, whose ratings are not comparable with those of international rating agencies. More than half of the market is considered “AAA.” Generally speaking, the informal threshold for “investment grade” is AA; issuers that would fall below AA simply opt to remain “unrated.”
However, international credit rating agencies have been able to operate in China since 2019, with S&P and Fitch approved and Moody’s application still pending. While the number of ratings issued by global agencies remains low for the moment, the gradual availability of international credit ratings will help to provide greater clarity on the credit quality of China’s bond market and increase investor confidence over time.
Concerns over credit quality and credit risk in China are warranted. Since 2018, the number and market value of China bond defaults has increased from US$2.5 billion in 2017 to US$25 billion year-to-date in 2020 (Figure 5). The rise in the number of defaults between 2018 and 2019 came as Chinese authorities tightened financial regulations in a bid to curb excessive borrowing and the shadow banking sector. Defaults in 2020 have increased as a result of the pandemic, but monetary policy easing by the PBOC and a relaxation of corporate fundraising restrictions have helped to lower companies’ financing costs and improve liquidity.
FIGURE 5 CREDIT DEFAULTS CONTINUE TO RISE
2015—2020 • US Dollar (billions)
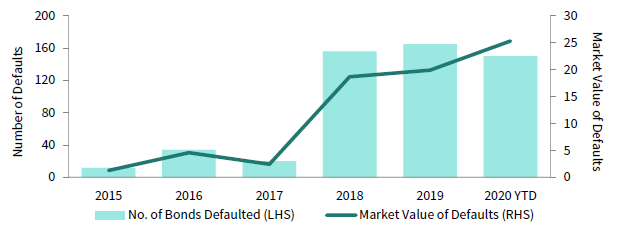
Source: China Central Depository & Clearing Co., Ltd.
Note: Credit default data for 2020 are as of October 31, 2020.
Most bond defaults in recent years have been by privately owned enterprises, which account for just 6% of China’s corporate bond market. In contrast, around 90% of the corporate bond market comprises issues from SOEs. Historically, many domestic investors and domestic mutual funds actively hold credit exposure given a pervasive belief that SOE-backed entities carry no default risk because the central government will bail out investors to avert economic and social unrest.
However, recent high-profile defaults by SOEs indicate a change in the central government’s stance toward such bailouts. Yet these recent defaults have yet to generate a meaningful repricing of credit risk in the market, as there remains little difference between yields and spreads across companies and sectors, despite obvious differences in underlying fundamentals. As a result, most foreign investors deem credit risk to be fundamentally mispriced in China, and generally avoid much of the corporate credit space in the onshore market. Concerns over liquidity, the quality of financial disclosures, and the reliability of corporate data only add to the skepticism. This contrasts with Chinese debt in the USD-denominated bond market, which trades actively with dispersion across issuers.
Investor Base
The investor base in China is unlike most other markets. Commercial banks hold 67% of all bonds, compared to only 19% for “fund institutions” or asset managers (Figure 6). Currently, foreign investors account for around 4% of bond holdings. However, foreign holdings have doubled since 2018 and are concentrated in the CGB and Policy Bank segments, of which foreigners hold 10% and 5% of the market, respectively (Figure 7). Foreign investors hold very few corporate bonds or local government bonds, largely for the liquidity and credit risks discussed above.
FIGURE 6 COMMERCIAL BANKS ARE THE PRIMARY HOLDERS OF ONSHORE BONDS
As of October 31, 2020 • Percent (%)
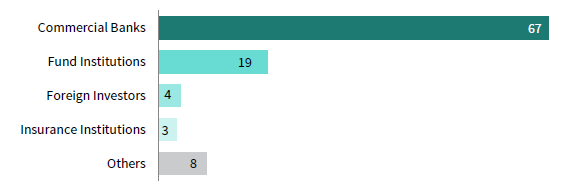
Source: China Central Depository & Clearing Co., Ltd.
Notes: Data reflect the ownership structure of Chinese bonds in the Interbank market. Total may not sum to 100% due to rounding.
FIGURE 7 FOREIGN HOLDINGS HAVE DOUBLED SINCE 2018 AND ARE
CONCENTRATED IN CGBS AND POLICY BANKS
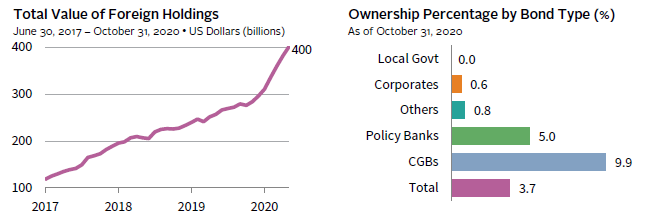
Sources: Bond Connect and China Central Depository & Clearing Co., Ltd.
Notes: Data reflect the foreign holdings of Chinese bonds in the Interbank market. Others includes government-sponsored bonds, asset-backed securities, and mortgage-backed securities.
Liquidity and Index Inclusion
The concentrated nature of holdings understandably raises questions about market liquidity, as banks tend to buy and hold bonds to maturity. In general, policy bank bonds and CGBs are the most liquid, and local government bonds and certain credit segments are deemed illiquid. However, some managers complain that even among CGBs, liquidity exists only for on-the-run issues. Other analysts argue that overall liquidity is comparable to other developed bond markets. Ultimately, most foreign investors only consider the CGBs and policy bank bonds as “investable,” and these are the two segments included in global bond benchmarks.
In April 2019, Bloomberg Barclays commenced the inclusion of CGBs and policy bank bonds in its Global Aggregate Index. Other global index providers have also followed suit, but these are focused on the CGBs segment. J.P. Morgan will complete the inclusion of CGBs in its Government Bond Index-Emerging Markets Global Diversified Index by the end of 2020, and FTSE recently announced that CGBs will be added to the World Government Bond Index over a 12-month period starting in October 2021. The final index weight of China onshore bonds in these benchmarks are in the range of 6%–10% (Figure 8). Based on the current assets under management of these benchmarks, the resultant estimated index-related flows into onshore bonds are in the range of US$290 billion. For context, this amount is less than the total CGB bond issuance in the first six months of 2020.
FIGURE 8 INDEX FUND FLOWS MAY AMOUNT TO US$290B
As of October 31, 2020 • Percent (%) • US Dollar (billions)
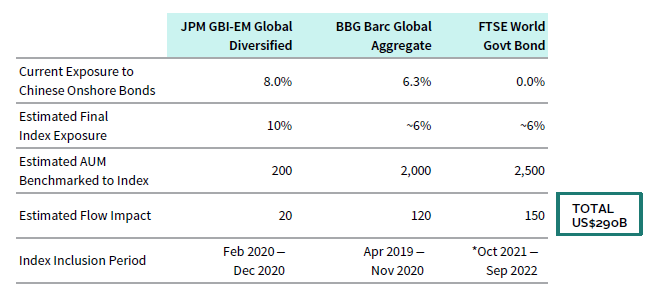
* Subject to confirmation in March 2021.
Sources: Barclays, Bloomberg Index Services Limited, FTSE Fixed Income LLC, and J.P. Morgan Securities, Inc.
Notes: Estimates are subject to change. Estimated flow impact calculated as estimated AUM benchmarked to index multiplied by
estimated final index exposure.
Risk/Return Characteristics
Given that Chinese central government bonds are the focus of global and emerging markets bond indexes inclusion, we will focus primarily on the risk/return characteristics of this segment. For analysis of other onshore bond segments, see Appendix 1.
Historically, Chinese government bonds have exhibited risk/return characteristics more akin to high-quality developed markets sovereign bonds than emerging markets local currency sovereign bonds. Since January 2004 (when our data begin), onshore Chinese government bonds have generated annualized total returns similar to US and global government bonds, but well below those of emerging markets sovereign bonds, based on representative index returns. This is because bond yields in China have historically been more similar to developed markets than emerging markets (Figure 9).
FIGURE 9 THE RISK/RETURN CHARACTERISTICS OF CHINESE GOVERNMENT BONDS
ALIGN WITH DEVELOPED MARKETS SOVEREIGN BONDS
As of October 31, 2020 • Percent (%)
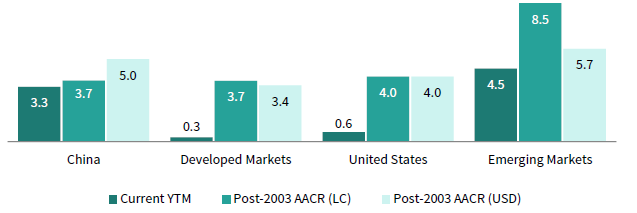
Sources: Bloomberg Index Services Limited, FTSE Fixed Income LLC, J.P. Morgan Securities, Inc., and Thomson Reuters Datastream.
Notes: Performance based on total returns. China is represented by the J.P. Morgan GBI-EM China Broad Index, Developed Markets is represented by the FTSE World Government Bond Index, United States is represented by the Bloomberg Barclays US Treasury Index, and Emerging Markets is represented by the J.P. Morgan GBI-EM Global Diversified Index.
In terms of volatility, Chinese bonds are no more volatile than US Treasuries in local currency terms. Indeed, most bond markets have average volatility in the 3%–4% range (Figure 10). Given that China has historically kept a tight leash on the RMB and that for much of the 2004–20 period the RMB has appreciated, the volatility of Chinese government bonds in USD terms over this timeframe has been only marginally higher than it is in local currency terms and has comparable volatility to US Treasuries. This contrasts with global bonds and emerging markets bonds, which have USD volatility double and triple, respectively, their local currency volatility. Furthermore, for emerging markets bonds, currency exposure has reduced returns rather than boost them.
FIGURE 10 CHINESE GOVT BOND VOLATILITY IS SIMILAR TO US GOVT BONDS
January 31, 2004 – October 31, 2020 • Percent (%)

Sources: Bloomberg Index Services Limited, FTSE Fixed Income LLC, J.P. Morgan Securities, Inc., and Thomson Reuters Datastream.
Notes: Volatility based on annualized standard deviation of monthly total returns. China is represented by the J.P. Morgan GBI-EM China Broad Index, Developed Markets is represented by the FTSE World Government Bond Index, United States is represented by the Bloomberg Barclays US Treasury Index, and Emerging Markets is represented by the J.P. Morgan GBI-EM Global Diversified Index.
Chinese government bonds also exhibit low correlations to other bond markets, and in fact are more correlated to developed markets sovereign bonds than to emerging markets sovereign bonds. The lower volatility and correlation of CGBs to emerging markets government bonds likely reflects that China runs a current account surplus and is a net creditor to the world. In contrast, most of the countries that make up emerging markets bond indexes run current account deficits and rely on foreign investors to fund government borrowing.
Consequently, in periods of market stress, Chinese government bonds tend to rally. By contrast, emerging markets bonds and currencies tend to sell off as foreign investors pull out of the market and domestic institutions can’t absorb the selling, resulting in negative emerging markets bond returns in hard currency terms. Indeed, Chinese government bonds have been resilient during periods of global equity market sell-offs (2007–09, 2011, 2015–16, 2018, and 2020), producing positive local currency returns. While unhedged RMB exposure has at times boosted or diminished returns in USD terms, Chinese government bonds have performed in-line with global government bonds, and outperformed emerging markets bonds. (Figure 11).
FIGURE 11 CHINESE GOVERNMENT BONDS TEND TO RALLY DURING EQUITY MARKET DECLINES
Percent (%)
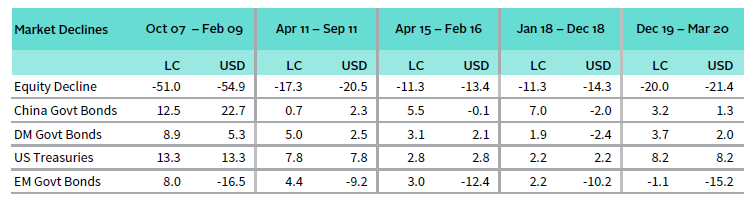
Sources: Bloomberg Index Services Limited, FTSE Fixed Income LLC, J.P. Morgan Securities, Inc., MSCI Inc., and Thomson Reuters Datastream. MSCI data provided “as is” without any express or implied warranties.
Notes: China Govt Bonds represented by the J.P. Morgan GBI-EM China Broad Index, DM Govt Bonds represented by the FTSE World Government Bond Index, US Treasuries represented by Bloomberg Barclays US Treasury Index, and EM Govt Bonds represented by the J.P. Morgan GBI-EM Global Diversified Index. Equity decline based on the MSCI All Country World Index price levels on a monthly basis. Performance reflects total returns, with MSCI index total returns net of dividend taxes.
Overall, the combination of a current account surplus, a partially closed capital account, and a market dominated by domestic investors with a buy-and-hold mentality makes Chinese government bonds more akin to developed markets sovereign bonds than emerging markets sovereign bonds. Indeed, the addition of CGBs to global fixed income benchmarks should lower overall index volatility, especially given the low correlation of Chinese government bonds to other bond markets.
Market Outlook
In the current low-yield environment, many investors are excited about Chinese bonds given ten-year sovereign yields north of 3.0%. Though yields are below their 2013 peaks, spreads versus other developed bond markets are near record highs (Figure 12).
FIGURE 12 YIELD SPREADS FOR CHINESE BONDS ARE NEAR RECORD HIGHS
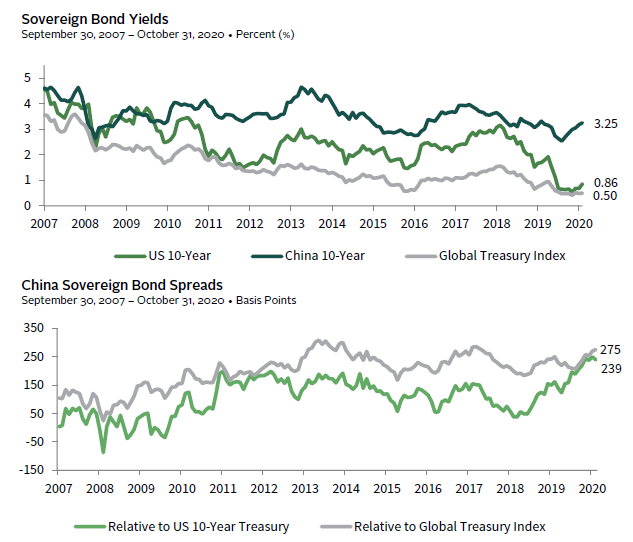
Sources: Bloomberg Index Services Limited and Thomson Reuters Datastream.
Notes: US and China sovereign bonds are represented by the Benchmark 10-Year Datastream Government Indexes. Global sovereign bonds are represented by the Bloomberg Barclays Global Treasury Bond Index.
However, the RMB remains a major concern for investors, as currency weakness could wipe out any extra return from higher yields. At the same time, hedging the RMB is costly. Negative carry for CNH has generally been higher than CNY and has become more volatile since 2015, as the PBOC has routinely intervened in the offshore market to squeeze short sellers and support the RMB. Once CNH hedging is factored in, the yield on Chinese bonds falls from 3.25% to 0.81%. This is marginally higher than the carry-adjusted bond yields for Germany (0.23%) and Japan (0.56%). The hedged yields would be even worse for European and Japanese investors, as we show in Appendix 2.
RMB-hedged China bond exposure is thus not a yield play, but a bet that bond yields will fall (i.e., a hope for capital appreciation) or hopes that Chinese yields will rise less than global yields should interest rates normalize. RMB-hedged exposure may also appeal to investors that have a bearish view on the Chinese economy or seek to hedge their exposure to other RMB-denominated assets such as public and private equity. Should the Chinese economy falter, bond yields could fall sharply.
At the same time, some investors are comfortable with unhedged exposure to Chinese yields and the RMB. This approach is based on a view that the RMB is set to appreciate due to continued USD weakness and/or because they view the RMB as a managed currency that is inherently less volatile than other currencies (including developed markets currencies), given China’s currency reserves and the PBOC’s historical willingness to intervene to support the RMB.
For now, the wide yield spread in China’s favor is likely to continue to support the RMB, as ultra-low yields outside of China (and growing hostility to Chinese capital overseas) reduces domestic capital outflows and attracts inflows. Yet increased foreign inflows and China’s desire to “internationalize” the RMB, which requires more free flow of capital, may mean the volatility of the RMB will be higher going forward than it has been in the past. Thus, investors must decide whether they are comfortable with the currency risk or willing to sacrifice yield to hedge it out.
Geopolitical and ESG Considerations
Geopolitical and ESG risk factors are also top of mind for investors in the current market environment. Many investors are concerned about the potential for geopolitical conflict between China and the United States (and other countries) to result in capital controls or seizure of foreign assets.
However, despite the rising political tensions and overseas governments becoming hostile to Chinese companies and capital, China has not retaliated against foreign investors and has continued to open in domestic markets. This is because attracting foreign capital and “internationalizing” the RMB remain key policy goals, which require open access and repatriation of foreign capital.
For some investors, China’s record on human rights and political freedom is another issue. Unlike equity investments in Chinese private companies, purchasing Chinese government bonds is directly financing the Chinese government. For some investors, this may be politically unappealing or contentious with key stakeholders.
China also scores below average on environmental, social, and governance (ESG) factors, with MSCI scoring China “BB” based on their government bond rating system. This results in Chinese bonds being underweighted or even excluded from some ESG-focused bond index strategies and managers.
Investors will need to determine whether the return potential and diversification benefits of Chinese government bonds outweigh the above factors.
Implementation Options
At the moment, the number of active managers with dedicated China fixed income strategies is limited. Additionally, most of the managers are not solely focused on Chinese government bonds, but rather incorporate a mix of government and credit exposure in their portfolios. It is also common for the more credit-focused funds to invest in both the onshore and offshore bond markets, seeking to capitalize on relative pricing differences. Nonetheless, the the universe of China bond funds has expanded since 2017 and is a growing area of interest of asset managers, given recent index inclusion changes and the meaningful size of the China bond market.
For investors that are interested in dedicated exposure to Chinese government bonds and are comfortable with a passive investment approach, there are a few exchange-traded funds (ETFs) available and listed in Appendix 3. While there are a few large and liquid ETFs, the size of assets under management for the majority is small (less than US$100 million) and comes with relatively poor liquidity, especially for US investors. Management fees for these ETFs can also be high, ranging from 0.25% to more than 1.00%, and large tracking errors may arise from market inefficiencies surrounding high bid-to-ask spreads for off-the-run CGBs.
Conclusion
The onshore Chinese bond market is now open to foreign investors. But despite its seemingly large size, it is still far from fully investable, especially the corporate credit space. As Chinese government bonds are added to global fixed income benchmarks, overall index returns may be boosted by China’s yields and volatility will likely be lowered because of the risk/return profile and correlations of onshore Chinese bonds.
In today’s yield-starved environment, China’s bond market stands out. Dedicated Chinese bond allocations may be appealing to investors that have RMB liabilities or spending needs. In addition, investors with high conviction in RMB strength and willingness to tolerate the extra volatility may find unhedged RMB bonds more attractive than global bonds or a complement to such exposure.
Appendix 1
SINCE INCEPTION RISK/RETURN CHARACTERISTICS: BLOOMBERG BARCLAYS CHINA BOND INDEXES
January 31, 2004 – October 31, 2020 • Local Currency
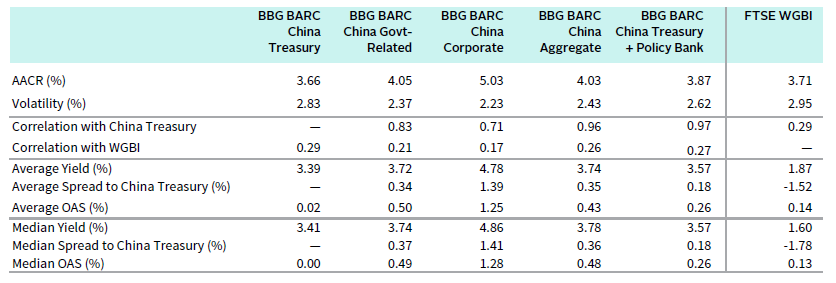
Sources: Bloomberg Index Services Limited, FTSE Fixed Income LLC, and Thomson Reuters Datastream.
BLOOMBERG BARCLAYS CHINA AGGREGATE INDEX WEIGHT
As of October 31, 2020
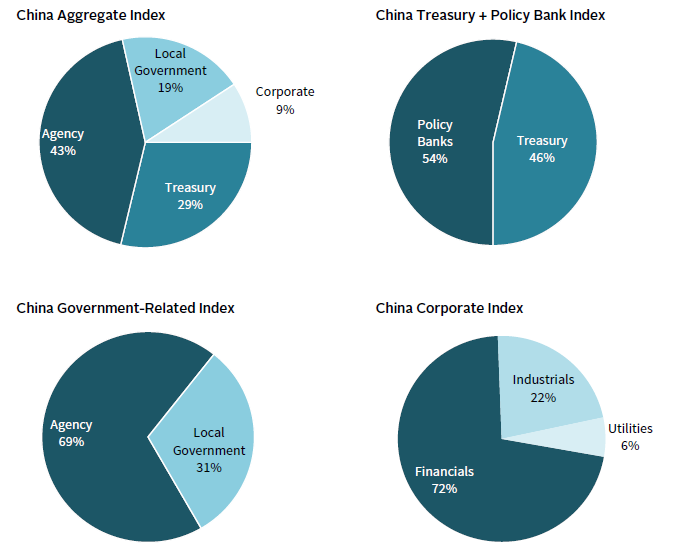
Sources: Bloomberg Index Services Limited and Bloomberg L.P.
SINCE INCEPTION RISK/RETURN CHARACTERISTICS: J.P. MORGAN CHINA BOND INDEXES
January 31, 2004 – October 31, 2020 • Local Currency
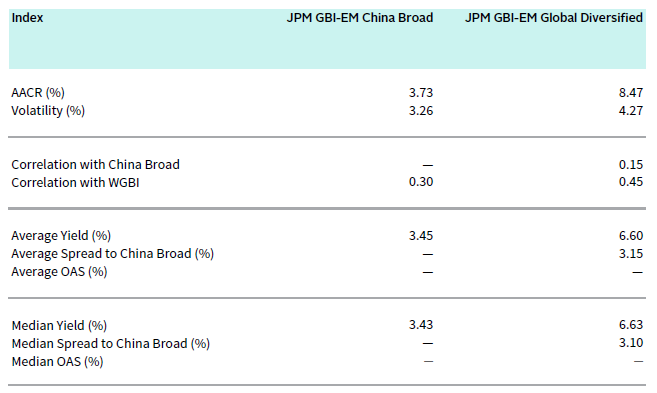
Sources: J.P. Morgan Securities Inc. and Thomson Reuters Datastream.
Appendix 2
THE COST OF HEDGING RMB EXPOSURE IN VARIOUS CURRENCIES
As of October 31, 2020
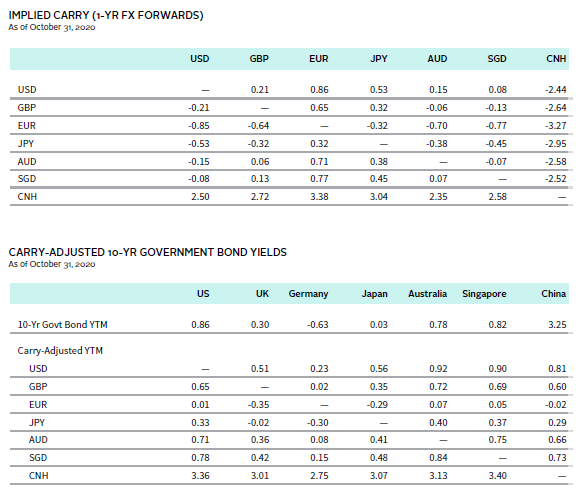
Source: Thomson Reuters Datastream.
Note: Carry-adjusted yield is the ten-year government bond yield plus one-year implied carry.
Appendix 3
SELECTED ETFS
As of November 10, 2020
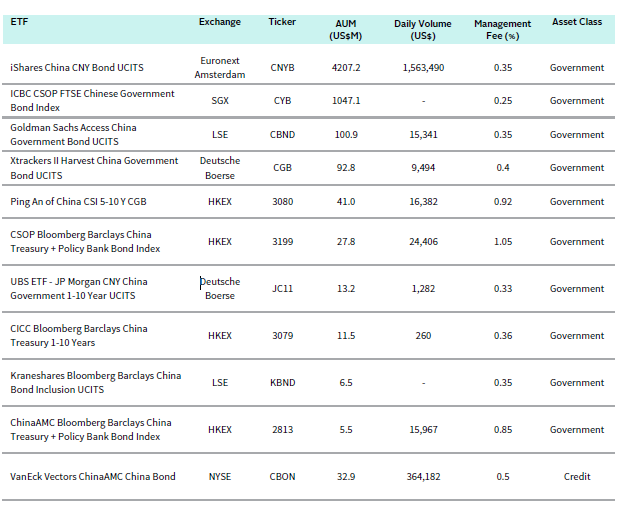
Source: Bloomberg L.P.
Notes: Daily volume data are represented by the average daily traded values in USD terms for the past six months. Daily volume data for ICBC CSOP FTSE Chinese Government Bond Index ETF and Kraneshares Bloomberg Barclays China Bond Inclusion UCITS ETF are not available. List is based on author’s knowledge of ETFs’ existence at time of publication and is not necessarily a complete representation of available ETFs. Inclusion of an ETF on this list does not indicate that Cambridge Associates endorses the ETF or has conducted any form of investment review.
Index Disclosures
Bloomberg Barclays Global Aggregate Bond Index
The Bloomberg Barclays Global Aggregate Index measures global investment-grade debt from 24 local currency markets. This multi-currency benchmark includes Treasury, government-related, corporate, and securitized fixed-rate bonds from both developed and emerging markets issuers.
Bloomberg Barclays Global Treasury Index
The Bloomberg Barclays Global Treasury Index tracks fixed-rate, local currency government debt of investment- grade countries, including both developed and emerging markets. The index represents the treasury sector of the Global Aggregate Index and contains issues from 37 countries denominated in 24 currencies.
Bloomberg Barclays US Aggregate Bond Index
The Bloomberg Barclays US Aggregate Bond Index measures the investment-grade, USD-denominated, fixed-rate taxable bond market. The index includes Treasuries, government-related and corporate securities, MBS (agency fixed-rate pass-throughs), ABS, and CMBS (agency and non-agency).
ChinaBond New Composite Index
The ChinaBond New Composite Bond Index is designed to track the overall performance of RMB-denominated domestic bond market. It includes all outstanding bonds publicly traded in the domestic market (ABS/ABN, convertible bonds excluded).
FTSE Dim Sum (Offshore CNY) Bond Index
The FTSE Dim Sum (Offshore CNY) Bond Index measures the performance of offshore Chinese yuan “dim sum” bonds issued and settled outside mainland China. The index covers fixed-rate securities issued by governments, agencies, supranationals, and corporations.
FTSE World Government Bond Index
The FTSE World Government Bond Index measures the performance of fixed-rate, local currency, investment-grade sovereign bonds. It is composed of sovereign debt from more than 20 countries, denominated in a variety of currencies.
J.P. Morgan Government Bond Index – Emerging Markets Diversified Index
The J.P. Morgan Government Bond Index – Emerging Markets Diversified Index is a comprehensive measure of local currency-denominated, fixed-rate government debt issued in emerging markets. Returns are available from January 2003 for diversified indexes.
J.P. Morgan JACI China Index
The J.P. Morgan JACI China Index is a subset of the J.P. Morgan Asia Credit Index and measures total returns of liquid USD-denominated debt in mainland China. It is a market capitalization–weighted index including sovereign, quasi-
sovereign and corporate bonds, partitioned by country, sector and credit rating.
MSCI All Country World Index
The MSCI ACWI is a free float–adjusted, market capitalization–weighted index designed to measure the equity market performance of developed and emerging markets. The MSCI ACWI consists of 23 developed and 26 emerging markets country indexes. The developed markets country indexes included are: Australia, Austria, Belgium, Canada, Denmark, Finland, France, Germany, Hong Kong, Ireland, Israel, Italy, Japan, the Netherlands, New Zealand, Norway, Portugal, Singapore, Spain, Sweden, Switzerland, the United Kingdom, and the United States. The emerging markets country indexes included are: Argentina, Brazil, Chile, China, Colombia, Czech Republic, Egypt, Greece, Hungary, India, Indonesia, Korea, Malaysia, Mexico, Pakistan, Peru, the Philippines, Poland, Qatar, Russia, Saudi Arabia, South Africa, Taiwan, Thailand, Turkey, and the United Arab Emirates.
Footnotes
- Please see Aaron Costello and Han Xu, “China’s Onshore Bond Market: An Introduction, Cambridge Associates LLC, 2017.
- The name and abbreviation for China’s currency is often a source of confusion for investors. The official name of the currency is the renminbi (literally “the People’s Currency”), abbreviated RMB. The basic unit is the yuan (a generic term for a unit of currency), which can be further subdivided into smaller units (e.g., jiao). In practice, both renminbi and yuan are used interchangeably for the Chinese currency. Adding to the confusion is that China has two different currency abbreviations used in the currency market. The CNY code refers to the RMB traded onshore (with values set by the People’s Bank of China [PBOC]), and the CNH code refers to the RMB traded in Hong Kong by offshore investors. Although CNY and CNH closely track each other, they can at times diverge. Thus, China has one currency (the RMB), but two different prices (onshore CNY and offshore CNH).
- China has various types of corporate bonds, as at least six different regulators are in charge of approving bond issuance depending on the type of corporate entity involved. This results in multiple names (e.g., medium-term notes, enterprise bonds) for what in most markets would simply be referred to as corporate bonds. Furthermore, depending on the regulator, some corporate bonds trade on both the CIBM and the exchange-traded market, while others are mutually exclusive.
Aaron Costello, CFA - Aaron Costello is the Head of Asia Investment Strategy and is responsible for the firm’s investment and research activities in the region.
About Cambridge Associates
Cambridge Associates is a global investment firm with 50+ years of institutional investing experience. The firm aims to help pension plans, endowments & foundations, healthcare systems, and private clients achieve their investment goals and maximize their impact on the world. Cambridge Associates delivers a range of services, including outsourced CIO, non-discretionary portfolio management, staff extension and alternative asset class mandates. Contact us today.