Outlook 2020: Ten Investing Themes for the Coming Year

CONTENTS
- Introduction
- Global Economy Poised for Moderate Growth at Best
- Political Uncertainty Will Weigh on Confidence and Growth
- For Investors in China, the Biggest Risk Is US Policy
- The Upside to Bonds with Record Low Yields Lies in the Downside
- Credit Investors Should Trade Liquidity for Opportunity in 2020
- Value Investing Isn’t Dead; Time to Position for a Recovery
- Equity Long/Short Game Isn’t Over, but the Rules Have Changed
- Secondaries No Longer Relegated to the Kids’ Table
- Real Assets Categories Merge, Creating New Opportunities
- Investors Should Embrace Resilience in 2020
- Conclusion
 |
Introduction
Wade O’Brien, Managing Director, Capital Markets Research |
Our outlook last year struck a cautious yet constructive tone, arguing that an aging bull market still had legs despite mounting macro headwinds. In the end, we were probably not constructive enough, as major equity markets look on track to deliver healthy double-digit returns in 2019. Nor did we anticipate that high-quality bonds would post their best returns in more than a decade. Still, this year’s returns have been driven more by what has not gone wrong as opposed to what has gone right; slowing economic growth and lackluster earnings have not dissuaded investors relieved by dovish central banks and a slight easing of geopolitical risks.
It is an open question whether investors will remain so sanguine in 2020. The US and China are settling into a protracted battle over strategic interests, global economic growth is slowing, and central banks are running out of options. Meanwhile, political uncertainty is not just elevated by forthcoming US elections and Brexit; voters are voicing their frustrations everywhere from Argentina to Hong Kong. Even if politics and growth do surprise to the upside, weak earnings and stretched valuations, at least for many assets, may weigh on returns.
The ten pieces that follow discuss key macro questions, emerging opportunities, and risks in 2020. Growing tensions between the US and China could restrict capital flows and hurt investors in both nations. Near-zero interest rates across many developed countries mean limited upside for high-quality sovereign bonds, but we still believe bonds offer valuable downside protection. Credit investors face frustrating prospects given low yields for many liquid assets, but private credit (for those who can lock up capital) should prove more lucrative. In equities, we argue that the valuation differential between growth and value stocks may have reached an inflection point and that some easing of geopolitical concerns or policy uncertainty combined with a cyclical economic rebound could narrow the gap and allow value to outperform once again.
The subdued outlook for many public assets will push investors to continue exploring private opportunities, where barriers to entry are higher and more targeted themes can be explored. Secondary funds and direct transactions offer a compelling opportunity to shape and build exposure to private investments and have the added benefits of discounted pricing and a more immediate return of capital. Certain private real asset funds are also the preferred means of playing secular themes such as urbanization and technological innovation. Whether investors favor public or private investments in 2020, they should aim to insulate portfolios against longer-term risks including climate change and growing inequality.
Twelve months from now when we look back on what we got wrong, the list could be long, given the unusually high number of “known unknowns.” However, the flipside is that 2020 is unlikely to be dull, and an increase in volatility could unearth more opportunity for prepared and patient investors.
 |
Global Economy Poised for Moderate Growth at Best
Kevin Rosenbaum, Deputy Head of Capital Markets Research |
A fragile global economy will greet investors in 2020. Foremost on many minds is the prospect of US-China trade tensions further hampering global demand and investment. To date, these tensions have been impactful, with both trade and manufacturing data in contraction. The prolonged period of uncertainty has also impacted the less trade-sensitive services sector, where survey-based indicators have steadily weakened to just muted expansion levels. But, regardless of whether protectionist or free-trade policies are championed next year, the limited slack left in the global economy will be an important constraint on overall growth.
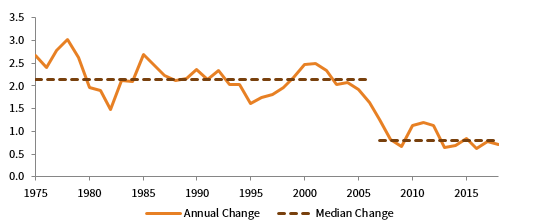
Put simply, economic output is determined by the total number of hours worked and the average productivity of each hour. While growth in both factors have contributed to the current economic expansion, tight labor markets make gains in the total number of hours worked difficult. One proxy of global labor market conditions—the number of unemployed people actively searching for work across the seven largest industrialized countries—has fallen to an all-time low of 4.2%, according to OECD data beginning in 1991. If labor markets have limited slack, economic growth will be more dependent on changes to the average productivity of each hour worked.
G-7 REAL GDP PER HOUR WORKED
1975–2018 • Percent (%)
Source: OECD.
Note: The data reflect the annual change in real GDP per hour worked across G-7 countries, smoothed over a trailing three-year period.
But this productivity measure has been weak for years, and in fact, productivity in the US fell last quarter for the first time since 2015. While advancements in automation, robotics, and quantum computing may eventually return us to productivity growth levels enjoyed prior to the global financial crisis (GFC), greater adoption rates of existing technologies will be critical to next year’s productivity growth. The challenge is that adoption rates depend on investment, and with high levels of uncertainty, investment has been weak of late. This is not to say we doubt the consensus global growth estimate of 3.0%. Instead, risks to that outlook aren’t evenly distributed; they are skewed to the downside. Since market turmoil and economic setbacks often overlap, investors should review portfolios to ensure they are properly positioned to navigate equity stress.
 |
Political Uncertainty Will Weigh on Confidence and Growth
Sean Duffin, Director, Capital Markets Research |
Political tensions will continue to simmer across the global economy in 2020, perpetuating policy uncertainty and weighing on economic growth. The nascent impeachment process against President Trump is unpredictable, but it may limit the president’s ability to respond to any renewed economic weakness and compound the negative influence of trade tensions. Heading into a presidential election year, the more constructive argument for growth and for markets is that the Trump administration will do everything in its power to support US economic activity and asset prices. The flipside, though, is that spending capacity might be circumscribed by elevated deficits and a divided Congress.
The US-China trade war has proven difficult for investors to navigate. A resolution remains elusive as the average US tariff on Chinese exports now tops 21% (it has doubled over the past year and is nearly matched by Chinese tariffs on US exports). The result has been reduced trade both between the two nations and also across a variety of partners involved in global supply chains. Global growth has softened, weighed down by weaker manufacturing activity, and financial markets have been whipsawed. Political turmoil could incentivize the White House to hasten a trade deal with China and assert a much-needed victory, however the impetus isn’t bilateral; Chinese trade officials will harden their stance if they believe President Trump is vulnerable and unlikely to be elected to a second term.
The Trump administration will probably attempt measures to further support the slowing US economy as the 2020 election approaches. Yet, ongoing partisan gridlock could mire meaningful fiscal initiatives, such as infrastructure spending or additional tax cuts. The Administration’s unilateral options to boost the economy are limited, but the White House previously considered options, such as using executive authority to lower capital gains taxes. President Trump could also continue to pressure the Fed to ease monetary policy and can tout positive developments in US-China trade talks to inject short-term confidence into markets. Still, the broad range of topics recently included in the trade talks (tariffs, national security, technology transfer, etc.) reduces the odds of a comprehensive agreement and suggests tension could linger.
With no substantive long-term resolution on trade policy in sight and the impeachment process likely to be prolonged, US political developments present a key risk to financial markets in 2020. Markets do not necessarily need strong economic growth to generate positive returns. However, following a weak 2019 for earnings growth, investors may be less forgiving a second time around, given the uncertain political backdrop. President Trump will likely attempt steps to support the economy in the 2020 election year, but with his hands bound by Congress, he may struggle to overcome the elevated political and macro uncertainty.
 |
For Investors in China, the Biggest Risk Is US Policy
Aaron Costello, Managing Director, Capital Markets Research |
Despite the recently announced (but not yet finalized) “Phase One” trade deal, tensions between the US and China will remain elevated in 2020 and will rotate from trade to investment. There is growing bi-partisan support in the US Congress for limiting US investment in China. Recent media reports suggest a range of policy ideas are being discussed, such as de-listing Chinese companies from US exchanges, preventing US government pension funds from investing in China, and limiting China’s exposure in investment benchmarks calculated by US companies. The expanded remit of the Committee on Foreign Investment in the US (CFIUS) has already dramatically reduced M&A activity between the US and China.
US-CHINA CROSS BORDER M&A DEAL VALUE FROM THE ACQUIRER’S PERSPECTIVE
January 1, 2000 – October 31, 2019 • USD Billions
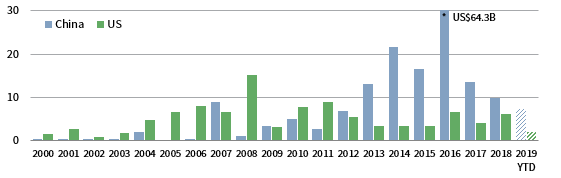
* Graph is capped for scaling purposes. The top five M&A deals accounted for US$34.1 billion of the total deal value.
Source: Dealogic.
Halting US investment in China and limiting China’s access to US capital markets is part of the economic and financial “de-coupling” of the two nations long advocated by China hawks. The goal is to starve China of capital and customers, halting its rise as a strategic threat to the US. Yet as the US government puts up barriers to Chinese investment, China continues to open its markets to be more attractive to capital, most recently with the removal of qualified foreign institutional investors quotas.
Indeed, US policy may backfire and starve the US economy of capital when it remains reliant on foreign capital to fund its current account and fiscal deficits. China holds $1.1 trillion worth of US Treasuries, and reduced demand could push yields higher and the US dollar lower. In contrast, US investors only own an estimated $200 billion of onshore Chinese stocks and bonds.
Meanwhile, forcing US investors to divest from China would hit the $1 trillion market capitalization of US-listed Chinese companies and disrupt private equity and venture capital fundraising and valuations. While this would negatively impact existing investors, US divestment could create opportunities for non-US investors to fill the void.
It remains to be seen whether such policies will be implemented or will withstand legal challenges. But the fact that such policies are being discussed suggest any thawing of tensions may be temporary. As a result, the biggest risk for investors with exposure to China in 2020 is not the Chinese Communist Party, but the US government.
 |
The Upside to Bonds with Record Low Yields Lies in the Downside
TJ Scavone, Director, Capital Markets Research |
The 2018 bond bear market proved to be short lived, as yields on high-quality government bonds peaked in late 2018 before experiencing a sustained decline in 2019 (bond prices rise when yields decline). High-quality government bonds have limited long-term return prospects, with global yields now back near record lows. We still think they serve an important diversifying role in portfolios in 2020 but advise against taking country-specific duration risk in markets where rates have turned deeply negative.
The initial yield on high-quality government bonds is a reliable indicator of future returns over longer investment horizons, but changes in yields hold sway over shorter periods. In a given year, the direction of yields can hinge on the cyclical backdrop. A significant slowdown in global growth, as well as concerns over rising trade tensions and more dovish central banks, pulled yields lower in 2019. These forces—growth trends in particular—are likely to continue to dictate the path of yields in 2020. Even if a recession is not imminent, there is little evidence that a meaningful pick-up in growth is around the corner, given remaining uncertainty over trade, Brexit, politics, etc. Yields might move marginally higher from current levels (perhaps resulting from a trade détente and/or a hawkish surprise from central banks), but due to the length of the expansion, with growth slowing, recession risks rising, and uncertainty elevated, it is more likely that the late-cycle environment will continue to support bond prices in 2020.
ANNUAL CHANGES IN GLOBAL COMPOSITE PMI VS GDP-WEIGHTED 10-YR G4 TREASURY YIELDS
July 31, 2009 – October 31, 2019 • 3-Mo Moving Average (YOY Difference)

* Axis is capped for scaling purposes.
Sources: J.P. Morgan Securities, Inc., Markit Economics, National Sources, and Thomson Reuters Datastream.
Note: Global composite PMI represents the year-over-year difference in the index level.
Because of the cyclical backdrop, investors should continue to own some high-quality government bonds as their diversification benefits remain valuable. Historically, these assets have been one of the best diversifiers during periods of equity market stress. However, given today’s low yields, there are concerns that the zero lower-bound could constrain yields and limit the upside of high-quality government bonds in the next downturn. But, even if we assume yields cannot fall below zero (a theory that has been debunked this cycle), high-quality global government bonds and US Treasuries should still prove an effective portfolio hedge in the event of a recession, despite their low initial yields. Assuming yields fall to zero from current levels (an outcome that can no longer be ruled out), global and US high-quality government bonds would still return 7% and 13%, respectively.
|
Credit Investors Should Trade Liquidity for Opportunity in 2020
Wade O’Brien, Managing Director, Capital Markets Research |
Investors in liquid credit will earn lower returns next year, both because yields have fallen over the course of the year and because the macro backdrop is deteriorating. The better news is that a handful of attractive opportunities remain in structured credit, and investors that can lock up capital in private strategies will find both higher returns, as well as the opportunity to find less economically sensitive assets.
Lower starting yields are a strong headwind for liquid credit. US high-yield bonds are unlikely to generate another 11%+ return given current yields around 5.5%; US investment-grade bonds will not generate another 14% return given a current 3% yield. BB-rated corporate bonds, with an option-adjusted spread of just 215 bps and a yield of 4%, look particularly priced for perfection. Should US economic growth slow, softer corporate fundamentals are likely to push spreads higher. Interest coverage and leverage ratios for high-yield bonds look reasonable, but the latter have already been slowly rising in 2019. Meanwhile, underwriting standards in the leveraged loan market continue to slip. Around 60% of the loan market is single-B rated or less, in part because new leveraged loans carry almost a full turn more leverage than was the case coming out of the GFC.
Structured credit looks more appealing. US residential mortgage–backed bonds offer healthy underlying fundamentals, including elevated affordability and limited supply. Legacy non-agency mortgage pools continue to shrink, but new opportunities (such as agency “credit risk transfer” deals) have arisen in their place. CLO debt also remains attractive despite our concerns over the quality of new loan issuance. Spreads are elevated relative to liquid equivalents (e.g., BB-rated CLO debt offers 3x the spread of BB corporate bonds), and the structure has historically proven resilient to downturns, given excess collateralization and incentives for managers to remove downgraded assets (loans).
Private credit may offer better options than public equivalents in 2020, but not all market segments are enticing. So-called “uncorrelated” strategies (e.g., royalties, litigation finance, insurance-linked) typically aim for lower net returns than higher-beta peers but should be insulated from slowing economic growth. If a recession ensues or market volatility picks up, credit opportunity funds, which lend to companies facing operational difficulties, may be able to charge higher rates and obtain some equity upside through warrants or other instruments. Lending funds focused on non-sponsored, middle-market transactions may be able to obtain better documentation and terms than funds targeting larger transactions.
Distressed strategies may also be appealing, though anticipating when and for how long spreads will widen is difficult. One option is to allocate to private strategies that use a “drawdown” feature, particularly those that wait to call capital until specific triggers are reached (e.g., higher spreads or weaker economic conditions). Downgrades to some of the lower-quality bonds could create opportunities for trading-oriented distressed funds. Investors would do well to have familiarity with both as they consider allocations for 2020.
 |
Value Investing Isn’t Dead; Time to Position for a Recovery
Michael Salerno, Senior Director, Capital Markets Research |
Investors that lean into value stocks now are likely to be rewarded going forward. Ongoing structural headwinds for the value factor make it challenging to know whether calendar year 2020 will mark the start of a sustained reversal of value’s 12+ year drought relative to growth (relative valuations are in the 9th percentile of historical monthly observations since June 1926). Yet, today’s stretched valuation spreads mean the market is effectively paying investors to tilt toward the former. At the very least, value could be poised to rebound further in the near term if recent macro concerns begin to ease.
The structural regime that emerged from the GFC has made life difficult for value investors; however, reports of the value factor’s demise are overstated. Value’s deep and prolonged drawdown relative to growth this cycle, while unusual, is not unprecedented. The more economically sensitive stocks that populate traditional value indexes have suffered from persistently weak growth and inflation post-GFC because of lender and consumer retrenchment, government austerity, and technological disruption. On the other hand, a relatively small group of large technology stocks have enjoyed outsized profit margins due to winner-take-all industry dynamics, while historically low interest rates have boosted valuations for the broader growth–company universe. Yet, investors recently seeking refuge from elevated economic policy uncertainty have pushed growth stock valuations to ever higher levels that appear increasingly at odds with underlying fundamentals. As a result, value stocks have rarely traded as cheaply relative to growth counterparts as they do today.
US VALUE VS GROWTH: RELATIVE CUMULATIVE WEALTH AND VALUATION
June 30, 1926 – August 31, 2019 • Log Scale
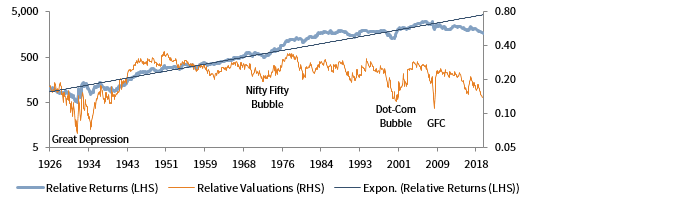
Sources: Center for Research in Security Prices and Kenneth R. French.
Though structural challenges to value investing remain, the value factor has experienced a notable resurgence since late August and could continue to rebound in 2020. A more stable economic outlook and some relief from heightened macroeconomic risks may be all that is needed for global value stocks to look more appetizing. Further political backlash and regulatory sanctions against so-called FANMAG stocks—Facebook, Amazon, Netflix, Microsoft, Apple, and Google (Alphabet)—would be icing on the cake. With valuation spreads still historically wide, value would outperform growth by double digits if we assume even modest further mean reversion. Those investors inclined to tuck into what the market is serving up should consider such overlooked treats as global financials, non-US stocks, and actively managed small-cap strategies.
 |
Equity Long/Short Game Isn’t Over, but the Rules Have Changed
Eric Costa, Global Head of Hedge Funds |
Headwinds facing fundamental equity long/short (L/S) strategies since the GFC show few signs of abating; in 2020, institutional investors should begin replacing some of this exposure with a combination of highly specialized equity L/S managers, niche or focused long/short strategies, and lower cost alternatives. Rolling annualized 36-month equity L/S strategy alpha since November 2007 has been 95% lower than that for the period from April 2000 through October 2007. While overall equity L/S alpha potential appears structurally impaired, we believe a more nuanced approach to equity L/S investing can overcome the challenges facing the broader space.
36-MONTH ANNUALIZED EQUITY LONG/SHORT STRATEGY ALPHA
April 30, 2000 – September 30, 2019 • Percent (%) • USD Terms
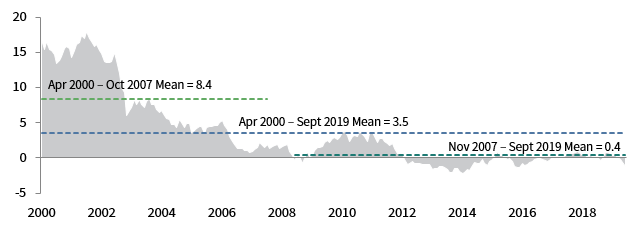
Sources: Bloomberg, L.P., Barclays Strategic Consulting, Hedge Fund Research, Inc., and MSCI Inc. MSCI data provided “as is” without any
express or implied warranties.
Several key developments over the past two decades have depressed equity L/S strategy alpha production: unconventional monetary policies post-GFC; the commoditization of fundamental research under US Regulation Fair Disclosure; the rising popularity of “passive” investment products; the growing clout of quantitative investors and multi-manager hedge fund platforms; and the dramatic growth in private capital markets. This “new normal” market structure has resulted in increased competition for alpha, greater position crowding, and a costlier operating environment. In addition, bouts of severe deleveraging—such as in fourth quarter 2018—have been occurring more frequently. A prolonged bull market whose strong gains have been highly concentrated in a handful of mega-cap technology stocks has only added to the challenges facing fundamental equity investors, particularly those with a value bias.
Going forward, fundamental equity L/S managers that keep themselves well informed about the changing market and industry dynamics and apply these lessons to their investment process can successfully navigate the ongoing headwinds they are likely to face. To avoid being whipsawed by future deleveraging episodes, equity L/S strategies must also incorporate enhanced risk management processes and limit their use of leverage. Managers with a longer-term investment horizon, a higher-quality capital base, and more restrictive fund liquidity terms should be particularly well positioned. In 2020 and beyond, hedge fund allocators should consider eschewing traditional equity L/S generalists in favor of niche strategies, including hybrid public/private equity funds, single sector specialists, special situations, and activism, while supplementing such investments with lower-cost alternatives like equity options writing (selling).
 |
Secondaries No Longer Relegated to the Kids’ Table
Sean McLaughlin, Head of Capital Markets Research |
Some experienced investors have long used secondary transactions to shape their private investment portfolios, but in 2020, these deals could become mainstream. Ten years ago, high-profile institutions with liquidity challenges made headlines by tapping these markets, but for all of 2009, Greenhill & Company toted up only $10 billion of secondaries. Today’s market is roughly nine times larger (private equity assets only doubled during the trailing ten years), and secondary funds have $169 billion in estimated buying power.
PRIVATE EQUITY SECONDARIES DEAL VOLUME AND DEAL DISCOUNT
January 1, 2002 – June 30, 2019
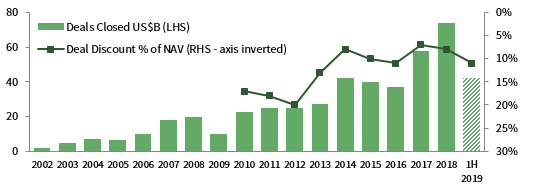
Sources: Cambridge Associates LLC and Greenhill & Co.
Secondary funds are an excellent alternative to funds-of-funds, with a more front-loaded return profile. But funds are not the only way for LPs to benefit from secondary purchases. Direct secondaries, which are plentiful in today’s market, offer LPs flexibility and fee savings, but turnaround times are tight. Last year, Cambridge Associates saw $8.0 billion (338 deals) in direct secondaries opportunities. We performed an initial review on 70% of them and closely evaluated several of the most attractive deals for clients. By the end of this year, we will have helped our clients purchase nearly half a billion dollars of LP interests since building a dedicated secondaries team in 2016.
While adverse selection is a risk, careful underwriting and transaction discounts can boost returns. Our database tracks 122 secondary funds raised between 2007 and 2016: Their median net IRR of 14.7% tops the 13.0% median IRR of comparable buyout and venture funds. With secondaries fund returns like that, why bother going direct?
- Visibility into underlying funds or assets, limiting blind-pool risk.
- Ability to dynamically shape exposure to geographies, vintage years, and strategies.
- Potential to integrate any ESG goals by allowing LPs to select individual LP interests.
Key risks for 2020? Transaction prices are high on average, at 89% of NAV during the first half of 2019. Given full values, leverage is commonplace across secondary funds. One-third of deals are now GP led, according to Greenhill. These deals may have a poor reputation, but now some high-quality GPs are using them to preserve valuable assets when funds wind down.
 |
Real Assets Categories Merge, Creating New Opportunities
Meagan Nichols, Global Head of Real Assets |
Secular trends have created a particular opportunity for investors to identify and commit to niche funds that blend elements of traditional real asset strategies in 2020. Manager selection will remain critical, since these complex assets require operational expertise that cuts across traditional boundaries.
Real asset strategies were traditionally divided into separate categories. Infrastructure included airports, roads, ports, and other physical assets necessary to facilitate the movement of natural resources, manufactured products, and people to support economic and social development. Real estate traditionally has been synonymous with office, industrial, retail, multi-family, and hotels. Natural resources investments focused on commodities, oil rigs, timber, and farmland assets. Today, the lines are blurring as opportunities arise in non-traditional or niche assets, such as student housing, data centers, renewables, and healthcare real estate.
Four key secular trends are driving increased investment in these niche real assets strategies.
Urbanization: According to the United Nations, more than 65% of the world’s population is expected to live in urban areas by 2050, up from 55% today. This continued migration to cities increases pressure on antiquated and inadequate urban infrastructure at a time when people are changing the way they work and live. While traditional infrastructure and real estate, such as transportation assets and office properties, will need to be updated to keep pace, urbanization also creates strong demand for affordable and/or social housing, student accommodations, alternative energy sources, and a myriad of other physical assets that cut across the traditional spectrum of real assets.
Technological innovation: New technology is influencing the way people shop, creating a need for well-located modern industrial and logistics assets. It is also rendering current data and fiber infrastructure irrelevant, creating opportunities for infrastructure and real estate GPs in areas like cell towers and data centers.
Demographics: Demand is growing for less cyclically driven real estate and infrastructure, as an aging population requires more senior housing and a rising middle class demands more student housing. Meanwhile, both real estate and infrastructure managers are exploring opportunities created by the growing need for affordable and social housing.
Energy revolution: As the shift from traditional energy sources to renewables becomes more prominent, we are seeing an increase in PE energy firms raising infrastructure-like vehicles to invest in renewables and traditional infrastructure firms expanding into energy-related investments.
As more investors gravitate toward these attractive niche sectors, competition is increasing and could potentially put some downward pressure on returns in the future. However, in the near term, managers with a demonstrable edge should still deliver above-average returns and help investors meet their investment objectives.
 |
Investors Should Embrace Resilience in 2020
Liqian Ma, Head of Impact Investing Research |
Investors should invest in solutions to two key systemic risks—climate change and social inequality—to build portfolio resilience for the 2020s and beyond.
Extreme weather events and rising sea levels will negatively impact our infrastructure, real estate, business supply chains, agriculture production, and labor productivity. According to NOAA data, the frequency of billion-dollar disaster weather events in the US (CPI-adjusted) has already increased significantly, and the annual average over the past decade is 79% higher than the 1980–2018 annual average.* Investors should start building climate resilience now through prudent analysis of material physical and transition risks across asset classes. New analytical tools and resources enable investors to engage with managers and reposition portfolios’ exposure to climate risk. Importantly, investors should build exposure to climate mitigation and adaptation solutions, primarily via venture capital growth equity, and real asset opportunities.
Climate change disproportionately affects already vulnerable communities globally. This issue brings us to social inequality, which can impact the economy and thus portfolios through a variety of means. The wealthiest 1% now claim 20% of national income in the US, nearly double the share they held in 1980, while the bottom 50% earn only 13% of national income (down from 21% in 1980).
TOP 1% VS BOTTOM 50% NATIONAL INCOME SHARES IN US
1980–2016 • Percent (%)
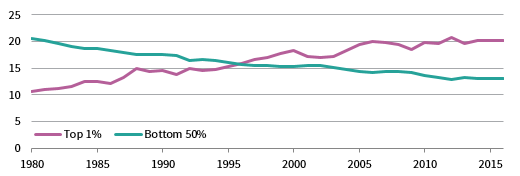
Source: World Inequality Report 2018. WID.world (2017). See wir2018.wid.world for data series and notes.
Notes: In 2016, 12% of national income was received by the top 1% in Western Europe, compared to 20% in the US. In 1980, 10%
of national income was received by the top 1% in Western Europe, compared to 11% in the US. The World Inequality Report data
show a higher magnitude of inequality compared to other sources such as Joint Committee on Taxation and the Congressional
Budget Office, but all sources show increasing inequality.
Trade and technology have brought disruptive change to growing segments of the labor market, but technology can also provide solutions. Technology can broaden access to healthcare and education while helping retrain workers to adapt to constantly evolving economic regimes. Minority communities and entrepreneurs are underserved, thus investors face little competition and can generate economic value. Social resilience is about leveraging human capital in the system, creating productive capacity, and building a more inclusive economy. Opportunities include private investments in education and workforce development, affordable housing, and financial inclusion.
Climate, social, and portfolio resilience are inexorably interconnected. Investors looking to 2020 and beyond should therefore embrace a holistic approach to resilience now.
 |
Conclusion
Celia Dallas, Chief Investment Strategist |
Looking back at our advice for 2019, we are struck by how little it has changed for 2020: Remain roughly neutral on risk assets, while also developing a strategy for managing through a recession-related bear market. Then, as now, the key question for investors is whether the economic expansion is coming to a close or will settle into a slower, but still positive, rate of growth. We did not think a recession was in the cards for 2019, and we suspect the expansion may last through 2020, as well. Central banks around the globe have increased liquidity provisioning that should help extend the expansion. Nevertheless, investors should prepare for the next major equity market downturn, given that contracting trade and manufacturing have led to decelerating economic growth. Ongoing tense geopolitical conditions further heighten market risk.
While equity investors have earned 20% year-to-date, most of these gains occurred by April 30, as markets rebounded from the sharp declines of fourth quarter 2018. From September 30, 2018, through October 31, 2019, global equities have returned just 5%. Equity valuations remain close to last year’s levels, as equity appreciation has paced 4.7% global earnings growth. At the same time, ten-year G4 sovereign bond yields have fallen significantly, credit spreads have tightened, and lending standards have deteriorated.
Diversification remains central in 2020. Even with near-zero yields, sovereign bonds can prove useful in a market downturn, and we favor them over liquid credits. Within liquid credit, we prefer structured credit and trading-oriented distressed strategies that could capitalize on market volatility.
Investors should rebalance US equities and growth stocks, which have outperformed during this market expansion, to at least a neutral allocation. Should the expansion continue, the overvalued US dollar may soften amid relatively loose monetary policy conditions in the US, boosting non-US equities. Further, softening growth in China, Germany, and Japan have dragged down US growth. These countries are further ahead in the economic cycle than the US and may stabilize before it does, providing the catalyst needed for global ex US equities to outperform. Improved macro conditions would also support value stocks over growth stocks, where relative valuations have become extremely stretched. Select private investment strategies remain appealing. Secondary funds and direct transactions offer distinct advantages at this stage of the cycle, given their discounted pricing and more immediate return of capital.
Finally, as we enter 2020, investors should consider what trends may be most consequential over the next decade. Slower economic growth, deteriorating developed markets demographics, and low productivity growth lift the appeal of less economically sensitive investments often found in private credit opportunities. Investors should boost their portfolios’ resilience to climate change and social inequality challenges through private investments in areas such as climate change mitigation and adaptation solutions, education and workforce development, affordable housing, and financial inclusion. Private real assets also offer opportunities to benefit from secular trends, most notably urbanization, changing demographics, and technological innovation.
Yen Yen Ooi, Graham Landrith, and Kristin Roesch also contributed to this publication.
Methodology Notes
US Value vs Growth: Relative Cumulative Wealth and Valuation
Data are monthly. Relative returns reflect the cumulative difference in monthly returns between the value-weighted “Hi30” book-to-market portfolio (Value) and the value-weighted “Lo30” book-to-market portfolio (Growth). “Hi30” and “Lo30” are defined as the top 30% and bottom 30%, respectively, of stocks rank-ordered by book-to-market multiple. Portfolios include both large- and small-cap shares. Relative valuations reflect the ratio of the median market-to-book multiple of the Value portfolio to that of the Growth portfolio. Relative valuation data are through May 31, 2019.
Equity Long/Short Alpha
Monthly equity long/short alpha is calculated as HFRI Equity Hedge (Total) Index – [3-month LIBOR + 36-month rolling beta to MSCI World * (MSCI World – 3-month LIBOR)]. Hedge Fund Research data are preliminary for the preceeding five months. MSCI World Index returns are total returns net of dividend taxes.
Index Disclosures
MSCI World Index
The MSCI World Index represents a free float–adjusted, market capitalization–weighted index that is designed to measure the equity market performance of developed markets. As of September 2019, it includes 23 developed markets country indexes: Australia, Austria, Belgium, Canada, Denmark, Finland, France, Germany, Hong Kong, Ireland, Israel, Italy, Japan, the Netherlands, New Zealand, Norway, Portugal, Singapore, Spain, Sweden, Switzerland, the United Kingdom, and the United States.
HFRI Equity (Hedge) Total Index
The HFRI Equity Hedge Index includes distressed/restructuring strategies that employ an investment process focused on corporate fixed income instruments, primarily on corporate credit instruments of companies trading at significant discounts to their value at issuance or obliged (par value) at maturity as a result of either formal bankruptcy proceeding or financial market perception of near-term proceedings. Managers are typically actively involved with the management of these companies, frequently involved on creditors’ committees in negotiating the exchange of securities for alternative obligations, either swaps of debt, equity, or hybrid securities. Managers employ fundamental credit processes focused on valuation and asset coverage of securities of distressed firms; in most cases, portfolio exposures are concentrated in instruments that are publicly traded, in some cases, actively and in others under reduced liquidity, but in general for which a reasonable public market exists. In contrast to special situations, distressed strategies employ primarily debt (greater than 60%) but also may maintain related equity exposure.
About Cambridge Associates
Cambridge Associates is a global investment firm with 50+ years of institutional investing experience. The firm aims to help pension plans, endowments & foundations, healthcare systems, and private clients achieve their investment goals and maximize their impact on the world. Cambridge Associates delivers a range of services, including outsourced CIO, non-discretionary portfolio management, staff extension and alternative asset class mandates. Contact us today.