EM Equity Performance Reflects Initial Tariff Risks


Emerging markets (EM) economies were among the hardest hit as part of US President Donald Trump’s sweeping reciprocal tariff announcement. This was because EM countries tend to run trade surpluses with the United States and the administration’s tariff methodology ostensibly focused on bilateral trade deficits. While trade negotiations may ultimately result in a less draconian outcome for EM countries, there is a high degree of uncertainty in the market today. Broadly speaking, recent EM equity market performance has largely reflected this initial tariff risk. EM stocks have lagged their developed (DM) ex US counterparts this year, while Asian equities have underperformed their Latin America and Europe, the Middle East, and Africa (EMEA) peers within the EM bloc.
Overall, we think investors should hold EM allocations in line with policy targets. But periods of volatility and equity market dislocations often present opportunities for investors to add value through tactical portfolio tilts. Although EM equity performance has lagged since the Global Financial Crisis, we see growing evidence that EM equities may soon offer an attractive opportunity. This thesis is predicated on further US dollar weakness, a reset in EM valuations and earnings growth expectations (which appear elevated today), and signs of a rebound in economic activity. Below, we outline a framework to help inform when a tactical overweight position toward EM stocks may become appropriate.
Countries in the EM Asia region appear most at risk from the US tariff proposal. Announced reciprocal tariff rates were generally north of 20%, given the region’s large trade surpluses with the United States. Figure 1 plots exports to the United States as a percentage of GDP for each MSCI EM Index country versus the announced reciprocal tariff rate. This illustrates where the tariff imposition could be most impactful from a direct trade point of view, barring any second-order effects. China is excluded for scale purposes, as the US tariff rate on Chinese imports has increased to 145% in a tit-for-tat escalation. While the US administration’s broader tariff policy appears to have become increasingly targeted against China, recent commentary from US officials and President Trump suggests this tariff rate is likely to be lowered.
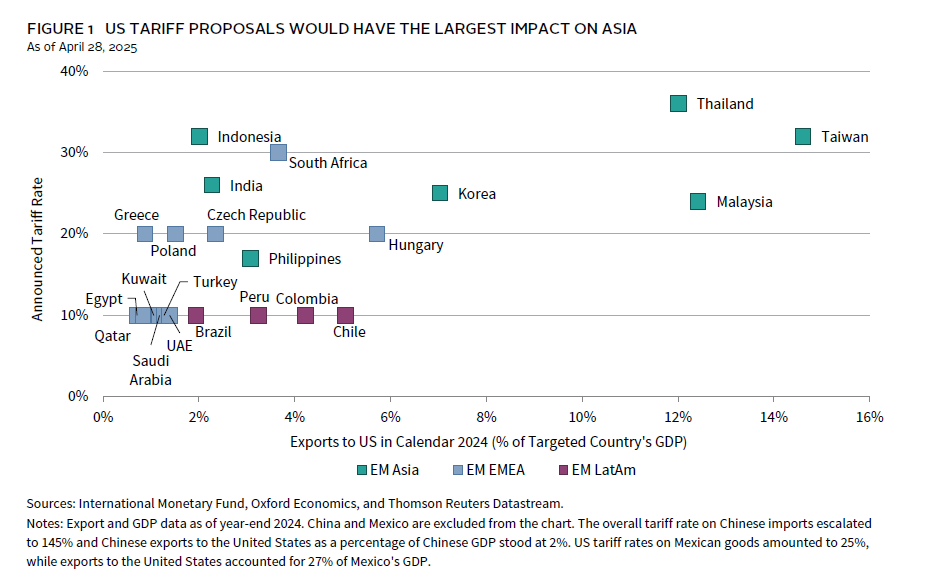
Malaysia, Taiwan, and Thailand appear particularly at risk as exports to the United States account for a hefty portion of their respective economic output. The upshot is that we expect the relatively smaller Southeast Asian countries are likely to negotiate more benign outcomes, given that trade barriers were relatively limited to begin with. India and Taiwan are also likely to negotiate down the tariff rate but may face a more challenging path forward and face specific sectoral-tariff risks. India has significant trade barriers in place and has a large pharmaceutical sector that may face levies. Meanwhile, Taiwan’s dominance in semiconductor manufacturing (to which the United States has become increasingly hawkish) and reliance on the United States from both an export and security perspective could leave them in a weaker negotiating position. Valuations for both these countries remain elevated, leaving equity market performance at risk if subsequent policy updates disappoint expectations. Broadly speaking, we believe Asia will bear the brunt of tariff and growth uncertainty even after finalizing deals to lower tariff rates, given their relatively larger economic exposures to the United States.
Outside of Mexico, Latin American countries received the 10% baseline universal tariff rate as these economies generally run trade deficits or small surpluses with the United States. Mexico was also excluded from Figure 1, as exports to the United States as a percentage of total economic output stood at nearly 30% as of year-end 2024. Although Mexico was spared from escalation with the reciprocal tariff announcement, earlier tariff actions should have an outsized adverse economic impact. Indeed, the International Monetary Fund recently lowered their 2025 GDP growth expectation for Mexico to -0.3%. Similar to broader Latin America, countries in the Middle East came in at the baseline tariff level. South Africa was a notable exception within the EMEA region; however, several key exports were exempted in the reciprocal round, including gold and other major metals and minerals.
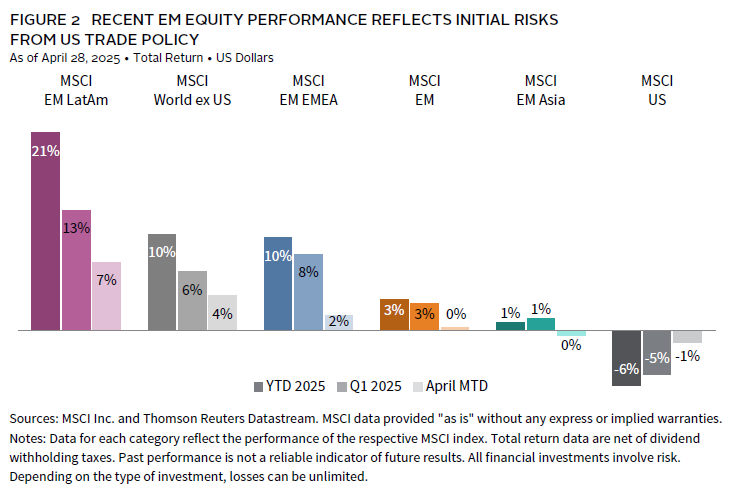
Equity market performance has largely reflected trade policy dynamics. Latin American and EMEA equities have returned 7.2% and 1.6%, respectively, month-to-date through April 28 in US dollar terms, compared to -0.5% for the EM Asia segment (Figure 2). Year-to-date, the former two EM regions have also enjoyed strong gains, outperforming both the broader EM index and DM counterparts. These trends have held true even when looking at performance data in local currency terms, which removes the impact of US dollar depreciation. In aggregate, the US dollar has depreciated the most versus other DM currencies, adding more than 8 percentage points to the DM ex US year-to-date return in US dollar terms, versus just more than 1% for the equivalent EM return.
Latin America and EMEA may be better positioned to weather the tariff storm. Latin America’s performance has rallied from a steep drawdown in 2024, when the region declined more than 26% in US dollar terms. But market technicals aside, the region is likely past peak tariff uncertainty with the threat fully priced in at today’s low valuation levels across the region. Further, demand for Latin American exports (e.g., Brazilian agriculture) may ultimately increase, given that the region’s trade relations with China have deepened in recent years. Similarly, EMEA performance reflects some catch up, as the region has lagged the broader EM index over the trailing three-year period. Year-to-date performance for the region has been driven largely by South Africa, Poland, and Greece, with the latter bolstered by an improving European growth outlook supported by prospects for higher fiscal spending. This tailwind is unlikely to fade, given the shifting geopolitical winds.
Perhaps counterintuitively, the recent economic and financial market shock has contributed to a building case for a tactical overweight to EM equities. US tariff policy has increased the likelihood that global economic growth will slow—with some countries potentially falling into a recession—representing a deflationary shock for the EM bloc. However, EM stocks tend to outperform DM peers during the early recovery stage of the business cycle and appear primed to do so again in the aftermath of a slowdown/recessionary scenario. This assertion is predicated on two key factors. First, EM authorities are likely to employ stimulative fiscal and monetary policies in the face of economic weakness. Second, prospects for further US dollar weakening have increased. The greenback’s depreciation has been a key driver of EM equity outperformance in prior cycles as it typically indicates easing financial conditions globally, capital flows favoring non-US markets, and better growth prospects outside the United States. These conditions tend to support EM equity outperformance.
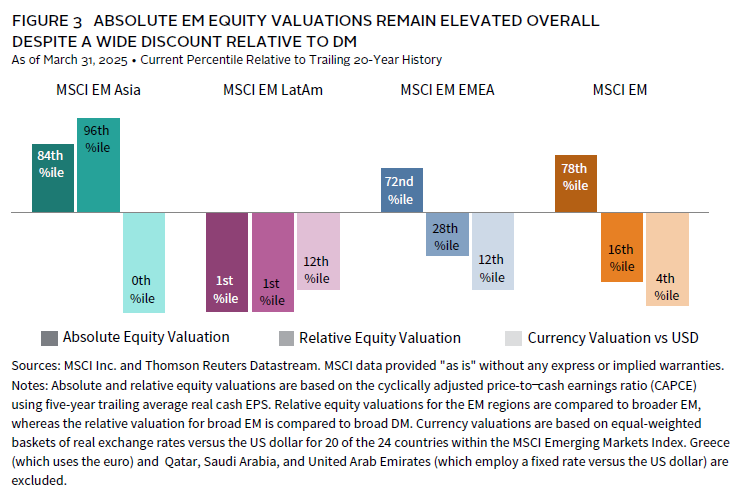
To be clear, we remain neutral on EM equities for now, as initiating an overweight stance today appears premature. EM equities are a cyclical asset class, and hard economic data are likely to soften in the coming months. EM earnings results tend to be closely tied to trade volume growth, where the latest consensus EPS growth expectation for 2025 (13%) appears at risk of downgrades. And although EM equity valuations are depressed relative to DM peers, they remain somewhat elevated in absolute terms, suggesting room for further downside if hard economic data do indeed soften in the months ahead (Figure 3).
Putting it all together, we are watching for several conditions to be met that would allow us to have greater confidence in an EM equity overweight. These include increased prospects for further US dollar weakness, a reset lower of absolute EM equity valuations and earnings growth expectations, and signs of a bottoming out in economic data.
Periods of market stress often present opportunities in riskier corners of the financial markets. EM equities are no exception. But with a sound framework and investment process, investors who lean into these areas at opportune times stand to reap the rewards. That said, given the volatility of EM stocks, any overweight recommendation vis-à-vis DM would be modestly sized.
Index Disclosures
MSCI Emerging Markets Index
The MSCI Emerging Markets Index captures large- and mid-cap representation across 24 emerging markets (EM) countries. With 1,206 constituents, the index covers approximately 85% of the free float–adjusted market capitalization in each country. Emerging markets countries include: Brazil, Chile, China, Colombia, the Czech Republic, Egypt, Greece, Hungary, India, Indonesia, Korea, Kuwait, Malaysia, Mexico, Peru, the Philippines, Poland, Qatar, Saudi Arabia, South Africa, Taiwan, Thailand, Turkey, and the United Arab Emirates.
MSCI Emerging Markets Asia Index
The MSCI Emerging Markets Asia Index captures large- and mid-cap representation across eight EM countries. With 976 constituents, the index covers approximately 85% of the free float–adjusted market capitalization in each country. EM Asia countries include: China, India, Indonesia, Korea, Malaysia, the Philippines, Taiwan, and Thailand.
MSCI Emerging Markets EMEA Index
The MSCI Emerging Markets EMEA Index captures large- and mid-cap representation across 11 EM countries in Europe, the Middle East, and Africa (EMEA). With 147 constituents, the index covers approximately 85% of the free float–adjusted market capitalization in each country. EM EMEA countries include: the Czech Republic, Egypt, Greece, Hungary, Kuwait, Poland, Qatar, Saudi Arabia, South Africa, Turkey, and the United Arab Emirates.
MSCI Emerging Markets Latin American Index
The MSCI EM Latin American Index captures large- and mid-cap representation across five EM countries in Latin America. With 83 constituents, the index covers approximately 85% of the free float–adjusted market capitalization in each country. EM Latin America countries include: Brazil, Chile, Colombia, Mexico, and Peru.
MSCI US Index
The MSCI US Index is designed to measure the performance of the large- and mid-cap segments of the US market. With 625 constituents, the index covers approximately 85% of the free float–adjusted market capitalization in the United States.
MSCI World ex US Index
The MSCI World ex US Index captures large- and mid-cap representation across 22 of 23 developed markets (DM) countries—excluding the United States. With 776 constituents, the index covers approximately 85% of the free float–adjusted market capitalization in each country. DM countries include: Australia, Austria, Belgium, Canada, Denmark, Finland, France, Germany, Hong Kong, Ireland, Israel, Italy, Japan, the Netherlands, New Zealand, Norway, Portugal, Singapore, Spain, Sweden, Switzerland, and the United Kingdom.
Stuart Brown, CFA - Stuart Brown is a Senior Investment Director for the Capital Markets Research team at Cambridge Associates.
About Cambridge Associates
Cambridge Associates is a global investment firm with 50+ years of institutional investing experience. The firm aims to help pension plans, endowments & foundations, healthcare systems, and private clients achieve their investment goals and maximize their impact on the world. Cambridge Associates delivers a range of services, including outsourced CIO, non-discretionary portfolio management, staff extension and alternative asset class mandates. Contact us today.