Private Investing for Private Investors: Life Can Be Better After 40(%)


In recent years, families of substantial wealth and family offices have paid increasing attention to the role of private investments in portfolio construction and with sound reason. Private investments, 1 particularly private equity (PE) and venture capital (VC), have provided the strongest relative returns for decades, and top-performing institutions have been long-time allocators to private investment strategies, reaping the benefits of the outperformance. What can families, particularly those concerned with multigenerational wealth dynamics, learn from these institutional investors?
Cambridge Associates’ past analysis indicates that endowments and foundations in the top quartile of performance had one thing in common: a minimum allocation of 15% to private investments. Our data also show that top decile performers have steadily increased their allocations over the past two decades, pushing well beyond this 15% frontier to allocations, in many cases, north of 40%. These investors are comfortable with the long time horizon, illiquidity, and complexity inherent in higher private investment allocations. Moreover, they understand it takes time and skill to build a robust private investment program, but recognize that the potential rewards for this extra effort have been compelling.
Families with multigenerational wealth may be particularly well positioned to consider allocating 40% or more of their assets to private investments. Assuming these families have the requisite long-term time horizon, patience, and ability to act quickly, they stand to benefit not only from the potential for higher returns but also from the tax-advantaged nature of private investments. Life could get better after 40%!
The 40% Club: Membership has its benefits
Investors may want to consider an allocation of greater than 15% to private investments as a prudent investment strategy based on the characteristics of private investments and our analysis of extensive data. Figure 1 highlights the meaningful returns that institutions with higher allocations to private investments have achieved over the last 20 years. The median annualized return for a greater than 15% average allocation was 8.1%, 160 basis points higher than the group with a less than 5% allocation. This chart also shows that the higher the allocation the better and, as seen in Figure 2, top decile performers have steadily increased their allocations over the years to a mean of 40%. 2
FIGURE 1 INSTITUTIONAL INVESTORS WITH HIGH PRIVATE ALLOCATIONS ALSO EARNED THE HIGHEST RETURNS OVER 20 YEARS
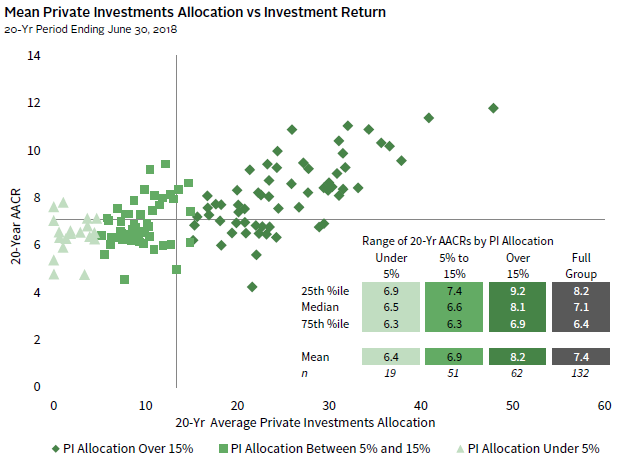
Source: Endowment and foundation data as reported to Cambridge Associates LLC.
Notes: Analysis includes 132 endowments and foundations that provided returns and beginning year asset allocation for each June 30 from 1998 to 2018. Subgroups are based on each institution’s 20-year average allocation to private investments. Solid lines are drawn where the median private investments allocation for the entire universe intersects with the median return for the entire universe.
FIGURE 2 TOP PERFORMERS STEADILY INCREASED PI ALLOCATIONS OVER TIME
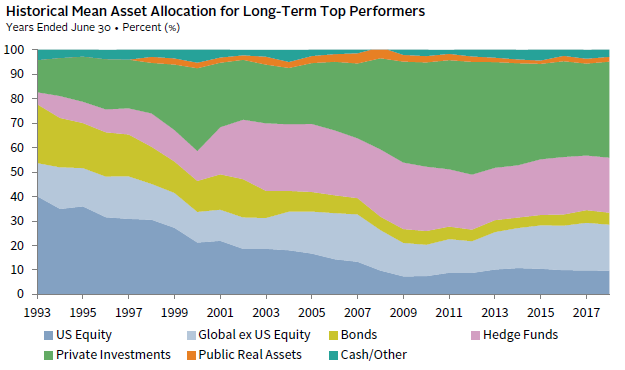
Note: Long-term top performers represent the institutions that were in the top decile for the 25-year AACR as of June 30, 2018.
Figure 3 compares the returns of the top-decile performers to those of other endowments and foundations. It illustrates that, as a result of this increased allocation, these top decile performers—“the 40% Club”—have captured significantly greater return over 10-, 15-, and 20-year time periods relative to their peer universe.
FIGURE 3 LONG-TERM TOP PERFORMERS CAPTURED GREATER RETURNS RELATIVE TO PEERS
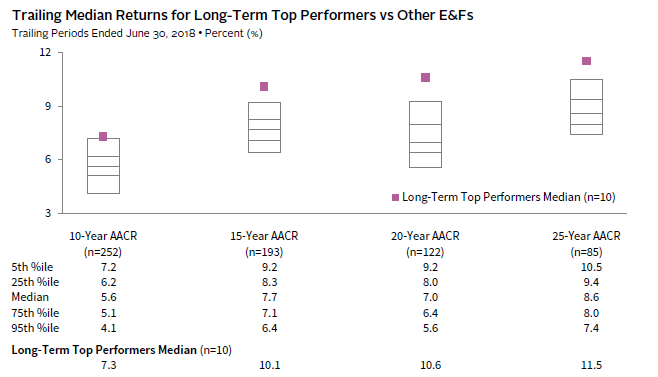
Notes: Long-term top performers represent the institutions that were in the top decile for the 25-year AACR as of June 30, 2018. The distribution of returns in the graph represents data for the All Endowment and Foundation universe excluding the long-term top performers. Each bar represents a range of percentile returns in the following order: 5th percentile (top), 25th percentile, median, 75th percentile, and 95th percentile (bottom).
Better alignment drives return potential
The greater return potential of private investing comes from a variety of factors, including GP/LP (general partner/limited partner) alignment, fund manager skill, and investment focus. A strong alignment of interests among GPs, LPs, and company management is critical to success. GPs bring a “buy to sell” mentality to investments they make, which requires confidence before committing capital that the skill and expertise they bring to the table will result in meaningful returns at exit.
With the right set of skills, experience, and focus, GPs can capitalize on some of the information asymmetries that exist in private markets. GPs with industry knowledge and experience have strategic and operational insights that can help improve company returns. Furthermore, the contacts and networks developed around a particular sector focus provide a GP with reliable trend information, deal flow, and potential talent. Unlike publicly traded companies, which tend to manage to a quarterly earnings report with public investors, private companies are more likely to adhere to a multi-year strategy.
Risks are manageable when properly defined
Risk can be defined in different ways. Two often cited risks with private investments are illiquidity and permanent capital loss, the latter of which is particularly relevant to VC investing. By definition, the lock-up nature of a private investment makes the investment illiquid. Typical holding periods are seven to ten years; however, the full realization of a private investment may be longer. While interests can be sold in a secondary offering, these transactions are complex and the potential buyer universe is often limited. As a result, pricing may be at a discount to actual economic intrinsic value of the interest.
But illiquidity does not translate into greater risk, unless liquidity needs have been miscalculated. In fact, as Figure 4 shows, institutions with higher allocations to private investments fared better in most major market downturns. Unfortunately, many investors overestimate their true liquidity needs and, as a result, miss out on significant return potential.
FIGURE 4 INSTITUTIONS WITH HIGH PRIVATE INVESTMENT ALLOCATIONS HAVE FARED WELL IN MARKET DOWNTURNS
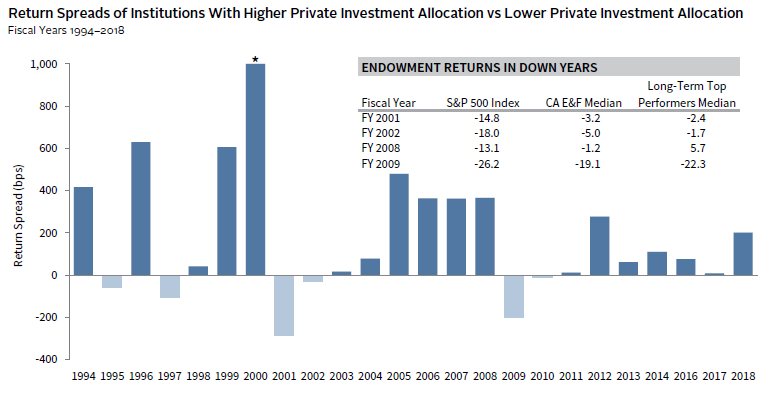
Source: Endowment and foundation data as reported to Cambridge Associates LLC. Notes: Institutions with private investment allocations greater than 15% in a given year were in the high-allocation group, while institutions with private investment allocations lower than 5% were in the low-allocation group. Fiscal years end June 30.
Private investments also help prevent a key risk—the behavioral tendency to buy or sell at the wrong time. The capital call process of private fund investments can provide a natural “average-in approach” to investing, as capital is called when fund managers make investments. Similarly, funds seek to sell portfolio investments when attractive exit points are available, providing a natural “sell strategy” discipline. During market downturns, well-positioned GPs should be able to make well-timed investments.
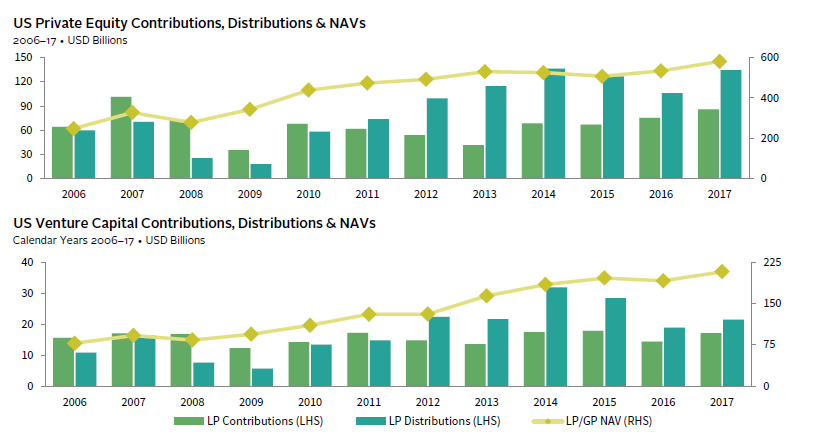
Figure 5 shows capital calls and distributions made for PE and VC funds over the past 30 years. Directionally, the cash flows are similar, with distributions far exceeding contributions, as one would expect. Interestingly, the difference in timing of PE and VC cash flows suggests that additional diversification benefits stem from the combination of investing in both. In recent years, top decile performers have allocated more evenly to PE and VC.
FIGURE 5 PRIVATE EQUITY & VENTURE CAPITAL DISTRIBUTIONS HAVE EXCEEDED CONTRIBUTIONS
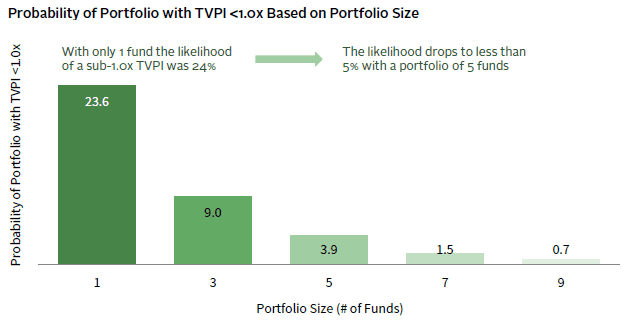
With proper diversification, the risk of permanent loss of capital is low. Figure 6 shows the risk of permanent capital loss was less than 1% when we randomly selected nine funds from a database of more than 3,000 funds. This random selection did not filter by any evaluation criteria, such as manager skill or performance, and the data spanned all sectors, geographies, and vintage years.
FIGURE 6 PROPER DIVERSIFICATION SUBSTANTIALLY REDUCES THE RISK OF PERMANENT CAPITAL LOSS
Today, as in the past, private investors need to monitor market factors, such as fundraising and valuations, to understand how these factors might impact performance. Timing the market, whether in public or private investments, is challenging at best, and with any investment, understanding return potential is critical. The opportunity set for private investments is diverse, offering a wide range of investment strategies that have potential to deliver attractive returns at different stages of the economic cycle.
Calculating true liquidity requirements is key
Liquidity calculations are critical and investors should determine their true liquidity needs as part of any investment strategy. Once assets are budgeted to meet these liquidity needs, the remaining assets can be considered for illiquid investments.
We often find that investors overstate their liquidity needs in absolute terms, but also overestimate the liquidity of certain asset classes. The global financial crisis demonstrated that many erstwhile “liquid” securities were anything but liquid. As stated previously, for many families with multigenerational wealth, the portion of the portfolio needed for liquidity may be much lower than their allocation to illiquid investments would suggest. Comparing cash and fixed income relative to spending needs, including projected capital calls, can serve as a basic starting point in determining if there is adequate coverage to enable a greater allocation to illiquid investments. The top-decile performers have figured out that, even with a mandatory 5% spending rate, a 40% allocation to private investments does not impinge on their liquidity needs. Furthermore, once a program is fully implemented, the distributions returned to investors tend to become more predictable.
Success depends on many factors
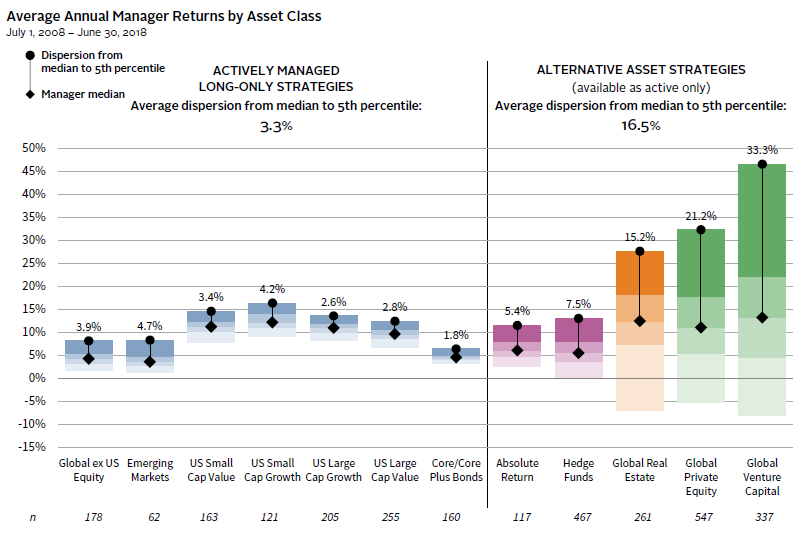
Private investments come in many shapes and sizes, and building a well-diversified portfolio across vintages, geographies, and sectors takes skill, time, and discipline. The wide return dispersion among private investment funds, as seen in Figure 7, highlights the complexity and importance of the manager selection process.
FIGURE 7 RETURN DISPERSION IN ALTERNATIVE ASSETS SHOWS THE IMPORTANCE OF MANAGER SELECTION
Direct investments, co-investments, and secondary purchases are attracting more interest from families, in part because they offer a lower cost method of accessing private investments, as well as allowing for immediate capital deployment. For many families, heritage as business owners also makes direct investing (versus fund investing) appealing. While these direct investments can offer significant return potential in their own right, the complexity, risk, and resources required to evaluate these opportunities is even greater than is the case for fund selection. Finding the right manager skill and expertise, and applying a rigorous and proven process across many dimensions, are critical to both fund investing and direct investing.
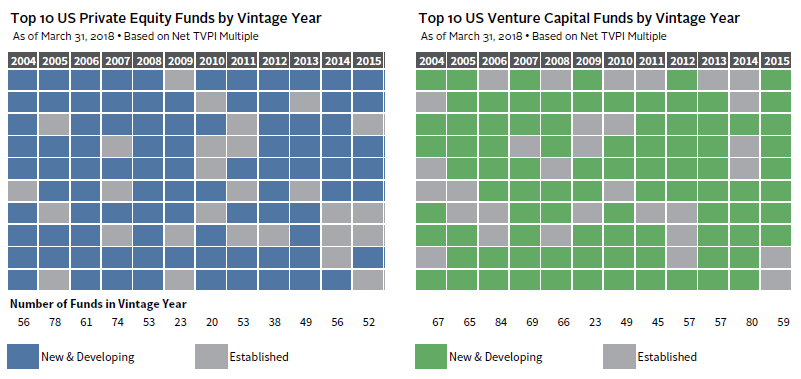
We’d all like to go back in time and place that bet on the winning horse! Likewise, with investments, it is easier to think about how an early investment in a particular fund or company would have benefited a portfolio than it is to gain comfort in a new opportunity. With private investments, many families assume there is less risk in the “famous” funds and lament the inability to gain access. However, new and developing funds actually are perennial top performers, as shown in Figure 8. Newer funds are usually led by experienced partners from established firms who have decided to break out on their own and are looking to raise much smaller amounts for their initial launch. The smaller size of these funds allows their managers to remain nimble and focused on attractive investments in their core area of expertise. The smaller size also often makes these investments more accessible to lower commitment levels and newer LPs. For investment opportunities with higher commitment levels, families could consider pooling assets to gain access.
FIGURE 8 NEW AND DEVELOPING FUNDS ARE CONSISTENTLY TOP PERFORMERS
Membership brings benefits for generations to come
For most institutions, investing with a long time horizon is imperative to sustaining their organization’s mission into perpetuity. With most endowments and foundations, a mandatory spending rate also requires a focus on finding the best long-term investments to achieve the needed returns. The top performers have come to appreciate that private investments can potentially offer more compelling returns than public market equivalents over long time horizons, and successful investors have maximized their allocations accordingly. These investors also appreciate that building a robust private investment program takes time, skill, and discipline.
Although families do not have a mandatory spending rate, they do have continuity concerns, as typically more people must be considered and supported in each subsequent generation. Families are also often hit by the tax impact of wealth transfers, despite extensive estate planning. Those willing to adopt a long-term outlook might be able to withstand more illiquidity and potentially achieve more attractive long-term returns. But it is not just the superior return potential that makes a conversation around allocating more to private investing important for families. Many private investments offer tax advantages both in the near term and as part of a wealth transfer strategy. For the most part, private investment returns are taxed as capital gains rather than as ordinary income. Given their illiquid nature, the value of private investments can also often be discounted for gift, estate, or inheritance tax purposes.
As taxable investors know, it is not what you make but what you keep that matters. Higher returns, compounded over time in a more tax-advantaged manner, are quite appealing. Pushing past the 15% frontier—and joining the 40% Club—is a conversation worth having for generations to come.
Disclosures
The Cambridge Associates Endowment and Foundation universe includes colleges and universities, cultural and environmental institutions, foundations, healthcare institutions, independent schools, and other endowment nonprofit institutions. The mean and median long-term investment portfolio market values for the 418 institutions in this universe as of June 30, 2018, were $1.8 billion and $355.2 million, respectively. For time periods greater than one year in this report, only institutions that provided data for all years in the given period are included. Data are presented as of June 30, 2018, as this is the most robust period for analysis given that the largest number of institutions report to our database for the June 30 period. Advisory clients of Cambridge Associates compose a significant portion of the universe, but the universe includes institutions for which Cambridge provides discretionary and nondiscretionary investment advice with respect to entire portfolios and discreet subdivisions of portfolios, as well as institutions for which Cambridge Associates provides performance analytics and other administrative services. The performance of the universe and its constituents is intended to illustrate the potential benefits of an allocation to private investments, and is not intended to represent, and is not representative of, any investment strategy offered by Cambridge Associates.
Cambridge Associates Indexes
Cambridge Associates derives its US private equity benchmark from the financial information contained in its proprietary database of private equity funds. As of June 30, 2018, the database comprised 1,481 US buyouts, private equity energy, growth equity, and mezzanine funds formed from 1986 to 2018, with a value of $767 billion. Ten years ago, as of June 30, 2018, the index included 876 funds whose value was $387 billion.
Cambridge Associates derives its US venture capital benchmark from the financial information contained in its proprietary database of venture capital funds. As of June 30, 2018, the database comprised 1,807 US venture capital funds formed from 1981 to 2018, with a value of $224 billion. Ten years ago, as of June 30, 2008, the index included 1,271 funds whose value was $94 billion.
The pooled returns represent the net end-to-end rates of return calculated on the aggregate of all cash flows and market values as reported to Cambridge Associates by the funds’ general partners in their quarterly and annual audited financial reports. These returns are net of management fees, expenses, and performance fees that take the form of a carried interest.
The CA Distressed Securities (Private) Index is a horizon calculation based on data compiled from 382 distressed securities funds, (including 218 Credit Opportunities and 164 Control-Oriented Distressed), including fully liquidated partnerships, formed between 1987 and 2018.
The CA Natural Resources Index is a horizon calculation based on data compiled from 423 natural resources funds, (including 93 Energy Upstream & Royalties, 210 US Private Equity Energy, 73 Ex US Private Equity Energy, and 47 Timber funds), including fully liquidated partnerships, formed between 1986 and 2018.
The Cambridge Associates Real Estate Index is a horizon calculation based on data compiled from 1,021 real estate funds, (including opportunistic and value-added real estate funds) including fully liquidated partnerships, formed between 1986 and 2018.
Footnotes
- Private investments include non-venture private equity, venture capital, distressed securities (private equity structure), private real estate, private oil & gas/natural resources, timber, and other private investments.
- The performance of the universe is not intended to represent, and is not representative of, any investment strategy offered by Cambridge Associates. Past performance is not indicative of future returns. The Cambridge Associates Endowment and Foundation universe includes colleges and universities, cultural and environmental institutions, foundations, healthcare institutions, independent schools, and other endowment nonprofit institutions. The mean and median long-term investment portfolio market values for the 418 institutions in this universe as of June 30, 2018, were $1.8 billion and $355.2 million, respectively. For time periods greater than one year in this report, only institutions that provided data for all years in the given period are included. Returns are gross of fees. Additional information regarding the universe is set forth at the end of this paper.
David Thurston - David Thurston is a Managing Director at Cambridge Associates.
About Cambridge Associates
Cambridge Associates is a global investment firm with 50+ years of institutional investing experience. The firm aims to help pension plans, endowments & foundations, healthcare systems, and private clients achieve their investment goals and maximize their impact on the world. Cambridge Associates delivers a range of services, including outsourced CIO, non-discretionary portfolio management, staff extension and alternative asset class mandates. Contact us today.