Portfolio Benchmarking: Best Practices for Private Investments

Benchmarking is a critical component of a successful investment program; however, measuring private investment performance vexes even the most sophisticated investors. The unique characteristics of these investments—the reporting lag, the long lock-up of capital, and the impact of the J curve, among others—make performance measurement and benchmarking difficult. Although investors think about the performance of their private investments differently, they tend to view this performance from two perspectives: (1) at the total portfolio level, including both liquid and illiquid investments, and (2) at the level of the private portfolio and its sub-components. 1
This paper addresses the second perspective, and follows two recent Cambridge Associates publications that address private investments in the context of total portfolio performance. When assessing performance at the aggregate private portfolio and sub-component level, investors should take the long view. Our research indicates that funds typically take 6–8 years to “settle” into their final quartile ranking and that the vast majority of funds have ranked in nearly all (or all!) quartiles at some point in their lives. In this publication, we review these findings and highlight our framework for benchmarking a portfolio of private investments.
The Long Road to Fund Maturity
Please see “Policy Benchmarking: A Guide to Best Practices,” Cambridge Associates Research Report, 2017 and “Policy Benchmarking: Best Practices for Private Investments,” Cambridge Associates Research Report, 2018.
The analysis in this paper updates analysis originally performed for “A Framework for Benchmarking Private Investments,” Cambridge Associates Research Report, 2014. This updated analysis is based on a dataset of 2,606 private funds raised between 1995 and 2005, using data published for the June 30, 2017, performance quarter with an as of date of December 31, 2016. In Figure 3, the top and bottom 5% of each asset class are considered outliers and were excluded from the analysis.
Many investors perform quantitative benchmarking analysis, which demands a significant amount of attention, on a fund or collections of funds that we would consider far too young to merit such scrutiny. Based on our analysis a fund typically requires 6–8 years to settle into its ultimate quartile ranking. Although there is widespread understanding of the concept of the J curve and the long-term nature of private investments, many investors are surprised when we share these findings.
Whether looking at internal rate of return (IRR) or total value to paid-in capital (TVPI) we observe differences across private investment strategies (Figure 1). While private equity, private credit, private real estate, and private natural resources funds settle within 6–8 years on average, earlier-stage venture strategies and more complex fund structures like fund of funds typically require 7–9 years before they can be considered mature. Secondary funds, which invest in fund interests that are more mature, have (unsurprisingly) the shortest time to settle at 5–7 years.
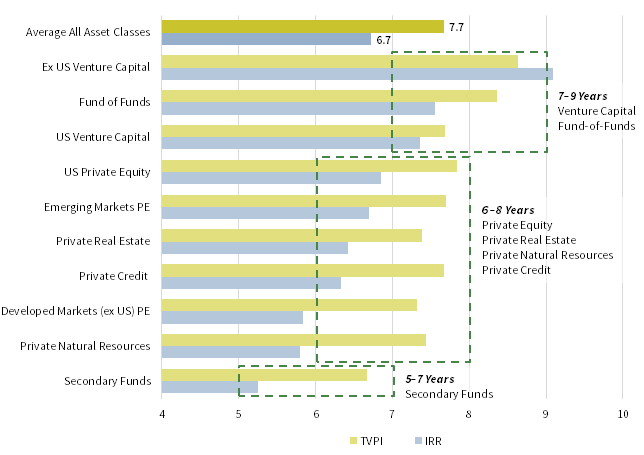
FIGURE 1 AVERAGE NUMBER OF YEARS TO SETTLE INTO ULTIMATE QUARTILE RANKING BY STRATEGY
Source: Cambridge Associates LLC.
Our research also indicates that private investment funds take longer to settle when measured by TVPI than by IRR (Figure 2). In addition, when looking across different strategies, the range of outcomes for TVPI (7–9 years) is less dispersed than for IRR (5–9 years). This difference makes sense because the IRR calculation, unlike TVPI, is sensitive to the timing of cash flows so the wider range of IRR outcomes is driven by differences in duration and patterns of cash flows across strategies.
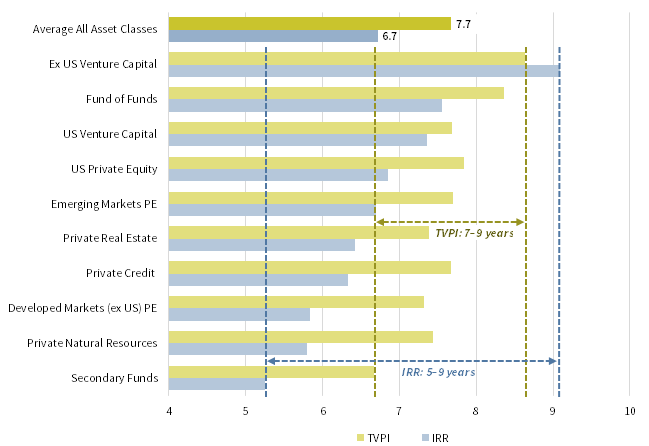
FIGURE 2 AVERAGE NUMBER OF YEARS TO SETTLE INTO ULTIMATE QUARTILE RANKING: TVPI VS IRR
Source: Cambridge Associates LLC.
Finally, the length of time a private investment fund takes to settle has not been consistent over time (Figure 3). 2 For example, venture capital strategies have seen large swings in the number of years to reach maturity, ranging from four years for funds raised in the booming dot-com years of the mid-1990s to 10–12 years for funds raised in the early 2000s after the bust. Private equity strategies see some variation, but have tended to settle in a narrower range than venture strategies. US private equity funds seem to demonstrate the least variance, consistently settling near eight years. Figure 3 highlights the relatively long time frame required for fund-of-funds to settle vis-à-vis other strategies.
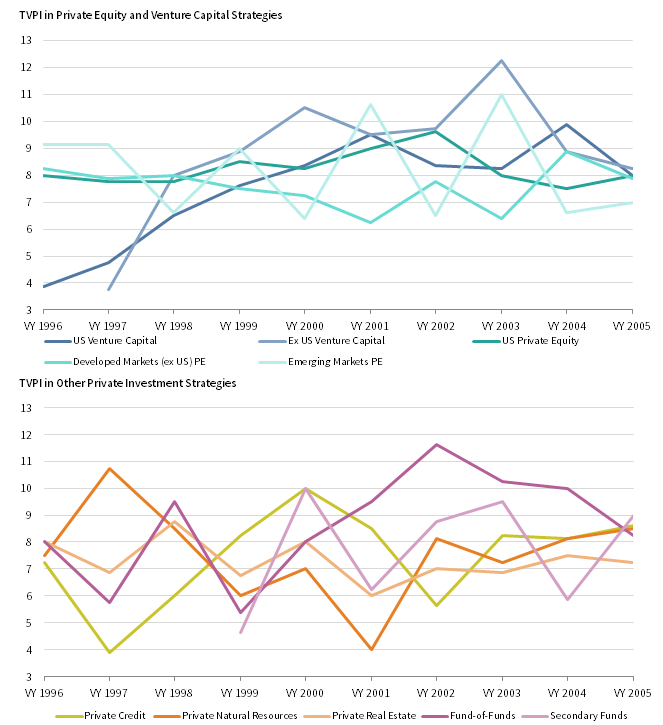
FIGURE 3 MEDIAN NUMBER OF YEARS TO SETTLE INTO ULTIMATE QUARTILE RANKING
Source: Cambridge Associates LLC.
The Winding Road to Fund Maturity
Given the long time to settle, investors understandably wonder if they might gain some insight into a fund’s final quartile ranking at an earlier point in time. Unfortunately our analysis suggests that the vast majority of funds go on quite a circuitous journey, making it very difficult to predict or narrow down the ultimate outcome. In fact, 85% of all funds as measured by IRR (or 87% as measured by TVPI) ranked in three or four different quartiles at some point on their journey to maturity. Furthermore, roughly half of all funds in our sample were ranked in each of the four performance quartiles before settling (Figure 4).
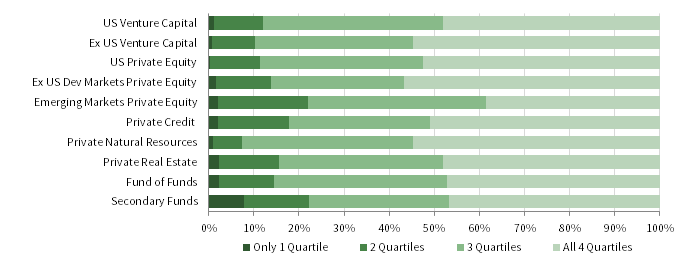
FIGURE 4 NUMBER OF QUARTILE RANKINGS EXPERIENCED BEFORE SETTLING
TVPI by Strategy
Source: Cambridge Associates LLC.
Therefore, placing too much emphasis on performance early in a fund’s life cycle can lead to wasted time, incorrect conclusions, and poor selection of follow-on funds. Save for a big, obvious win or, conversely, a big, obvious loss, investors should pay little attention to comparative benchmarking until a fund or portfolio is seasoned. In practice this is a challenging reality for investors. What’s an investor to do?
Please see “A New Arrow in the Quiver: Investment-Level Benchmarks for Private Performance Measurement,” Cambridge Associates Research Note, 2017. Please also see our annual operating metrics reports: “Under the Microscope: Private vs Public Company Operating Metrics for US Companies,” “Private Company Operating Metrics: Global Analysis,” and “Private Property Trends: Analysis of Operating Metrics for US Real Estate Properties.”
Given the typical private fundraising cycle—raise a fund, invest a majority of the capital over the first 2–4 years, then begin raising a follow-on fund (before the investment period ends and the management fee drops)—manager re-up decisions usually come well before the previous fund has reached the seasoned stage. This reality reinforces our view that investors making these decisions should not place too much emphasis on performance. Instead, investors should focus on understanding a manager’s organization, investment strategy, alignment, and ability to execute. Before funds are sufficiently seasoned, investors should review investment-level metrics to uncover how a manager’s portfolio companies compare with the manager’s strategy and to assess if sources of value creation are consistent.
In addition to re-up decisions, investors typically review the performance of their private portfolios on a regular, often quarterly, basis. Given the long time for funds to settle and their winding journey through multiple performance quartiles in the meantime, how should investors handle developing funds and portfolios in their performance reporting and review process?
A Framework for Benchmarking Private Investments
We believe the appropriate benchmark for private portfolio performance monitoring depends on the question investors are asking. 3 We often hear the following questions: (1) did we select good private managers, (2) was the decision to allocate capital to private investments a good one, and (3) did we make good allocation decisions across strategies, sectors, geographies, and vintages? Answering these questions thoughtfully demands tailored approaches (Figure 5).
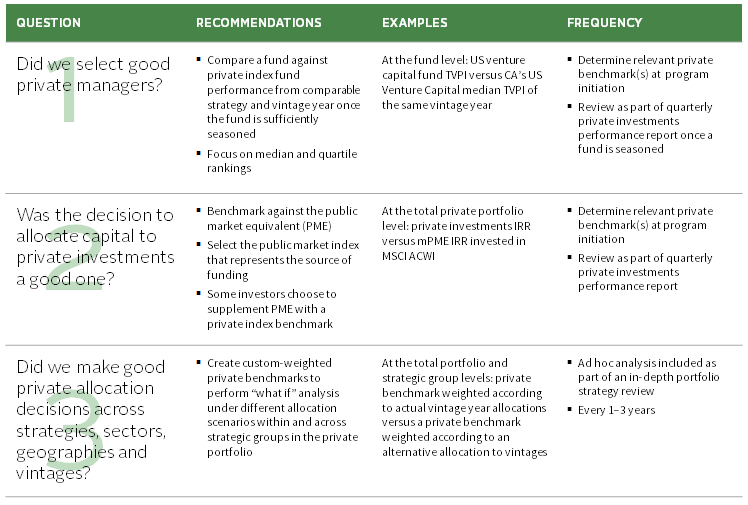
FIGURE 5 A FRAMEWORK FOR BENCHMARKING PRIVATE INVESTMENTS
Source: Cambridge Associates LLC.
Did we select good private managers? Of the three questions, this one is the most straightforward to answer. We recommend benchmarking individual funds against a since inception private index benchmark of the same strategy and vintage year. 4 Investors can clearly assess a fund’s returns against the benchmark’s quartile breakpoints and determine in which quartile the fund places. Of course, this information is relevant only once a fund is mature. We suggest a method for managing immature funds later in this note.
Was the decision to allocate capital to private investments a good one? The goal of the private investments allocation for most investors is to outperform public equities and, in many cases, to outperform them by a certain margin. We recommend investors analyze their portfolio’s returns using a public market equivalent (PME) to assess whether or not their private allocation has been “worth it” and whether or not they’ve achieved their goal. The public index chosen for the PME calculation should represent the source of funding for the private pool being measured. 5
Using a PME to assess the performance of a group of private funds or the entire private portfolio has several advantages. PME analysis allows investors to quantify whether or not they have outperformed public equities on an apples-to-apples basis using money-weighted returns for both the private portfolio and public index, thus answering the question of whether the private allocation has been successful in a very direct way. In addition, PME is a relatively straight-forward calculation and is transparent.
Finally, PME is a good metric to track when a private portfolio is immature because comparisons with standard private indexes, even if they are customized by vintage, are unlikely to be meaningful because the indexes themselves are not seasoned. Measuring private performance against a PME at any stage of maturity can provide a sense for whether the private portfolio is moving in the right direction to achieve the long-term goal. Though the ultimate goal—say, 300 basis points of outperformance—is not expected to be achieved or sustained over the short or medium term, the ability to assess when the private portfolio begins adding value is a useful tool.
Since 2013 when Cambridge Associates first introduced modified PME (mPME) the market has seen the debut of numerous PME calculations. Each calculation takes a different approach, each has its strengths and weaknesses, and each has its cheerleaders and detractors. Cambridge Associates offers clients of its online benchmarking analytics application three different options: mPME, Direct Alpha, and Kaplan & Schoar PME.
Some investors supplement PME analysis with a private index benchmark. For example, an investor could use the CA ex US Developed Buyout Index to assess their portfolio of buyout funds outside of the United States. When using a private index benchmark we strongly recommend custom-weighting the benchmark by strategy, geography, and vintage year to align the benchmark with the characteristics of the portfolio. Supplementing PME analysis with a private index benchmark is not necessary for all investors, but this approach does appeal to investors that desire an additional perspective on performance.
When reviewing the private investment portfolio in standard performance reports we recommend investors highlight “mature” versus “immature” funds differently. This approach helps emphasize that immature fund performance is not yet meaningful. Figure 6 is an example of a partial view of a private investments report that illustrates this treatment. 6 Funds that are not yet mature—in this case not yet six years old—are de-emphasized in the report. Funds that are very young, in this example the investor has set the threshold at funds not yet two years old, do not have any performance information presented.
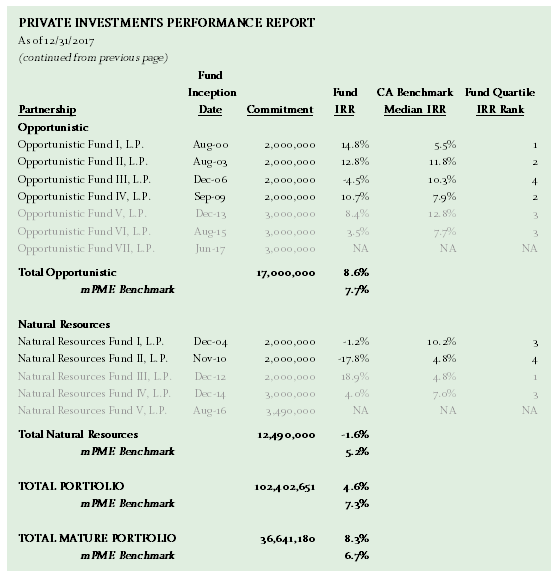
FIGURE 6 SEGREGATE THE PORTFOLIO INTO MATURE AND DEVELOPING FUNDS
Sample Performance Report
Did we make good private allocation decisions? Though some investors use private index benchmarks to measure aggregate relative performance despite the drawbacks, the use of such benchmarks is absolutely appropriate for conducting “what if” analyses during periodic strategic reviews of the private portfolio. These sorts of analyses can help investors understand if they made good allocation decisions across private strategies, geographies, sectors, and vintages. A typical example would be to compare an investor’s actual commitment pacing across vintage years to a more evenly paced allocation strategy, or to model actual strategy allocations (say, a venture allocation heavily weighted toward later-stage investments) with an alternative emphasis (say, a more balanced mix of early- and later-stage funds). It does not make sense to conduct such a review every quarter; instead, reviewing allocation decisions once every 1–3 years is usually sufficient.
The process for constructing an appropriate private index benchmark can be complex and is often dependent on its intended use and investor and portfolio specifics. For investors that desire to construct a private index benchmark, either to measure aggregate performance or assess allocation decisions, Figure 7 highlights some best practices to consider.
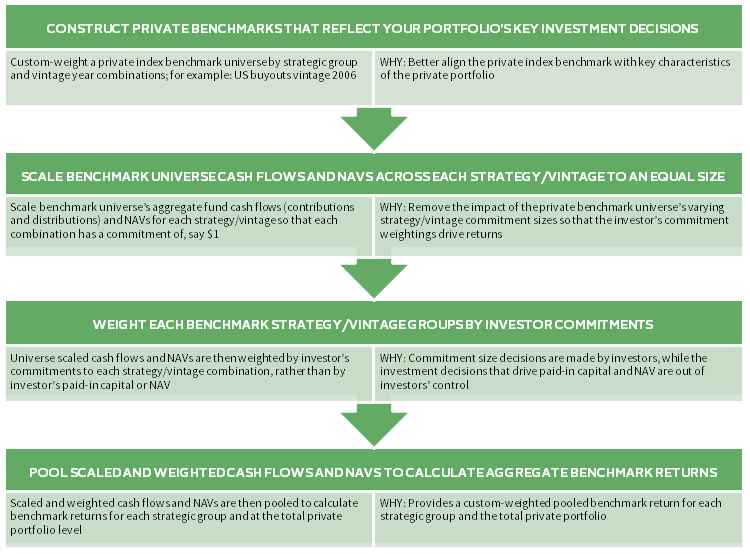
FIGURE 7 BEST PRACTICES FOR CONSTRUCTING A CUSTOM-WEIGHTED PRIVATE INDEX
Source: Cambridge Associates LLC.
Conclusion: Implementing Patience
When measuring private portfolio performance we recommend different approaches for addressing different questions. Focus on PME as a medium- and long-term measure to assess aggregate private portfolio performance and to integrate decision making across the private and public components of the portfolio. PME can be supplemented by custom-weighted private index benchmarks, but construction of an appropriate private benchmark is challenging. However, investors should recognize that the road to fully understanding private performance is a long and winding one. Although it is hard to resist focusing on the returns of portfolios and funds that are not yet seasoned, investors that can implement patience are likely to be rewarded.
Footnotes
- This paper is not intended to address private investments benchmarking for compensation purposes. Compensation design is inherently specific to the investor organization and its policies, portfolio, and the decision rights of the individuals being compensated.
- Figure 3 shows TVPI; however, the variability by strategy and across vintage years is similar when looking at IRR.
- Please see “A Framework for Benchmarking Private Investments.”
- To maintain vintage year alignment investors should ensure that they are using the same method to assign vintage years to funds in their portfolio as their benchmark provider uses. There are two commonly used vintage year definitions: first investor cash flow out and legal inception date of the fund.
- For more information on how to select a public index for a PME calculation or to represent the private allocation in a total portfolio policy benchmark, please see “Policy Benchmarking: Best Practices for Private Investments.”
- In this partial view of a comprehensive private investment report the two groups shown, “Opportunistic” and “Natural Resources,” are the last two groups shown on the report and they represent 29% of the total private portfolio’s commitments.
Jill Shaw - Jill Shaw is a Partner for the Endowment & Foundation Practice at Cambridge Associates.
About Cambridge Associates
Cambridge Associates is a global investment firm with 50+ years of institutional investing experience. The firm aims to help pension plans, endowments & foundations, healthcare systems, and private clients achieve their investment goals and maximize their impact on the world. Cambridge Associates delivers a range of services, including outsourced CIO, non-discretionary portfolio management, staff extension and alternative asset class mandates. Contact us today.