Global ex US PE/VC Benchmark Commentary: First Half 2021

In the first six months of 2021, according to Cambridge Associates indexes, private equity and venture capital in the developed markets outperformed those in emerging markets. The Cambridge Associates LLC Developed Markets ex US Private Equity and Venture Capital (PE/VC) Index returned 18.7% in the first half of 2021, in USD terms, with significantly better performance in the second quarter than in the first. Because returns are measured in US dollars, the currency’s strength in relation to the euro impacts performance of the developed markets index. The dollar strengthened in the first quarter and then weakened slightly in the second quarter, ending the first half up against the euro. As a result, the developed markets index’s six-month performance measured in euros is 22.5%, several percentage points higher than its US dollar comparison. The Cambridge Associates LLC Emerging Markets Private Equity and Venture Capital Index earned 14.8% for the period; it performed better in the first quarter than in the second. (Figure 1). The developed and emerging markets PE/VC indexes have handily outperformed their public market counterparts across time (based on modified public market equivalent [mPME] returns).
First Half 2021 Highlights
- Strong pandemic-era returns have helped the developed ex US and emerging markets PE/VC indexes to continue their sizable outperformance over comparable public equity indexes (MSCI EAFE and MSCI EM) across all time periods (Figure 1).
- Based on market values at June 30, 2021, public companies accounted for a larger percentage of the emerging markets PE/VC index (more than 20%) than of the developed markets PE/VC index (about 6%).

Developed ex US Markets Private Equity and Venture Capital Performance Insights
Vintage Years
In stark contrast to the first six months of 2020, when only two of six meaningfully sized vintages (those that represented at least 5% of the index’s value) had positive returns, during the first six months of 2021, six of seven meaningfully sized vintage years posted returns greater than 15%, with three (2013, 2016–17) returning greater than 20%. Performance for the key vintage years ranged from 8.8% for 2015 to 26.5% for 2017, with an overall average return of 18.9%; combined, these seven vintages accounted for 83% of the index (Figure 2). Write-ups and significant exposure to IT companies helped generate strong performance for the 2016 and 2017 vintage years, the strongest performing vintages of the group; write-ups in healthcare also helped drive returns for the 2017 vintage. The worst-performing meaningfully weighted vintage (2015) saw modest write-ups in industrials and IT, but these were offset by write-downs in consumer discretionary, the largest sector in the vintage.

Limited partner (LP) cash flows showed mixed changes from the previous six months. Distributions increased 23% from levels generated during the second half of 2020, while contributions dropped by 17%. Developed markets PE/VC funds returned $31.6 billion to investors during the first two quarters, the highest amount since the second half of 2017 and nearly double the amount distributed during the first half of 2020. Despite the slowdown in capital calls, LPs contributed $19.8 billion, a relatively active cycle compared to the long term. Distributions outpaced contributions in all but three six-month periods since the beginning of 2011; two of the exceptions occurred at the end of 2019 and the beginning of 2020, respectively.
Almost 80% ($15.4 billion) of the capital called during the first half of the year came from funds formed in 2017–19. Each called more than $3 billion, more than triple the next highest vintage, 2016, and almost four times as much as nearly every other vintage year. The largest concentration of contributions came from the 2018 vintage, at $7.6 billion. Distributions were spread across several vintages, with four (2012–14 and 2016) distributing more than $4 billion. The greatest amounts of distributions came from the 2012 and 2014 vintages, each of which returned more than $6 billion to LPs; combined, these two vintages accounted for over 40% of the total distributions during the period.
Sectors
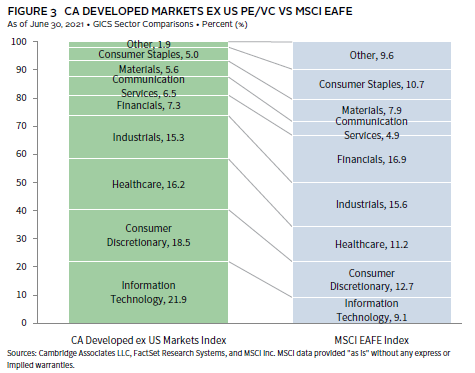
Figure 3 shows the GICS sector breakdown of the Developed Markets ex US Private Equity and Venture Capital Index and a public market counterpart, the MSCI EAFE Index. The chart illustrates differences in sector exposures, which helps explain performance for each index, especially since the pandemic’s impact varied significantly by industry, as did the subsequent recovery. Notably, the PE/VC index is overweight in consumer discretionary, healthcare, and IT, and underweight in financials, consumer staples, and smaller sectors in the “other” categories (energy, utilities, and real estate).
All seven of the meaningfully sized sectors earned positive returns in both USD and euros during the first two quarters (Figure 4). Performance ranged from 12.8% for consumer discretionary to 41.1% for IT in USD, with slightly stronger returns in euros. IT was driven by vintages 2011–17, all of which had significant IT exposure. Each had substantial write-ups during the period, particularly the 2016 vintage, which was the sector’s strongest driver. The lowest-performing sector, consumer discretionary, saw mixed results across vintages; write-ups in several vintage years, including 2013 and 2016, were offset by flat performance or write-downs in others.
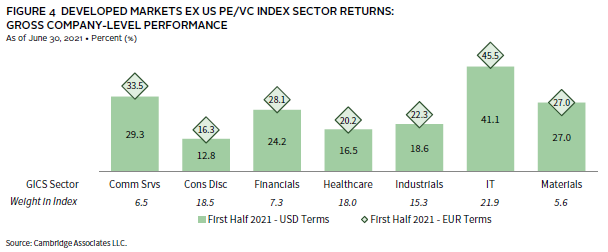
The four largest sectors—IT, consumer discretionary, healthcare, and industrials (in rank order)—represented 74% of the index’s value and returned 22.3% compared to 26.7% for the other three meaningfully weighted sectors on a pooled basis in USD terms. These same four sectors accounted for 69% of the capital invested during the first half of 2021, about 2% higher than their long-term average of 67%. Allocations to industrials companies were higher than long-term trends during the period, which accounts for much of the difference.
Countries
All of the seven meaningfully sized countries in the index earned double-digit returns during the first six months of 2021, in USD terms, ranging from 13.3% for Italy to 32.2% for Sweden (Figure 5). Two other countries, the United States and the United Kingdom, earned returns in excess of 30% during the period, at 30.3% and 31.1%, respectively. Combined, the seven largest countries accounted for 72% of the PE/VC index. Performance by vintage year was positive across the board for Swedish companies, but especially large write-ups for funds formed in 2012 and 2017 helped push the country to the top of the list. On the bottom, Italian companies saw broadly positive, but more modest, returns across recent vintages (2011 onward), with flat to slightly negative returns in vintages older than 2011. At the start of the year, IT accounted for 26% of the Swedish sample within the developed markets index and this concentration combined with strong IT returns helped to propel Sweden to the front of the pack during the period.
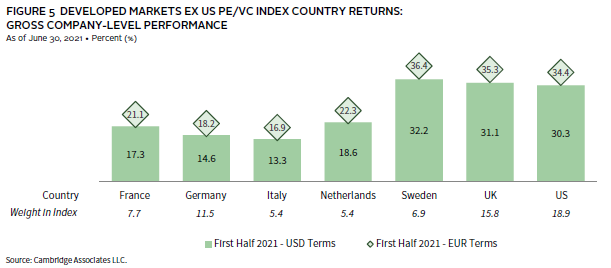
Companies in Sweden garnered about 3% of the capital invested during the first six months of the year, about 3% below its historical trend. Italian businesses attracted slightly more than 4% of the invested capital, which is 2% lower than its long-term allocation.
Emerging Markets Private Equity and Venture Capital Performance Insights
Vintage Years
Nine vintage years (2007, 2011–18) accounted for at least 5% of the emerging markets index’s value during the first half of 2021 for a combined total of 85% (Figure 6). In line with a strong six months for private markets, all sizable vintage years earned positive marks and only two fell short of double-digit returns (2007 and 2014). Performance for 2011 stood alone at almost 36%, while the other large vintages earned closer to the index’s total return of 14.9% for the period.
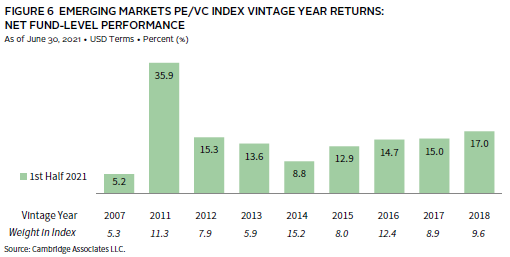
The unmatched success for the 2011 vintage can be attributed almost entirely to write-ups in IT, although the other meaningfully sized sectors also had positive returns. The inverse occurred for the worst-performing vintage, 2007; write-downs in IT as well as consumer companies drove down the return. At the close of first half 2021, the largest vintage year was 2014, representing just over 15% of the index. It posted the second-lowest return (8.8%) among the nine major vintages, suffering from weak performance in its largest sector (consumer discretionary), which was offset by otherwise strong marks. Notably, the 2018 vintage already represented almost 10% of the index, mostly due to its relatively large capitalization size and fast investment pace.
LP cash flows came close to or set new records during the first half of the year. Emerging markets PE/VC funds called $15.4 billion from and distributed $17.2 billion to investors, marking the third-largest and largest rolling six-month totals by dollar value, respectively, since the inception of the index. After an initial slowdown brought on by the onset of the COVID-19 pandemic, LP contributions have steadily increased since second quarter 2020. The pace of LP distributions has also been increasing in recent years, matching the trend across all private markets. Since 1986, distributions have outpaced contributions in approximately 19% of the rolling six-month periods, but they have outpaced contributions 58% of the time in the past eight years and all but once from 2020 onward.
Managers of funds raised in 2016–20 called most of the capital in the first half of 2021, totaling over $14.0 billion and about 92% of all capital called year-to-date. All five vintages called over $1.1 billion, and 2018 and 2020 each called over $4.1 billion. Distributions were much more widespread than contributions, although, notably, managers with funds ten years or older returned over half the capital for the period. In addition, funds in the 2014 vintage—the largest of those meaningfully sized—returned the most capital, almost $2.9 billion for first six months of the year.
Sectors
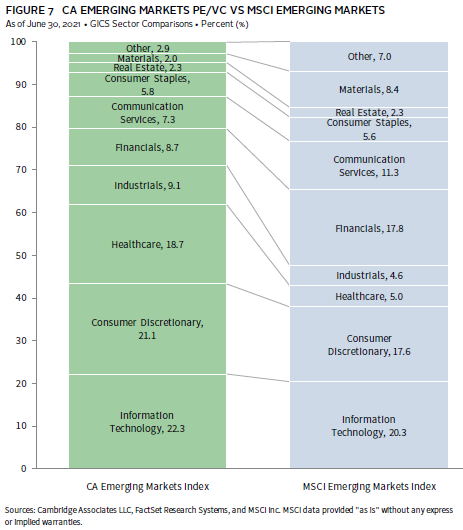
Figure 7 shows the GICS sector breakdown of the Emerging Markets PE/VC Index and a public market counterpart, the MSCI Emerging Markets Index. The chart highlights the significant overweights in the PE/VC index, such as healthcare, for which exposure is more than three times higher than in the public index. Notably, consumer discretionary and IT had considerable overweights in the private index but now only represent a few more percentage points of value than in the public market counterpart. PE/VC underweights are most significant in financials, followed by materials, and energy (which is now included in the “other” category).
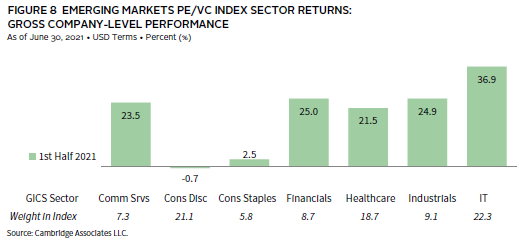
Returns in the first half of 2021 for the seven meaningfully sized sectors were clearly bifurcated; consumer (discretionary and staples) posted negative or low single digits while the rest earned over 20% (Figure 8). IT’s return was the best at 36.9%, followed by healthcare, communication services, industrials, and financials, whose performance ranged from 21.5% to 25.0% for the period. More than 56% of write-ups in IT companies were attributed to investments made by funds formed in 2011, while the other top-performing sectors were less concentrated by vintage year. Over a quarter of the write-ups in financials, however, were driven by funds formed in 2004, well beyond the average PI life cycle. Consumer staples, one of the weaker performing sectors, suffered from lower returns across most vintages, with about half experiencing write-offs. Conversely, the negative return for consumer discretionary was driven mostly from depreciation in investments made by funds formed in 2014. On a gross, dollar-weighted basis, the three largest sectors by market value—IT, consumer discretionary, and healthcare—returned 17.3% during the first half, matching the return for all companies. The sectors outside of the three largest returned 17.1% during the same period.
The investment pace decreased by roughly 15% in the first six months of 2021 when compared to the second half of 2020. Companies across four sectors (in rank order: healthcare, industrials, IT, and consumer discretionary) garnered 77% of the capital invested. Over the long term, managers in the emerging markets index have allocated 58% of their capital to these four sectors, with healthcare accounting for the biggest difference between the current six months (22%) and the long-term norm (13%). Notably, investment in financial companies was historically slow in the first six months, with companies attracting only 2% of the total invested capital, compared to the long-term norm of 10%. In fact, the financials sector experienced the lowest amount of invested capital in the first two quarters of 2021 than in any other rolling six-month period since 2009.
Countries
The Emerging Markets PE/VC index remains concentrated by region; at June 30, China accounted for almost half the value (Figure 9). South Korea, the United States, and India continued as the other constituents in the meaningfully sized group. 1 Four other countries—Australia, Hong Kong, Singapore, and Japan—represented between 2.1% and 4.8% of the index.
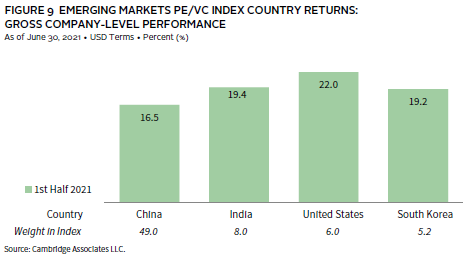
China-based companies received more capital (50%) than any other country despite ongoing geopolitical tensions and increased local regulation across many sectors. Two of the three other large countries, the United States and India, also attracted large amounts of capital year-to-date, roughly 9% and 5%, respectively. Perhaps surprisingly, Hong Kong garnered the third-highest amount (7%), more than double its 3% long-term norm. However, China marked the biggest increase in invested capital this period, a 16% jump over its historical average of 34%.
On a gross dollar-weighted basis, when combined, companies based in China, India, South Korea, and the United States returned 17.5%, beating out the full index by about 30 bps in the first half of 2021.
Figure Notes
Private equity includes only buyout and growth equity funds.
Global ex US Private Equity and Venture Capital Index Returns
The PE/VC indexes are pooled horizon internal rates of return and are based on limited partners’ fund-level performance; the returns are net of fees, expenses, and carried interest. Because the indexes are capitalization weighted, performance is mainly driven by the largest vintage years.
Public index returns are shown as both time-weighted returns (average annual compound returns) and dollar-weighted returns (modified public market equivalent). Returns are annualized, with the exception of returns less than one year, which are cumulative. The CA mPME replicates private investment performance under public market conditions. The public index’s shares are purchased and sold according to the private fund cash flow schedule, with distributions calculated in the same proportion as the private fund, and mPME net asset value is a function of mPME cash flows and public index returns.
Vintage Year Returns
Vintage year fund-level returns are net of fees, expenses, and carried interest.
Sector Returns
Industry-specific gross company-level returns are before fees, expenses, and carried interest.
Country Returns
Industry-specific gross company-level returns are before fees, expenses, and carried interest.
GICS Sector Comparisons
The Global Industry Classification Standard (GICS®) was developed by and is the exclusive property and a service mark of MSCI Inc. and S&P Global Market Intelligence LLC and is licensed for use by Cambridge Associates. Other includes sectors that make up less than 3% of the CA benchmark.
About the Cambridge Associates LLC Indexes
Cambridge Associates derives its Global ex US Developed Markets Private Equity and Venture Capital Index from the financial information contained in its proprietary database of global ex US private equity and venture capital funds. As of June 30, 2021, the database comprised 953 global ex US developed markets buyouts, growth equity, and venture capital funds formed from 1986 to 2021 with a value of about $484 billion. Ten years ago, as of June 30, 2011, the benchmark index included 582 global ex US developed markets funds, whose value was roughly $256 billion. The funds in this index invest primarily in developed markets in Australia, Canada, Israel, Japan, New Zealand, Singapore, and Western Europe.
Cambridge Associates derives its Emerging Markets Private Equity and Venture Capital Index from the financial information contained in its proprietary database of global ex US buyouts, growth equity, and venture capital funds. As of June 30, 2021, the database comprised 747 emerging markets private equity and venture capital funds formed from 1986 to 2021 with a value of about $398 billion. Ten years ago, as of June 30, 2011, the benchmark index included 429 emerging markets funds, whose value was about $95 billion. The funds in this index invest primarily in Africa, emerging Asia, emerging Europe, Latin America & Caribbean, and the Middle East ex Israel.
The pooled returns represent the net periodic rates of return calculated on the aggregate of all cash flows and market values as reported to Cambridge Associates by the funds’ general partners in their quarterly and annual audited financial reports. These returns are net of management fees, expenses, and performance fees that take the form of carried interest.
About the Public Indexes
The MSCI All Country World Index (ACWI) is a free float–adjusted, market capitalization–weighted index designed to measure the equity market performance of developed and emerging markets. As of June 30, 2020, the MSCI ACWI consisted of 49 country indexes comprising 23 developed and 26 emerging markets country indexes. The developed markets country indexes included are: Australia, Austria, Belgium, Canada, Denmark, Finland, France, Germany, Hong Kong, Ireland, Israel, Italy, Japan, the Netherlands, New Zealand, Norway, Portugal, Singapore, Spain, Sweden, Switzerland, the United Kingdom, and the United States. The emerging markets country indexes included are: Argentina, Brazil, Chile, China, Colombia, Czech Republic, Egypt, Greece, Hungary, India, Indonesia, Korea, Malaysia, Mexico, Pakistan, Peru, the Philippines, Poland, Qatar, Russia, Saudi Arabia, South Africa, Taiwan, Thailand, Turkey, and the United Arab Emirates.
The MSCI EAFE Index is a free float–adjusted, market capitalization–weighted index that is designed to measure large- and mid-cap equity performance of developed markets, excluding Canada and the United States. As of June 30, 2020, the MSCI EAFE Index consisted of the following 21 developed markets country indexes: Australia, Austria, Belgium, Denmark, Finland, France, Germany, Hong Kong, Ireland, Israel, Italy, Japan, the Netherlands, New Zealand, Norway, Portugal, Singapore, Spain, Sweden, Switzerland, and the United Kingdom.
The MSCI Emerging Markets Index is a free float–adjusted, market capitalization–weighted index that is designed to measure large- and mid-cap equity performance of emerging markets. As of June 30, 2020, the MSCI Emerging Markets Index included 26 emerging markets country indexes: Argentina, Brazil, Chile, China, Colombia, Czech Republic, Egypt, Greece, Hungary, India, Indonesia, Korea, Malaysia, Mexico, Pakistan, Peru, the Philippines, Poland, Qatar, Russia, Saudi Arabia, South Africa, Taiwan, Thailand, Turkey, and the United Arab Emirates.
The MSCI World Index represents a free float–adjusted, market capitalization–weighted index that is designed to measure the equity market performance of developed markets. As of June 30, 2020, it includes 23 developed markets country indexes: Australia, Austria, Belgium, Canada, Denmark, Finland, France, Germany, Hong Kong, Ireland, Israel, Italy, Japan, the Netherlands, New Zealand, Norway, Portugal, Singapore, Spain, Sweden, Switzerland, the United Kingdom, and the United States.
Footnotes
Caryn Slotsky - FootnotesFunds in the emerging markets PE/VC benchmark occasionally invest in companies in developed markets regions, as well as the emerging markets regions.
About Cambridge Associates
Cambridge Associates is a global investment firm with 50+ years of institutional investing experience. The firm aims to help pension plans, endowments & foundations, healthcare systems, and private clients achieve their investment goals and maximize their impact on the world. Cambridge Associates delivers a range of services, including outsourced CIO, non-discretionary portfolio management, staff extension and alternative asset class mandates. Contact us today.