Endowment Radar: Plotting the Role of the Endowment

There are many facets of higher education finance, and it is often challenging to describe how the endowment fits into an institution’s financial picture. Endowment Radar is a visual tool that plots the endowment’s role in the college and university business model. It focuses on four key metrics to assess the endowment’s contributions to the financial health of the institution and the sustainability of that role:
- Endowment Dependence measures the role of the endowment in the annual budget.
- Endowment Distribution to Financial Aid compares endowment spending to the institution’s financial aid and scholarship discounts to students. While the endowment is not entirely earmarked for financial aid, the comparison of the endowment revenue and the discounted contra-revenue provides a picture of how the endowment supports prices charged to students.
- Endowment to Debt focuses on balance sheet health and the ballast the endowment provides for borrowing.
- Net Flow is the net ratio of endowment inflows to endowment spending. It indicates whether the endowment will keep pace with the enterprise, lose ground and have a lesser role, or take on a greater role in the future.
This paper will explain each of the Endowment Radar metrics and how they come together in a visual display that informs stakeholders about the scale and impact of the endowment today. It will also share the results of our Endowment Radar research for a diverse set of colleges and universities. Finally, it will highlight case studies that show how two different institutions have used Endowment Radar to educate stakeholders and frame strategic goals and priorities.
Endowment Radar: Role of the Endowment
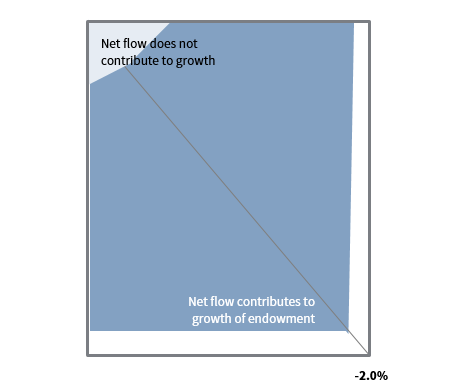
Endowment Radar plots four metrics on the radar chart. When the endowment has a significant role in supporting the budget, pricing, balance sheet, and sustainability, all four corners of the Endowment Radar are filled in. When the endowment plays a minor role in supporting the institution, the Endowment Radar chart has a limited area and room for growth. Each metric measures the endowment’s role in a component of financial health (Figure 1).
FIGURE 1 ROLE OF THE ENDOWMENT: SIGNIFICANT VS LIMITED ROLE
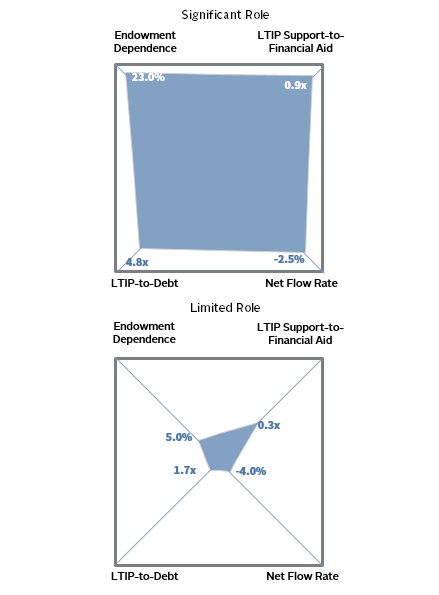
Source: Cambridge Associates LLC.
Endowment Dependence: Role in Supporting the Annual Budget
The endowment’s contribution to operating health is measured by endowment dependence: the ratio of the annual endowment distribution to the operating budget. For private colleges and universities, endowment dependence can range from less than 1% to more than 75%. At the low end of the scale, the endowment does not play much of a role in funding the budget. At the high end, the endowment may be the largest source of revenue, meaning that the institution is more dependent on the long-term investment portfolio than student revenues.
When endowment dependence is 10% or higher, we view the endowment as providing a moderate level of support. At 25% dependence or higher, we perceive the endowment as having a significant role in the budget. Institutions with an endowment at this level often use a spending policy that provides predictable spending and budget support. Spending policy is balancing predictable and sustainable spending with the goal of supporting current and future generations equitably.
FIGURE 2 ROLE IN BUDGET: ENDOWMENT DEPENDENCE
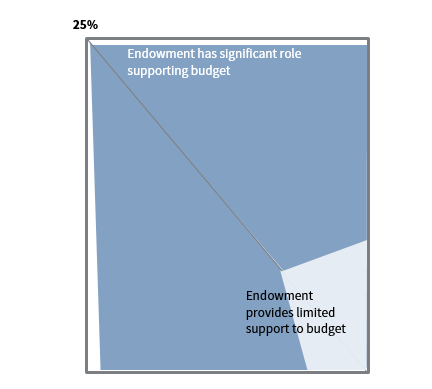
Source: Cambridge Associates LLC.
Endowment Distribution to Financial Aid: Role in Pricing and Affordability and the Endowment “Coverage” of Student Subsidy
For most colleges and universities, tuition revenue is the largest source of operating revenue. Net tuition revenue is the amount that the school collects after discounting charges to students via financial aid and scholarships. For many schools, discount rates are growing as they strive to provide more equitable access to higher education and compete for students based on price. Growing discounts limit net tuition growth and put more pressure on expenses and/or other sources of revenue to fill the gap. The endowment has an important role to play to subsidize affordable pricing decisions and support growth.
While only a portion of the endowment distribution is earmarked for financial aid, the relationship between the endowment distribution and tuition discounting tells us if the endowment is a significant backstop to the institution’s pricing strategy or has a lesser role.
When the endowment distribution to financial aid is 0.5x, the endowment spend covers half of the scholarships and financial aid awards. A coverage ratio of 1.0x, means the endowment subsidy (a revenue line) and the student subsidy (a contra-revenue) are evenly matched. When this relationship is greater than 0.5x, and closer to 1.0x, we believe institutions are discounting from a position of financial strength. When the endowment plays a significant role, it provides more coverage for pricing flexibility and student aid. With limited endowment support, institutions must count on higher tuition from full paying students, other revenue sources, and/or limited expense growth to balance a sustainable financial equation.
FIGURE 3 ROLE IN PRICING: ENDOWMENT DISTRIBUTION TO FINANCIAL AID
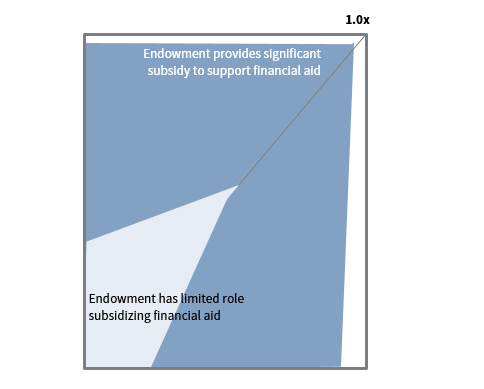
Source: Cambridge Associates LLC.
Endowment to Debt: Role in Balance Sheet Health and Relationship to Debt
The endowment assets anchor the university balance sheet, providing long-term capital to support the perpetual mission of the institution. The endowment’s relationship to debt is important to balance sheet health. In addition to providing annual revenue, the endowment offsets long-term liabilities and often endowment capital is a source of liquidity to support debt costs, ratings, and covenants. When the endowment value is four times (4x) outstanding debt or higher, we believe the endowment provides moderate ballast for borrowing and contributes to balance sheet health. When this ratio is closer to 6x, the endowment provides significant ballast.
When this relationship is at 2x or lower, debt management and capacity issues can dominate the balance sheet and raise costs of borrowing. This could also limit the growth potential of the endowment portfolio by constraining investment strategy, because strategies that reach for growth may also increase volatility (fluctuations in market value) and illiquidity (private investments), which could trip debt covenants and threaten the debt rating and increase the cost of borrowing.
FIGURE 4 ROLE IN BALANCE SHEET HEALTH: ENDOWMENT TO DEBT
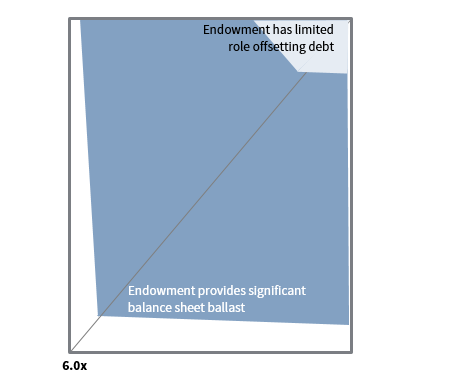
Source: Cambridge Associates LLC.
Net Flow: Role in Sustainability
Net flow measures the relationship of endowment spending to inflows and outflows and assesses whether the combination of new gifts and additions and spending contribute to endowment growth. When inflows offset outflows, an institution is growing its endowment beyond investment performance, adding funds and additional support of institutional commitments and priorities. When spending dwarfs additions, endowment growth is only attainable if investment performance exceeds spending and inflation.
An endowment that grows beyond spending and inflation can support additional programs and enterprise growth. New gifts to the endowment enable the portfolio to support a growing enterprise. If new gifts do not come in the endowment will most likely only keep up with its existing level of support for existing programs. Lower spending today is another lever that enables an endowment to grow for a greater role in the future.
FIGURE 5 ROLE IN SUSTAINABILITY: NET FLOW RATE
Source: Cambridge Associates LLC.
Endowment Radar Peer Study
Looking across a large cohort of 88 private colleges and universities, 1 we see that the role of the endowment can vary drastically. But the endowment at the median institution by market value plays a significant role in that institution. 2
FIGURE 6 ENDOWMENT RADAR MAP: MEDIAN INSTITUTION
Fiscal Year 2019 Private C&U Data • 5th to 75th Percentile Range
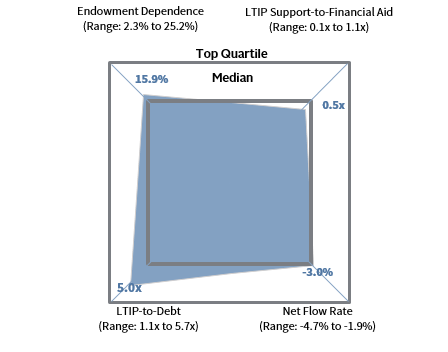
Source: Cambridge Associates LLC.
For the median institution, the endowment covers nearly 15.9% of the operating budget, half the financial aid award to students, and five times the debt load. Net flow of -3% contributes to some endowment growth.
Median results for each Endowment Radar metric also reflect an important role for the endowment, but results are slightly muted for Endowment Dependence and Endowment to Debt. Looking at each median metric the endowment supported, nearly 12% of the operating budget and the distribution matched half of the financial aid and scholarship discounts, and endowment assets were more than 4x outstanding debt. Spending was offset by inflows with a median net flow rate at -3%, the institution can expect growth beyond a 5% real return, so the endowment may keep pace with a growing enterprise and maintain or even grow its role in the future.
FIGURE 7 ENDOWMENT RADAR MAP
Fiscal Year 2019 Private C&U Data • 5th to 75th Percentile Range
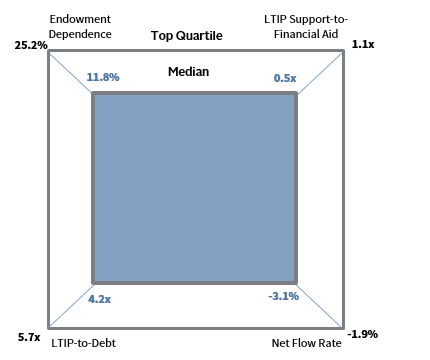
Source: Cambridge Associates LLC.
Plotting the Future Course
The Endowment Radar tells us much about the role of the endowment at a point of time, and it seeds the important conversation about the future role of the endowment. As stakeholders use Endowment Radar to understand how the endowment relates to the institutional business model today, they can also discuss if and how they can take action to change that role. In the following two case studies, we consider an institution where the endowment plays a significant role but is at risk of losing ground to the growing enterprise. We also show the case of an institution where the endowment plays a limited role and uses Endowment Radar to demonstrate how the role could expand with growing endowment fundraising and prioritization.
Maintaining a Significant Role
For the institution where the endowment already plays a significant role, net flow is a key metric to maintaining that level of support. In Figure 8, University A is in an enviable position of receiving strong support from the endowment, but the University has weaker net flow of -4%. A long-term target spending rate of 5% is generally set to maintain the purchasing power of the existing endowment funds. 3 A net flow of rate of -4.0% indicates that gifts are adding 1% to the endowment’s market value after spending.
FIGURE 8 ENDOWMENT RADAR MAP: UNIVERSITY A
Fiscal Year 2019 Private C&U Data • 5th to 75th Percentile Range
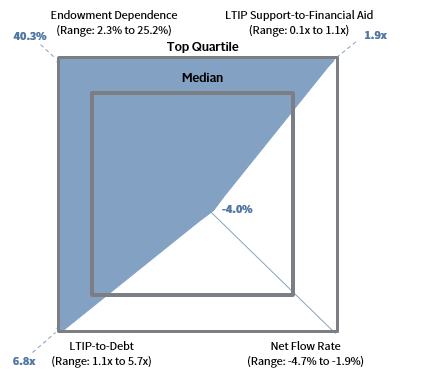
Source: Cambridge Associates LLC.
Without strong net flow, the endowment may lose ground as the enterprise grows. It may be that the University’s current strength makes maintenance a strategic goal. But if the University plans to expand programs, financial aid commitments, and borrowing then the 1% endowment inflow rate may not keep pace with the enterprise.
Growing the Role of the Endowment
Endowment growth can relieve pressure on other revenues and bolster the long-term, sustainable financial equation. For the institution where the endowment has a limited role and growth is a goal, net flow is a key metric. To grow net flow an institution may limit spending levels and focus on building inflows to the endowment through endowment fundraising or contributions from positive operating results. 4
Endowment Radar can be a helpful tool to explain the impact of endowment gifts. In Figure 9, we show an institution starting with a $100 million endowment, that plays a minor role. A hefty infusion of $50 million and an improvement in net flow can transform the role of the endowment. The evolving Endowment Radar map shows that the endowment provides more substantial support of the budget (shifting from 5% dependence to 7.5%), pricing strategy (financial aid coverage improves from .3x to .4x), and the balance sheet (with room for improvement, the growing endowment now represents 2.5x of debt).
FIGURE 9 ENDOWMENT RADAR MAP: UNIVERSITY B BEFORE & AFTER $50M GIFT
Fiscal Year 2019 Private C&U Data • 5th to 75th Percentile Range
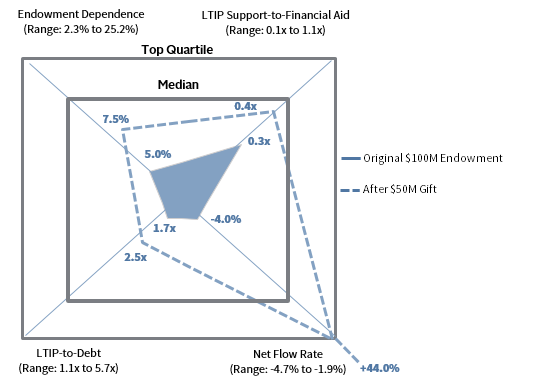
Source: Cambridge Associates LLC.
Endowment Radar shows the transformative power of endowment giving and endowment support. As institutions weather tumultuous enterprise conditions, fundraising for endowment may seem like an unaffordable luxury, but endowment is part of a long-term sustainable financial equation. This is something that donors and stakeholders want to see; they want to be assured that an investment today will go a long way.
Conclusion
The current economic environment and other challenges—ranging from crisis response, to program delivery, to pricing pressures—have put unprecedented strain on college and university business models. One striking effect of these industry and macroeconomic factors is the growing importance of the endowment. It may serve as a source of funding, or alternately as ballast for access to other sources of capital and investment performance. Endowment fundraising has become ever more central to overall institutional financial performance. To track the ability of the endowment’s role and ability to keep pace, we suggest that the Endowment Radar results be reviewed annually, both in relative terms (peer comparisons) and in absolute terms over time.
Footnotes
- The 88 institutions included in this study are private college and university clients in Cambridge Associates’ peer data universe for which audited financial statements were available for fiscal year 2019.
- Median market value falls between $750 million and $800 million.
- Long-term (25+ year) return projections suggest that a diversified, equity-oriented portfolio can expect to achieve annualized real returns of approximately 5%–6% (nominal returns of 8%–9%), thus allowing for maintenance of purchasing power while spending 5% per year.
- Current pressures on operating budgets make limited spending a less attractive option, as it may be unfair to current stakeholders and hamper efforts to balance the current budget. Fundraising builds capacity while maintaining existing commitments.
About Cambridge Associates
Cambridge Associates is a global investment firm with 50+ years of institutional investing experience. The firm aims to help pension plans, endowments & foundations, healthcare systems, and private clients achieve their investment goals and maximize their impact on the world. Cambridge Associates delivers a range of services, including outsourced CIO, non-discretionary portfolio management, staff extension and alternative asset class mandates. Contact us today.