Endowment Radar Study 2023: Endowment Dependence Grows with Higher Costs


Higher costs and higher rates of endowment spending are the major story lines of the 2023 Endowment Radar Study. 1 In 2023, the endowment provided a stable source of funding for the growing costs of private college and university business model (Figure 1). The four components of Endowment Radar measure the endowment’s role in supporting the annual budget (Endowment Dependence), pricing strategy (Endowment Support-to-Financial Aid), balance sheet health (Endowment-to-Debt), and financial sustainability (Net Flow Rate).
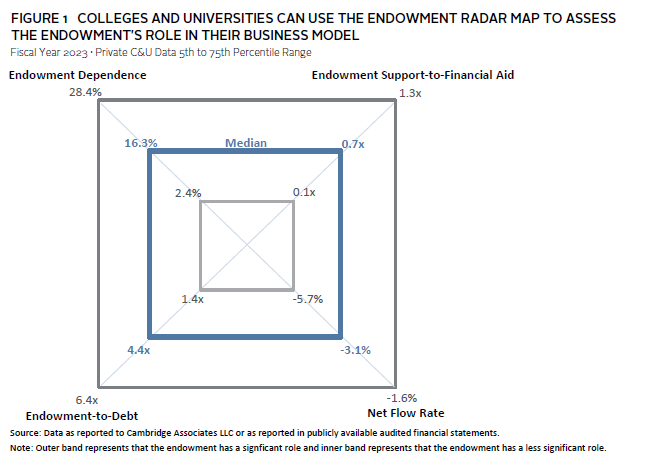
This year we saw endowment strength in three of the four metrics.
- The endowment’s role grew slightly as it supported a higher portion of growing operating budgets compared to 2022. At the median of our data set, the endowment supported 16% of operating expenses.
- The endowment maintained the level of coverage of growing financial aid commitments. Endowment distributions represented 0.7x coverage of tuition discounts.
- Endowment market values and debt balances grew in sync in 2023 as the endowment continued to provide ballast on the balance sheet, measured by a 4.4x median endowment-to-debt ratio.
- Due to higher effective spending rates, the net flow rate (-3.1%) was weaker in 2023, but new gifts continued to provide an additional source of endowment growth and liquidity.
The Endowment Is Supporting a Growing Portion of Growing Costs
Levels of endowment dependence vary across the 80 colleges and universities in the 2023 Endowment Radar Study. Endowment support ranges from a small fraction of the university budget to supporting more than half (Figure 2).
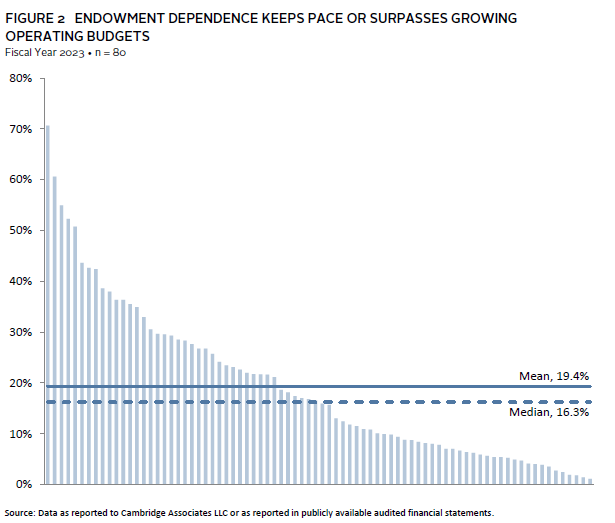
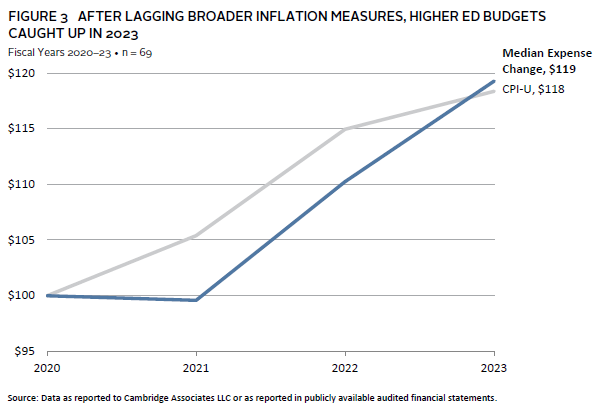
The median level of endowment dependence was 16.3% in 2023, which was similar to 2021 and higher than 2022 (14.1%). This year’s growth in endowment dependence is notable, given the significant growth in operating budgets that the endowments are supporting. For the median institution, the growing level of endowment support was driven by a 10.5% increase in endowment distribution, which outpaced the significant 8.3% growth rate of expenses. For the colleges and universities in our study, expense growth outpaced broader inflation 2 in 2023, but kept pace with recent trends, as higher education costs caught up with broader inflation growth over the past three years (Figure 3).
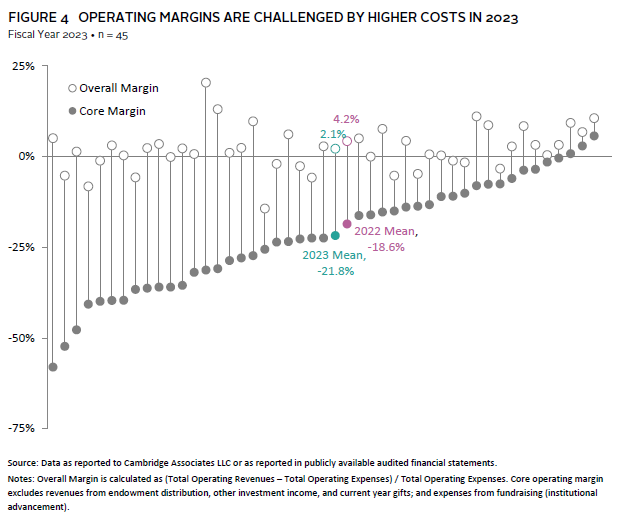
Revenues also increased in 2023, but the 6.3% median revenue increase did not keep pace with the 8.3% growth in expenses. This dynamic is demonstrated in slightly narrower operating margins (Figure 4). On average, core operating margins before endowment and gift subsidies were more negative (-21.8% in 2023 versus -18.6% in 2022). The median overall margin finished positive but had less cushion (2.1% in 2023 versus 4.2% in 2022). The number of institutions completing the fiscal year with a negative margin more than doubled in 2023, indicating the challenging financial environment for many.
Putting all of these financial pieces together, we can see that the endowment is taking on a growing role in supporting growing costs that are outpacing other revenue sources for most colleges and universities in the Endowment Radar study.
Tuition Discounts Keep Pace With Tuition Prices
One of the pressure points for the operating margin is the growing “cost” of forgone revenue in the form of discounted tuition provided to students as financial aid and scholarships. Financial aid commitments have increased for the colleges and universities in our study every year. This trend continued in 2023 when the average growth rate in financial aid was 5.2%, keeping pace with the growth in tuition charges, which increased 5.1%. 3 The average tuition discount was 44%, meaning, on average, institutions collected 56% of the tuition charged to students. Net tuition revenue growth has been limited, as schools have increased financial and merit aid to respond to growing student needs and the competitive enrollment landscape.
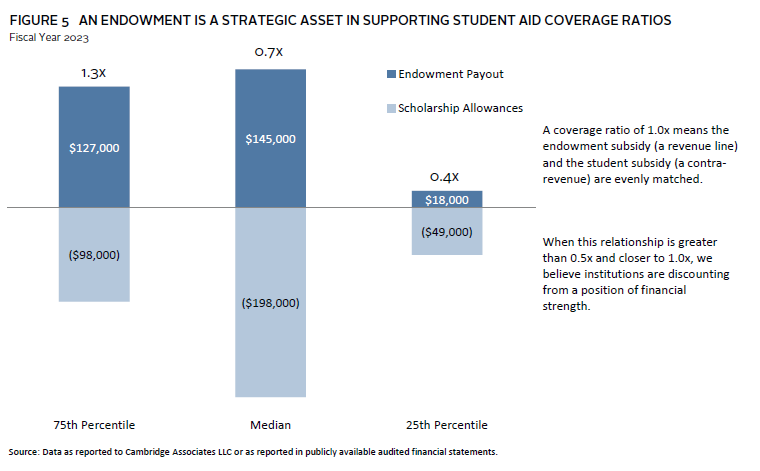
The endowment distribution directly supports financial aid and scholarships via endowments restricted for those purposes and indirectly by subsidizing total costs, which increases the availability of other funds that can be used to support financial aid. Endowment support-to-financial aid is a coverage ratio that considers the direct and indirect roles the endowment plays in pricing strategy. 4 It measures the relationship between endowment distribution and tuition discounts to compare the endowment subsidy to the budget to the forgone revenue discounted to students. The coverage ratio of endowment distribution-to-financial aid ranged from 0.1x to 4.6x and the median was 0.7x (Figure 5).
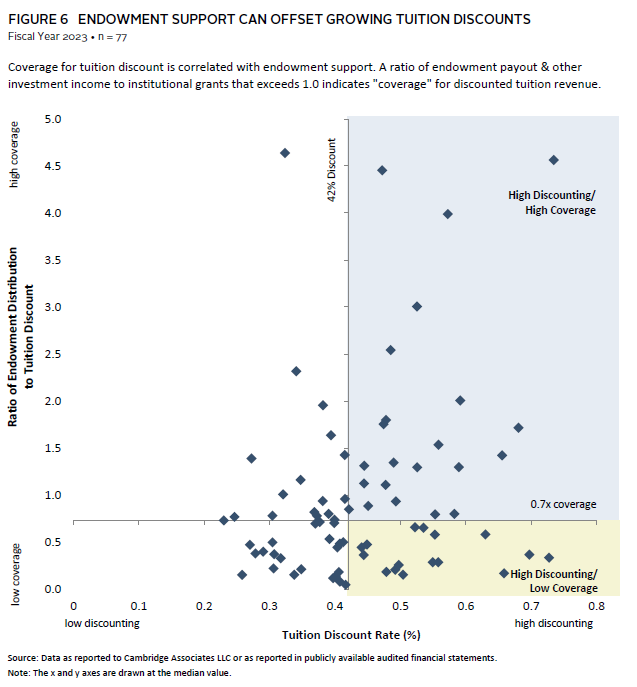
The institutions that have endowment “coverage” for financial aid can offset forgone tuition revenue with endowment spending (Figure 6). This enables them to deliver their discounted price to students from a position of strength as shown in light blue shading in the upper-right quadrant. The colleges and universities in yellow shading on the lower-right side are offering high discount rates, but from a weaker financial position. Without a higher subsidy from the endowment to offset this forgone revenue, they will need to employ other financial levers—such as auxiliary revenue, annual fund gifts, and careful expense management—to fund these commitments and balance the budget.
Endowment Values Shifted the Balance Sheet
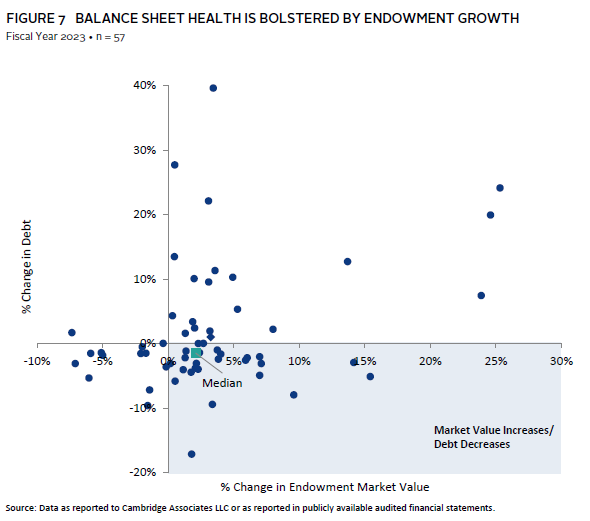
Balance sheets were strengthened for many institutions in 2023 as the median endowment market value grew (2.1%) and the median debt burden decreased (-1.5%). Growth in assets relative to liabilities resulted in the median endowment-to-debt ratio of 4.4x, an uptick from the 4.0x median in 2022. At the institutional level, we see a range of experiences (Figure 7). More than 75% of the institutions saw an increase in 2023 market value, and approximately 60% reduced their debt obligations. Nearly 40% of the institutions saw greater balance sheet strength with a combination of increased endowment market value and decreased outstanding debt obligations.
Net Flow Rate
In addition to long-term performance, net flow—the ratio that calculates the net rate of spending and inflows—is an indicator of whether the endowment will keep pace with the enterprise, lose purchasing power, or take on a greater role in the future. Most colleges and universities have negative net flow rates, but the degree that inflows offset spending from the endowment determine the liquidity profile and purchasing power of the portfolio.
Net flow is a metric that tends to vary considerably by institution, and from year to year for some institutions, because it is sensitive to cash flow timing and the unanticipated event, such as the gift of a large bequest (Figure 8). The calculated rate is also sensitive to the beginning endowment market value, which is the ratio’s denominator. In 2023, there were more negative net flow rates, driven by higher rates of spending.
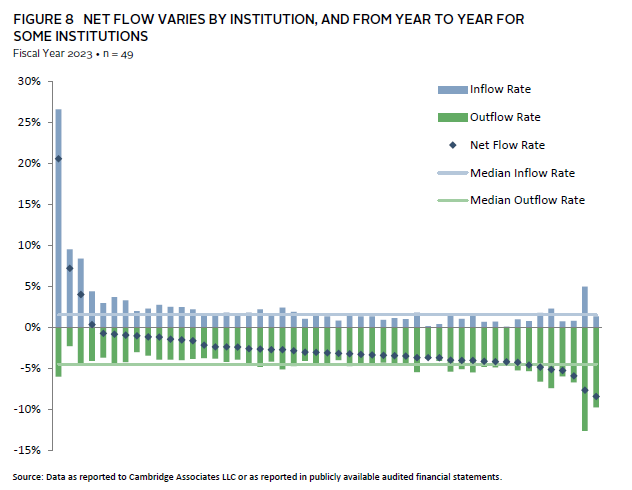
The 1.5% median inflow rate was the same as the prior year, but the median effective spending rate increased from -3.8% to -4.4%, resulting in a shift in the median net flow rate from -2.1% to -3.0%. This was a result of lower beginning endowment market values for many institutions, as well as higher spending volume. As noted in the endowment dependence discussion, distributions increased more than 10%, as more dollars were spent from the endowment in 2023.
Higher spending coincides with higher costs this year and puts more reliance on strong investment performance to maintain purchasing power of existing endowment funds. Purchasing power should be monitored over longer cycles that are in line with the long-term nature of endowment capital and policy goals.
Conclusion
Endowments provided an important ballast to the private college and university business model in 2023. For many the institutions, higher costs and financial aid commitments were accompanied by growing endowment market values. Greater endowment dependence was fueled by higher rates of spending. Balance sheet health improved for the majority of institutions.
Endowment Radar brings together analysis of several financial metrics that can and often do change from year to year. Reviewing these results helps to manage with an eye toward future risks that may impact investment markets and university operations, including inflation, interest rates, and demographics. Evaluating these metrics and the role of the endowment in supporting colleges and universities during these tumultuous times helps to support near-term and long-term decisions and strategies.
This report includes data on 80 private college and university clients of Cambridge Associates, with endowment market values as of June 30, 2023, ranging from $82 million to $56 billion, with a median of $1.9 billion. Most of the data used in this report were provided to Cambridge Associates LLC through our annual survey of colleges and universities. We have accessed additional data through publicly available audited financial statements, specifically on tuition discounting and to fill gaps in reported data. “Endowment” is used throughout to refer to the entire long-term investment portfolio (LTIP); the vast majority of college and university LTIPs are composed of endowment, though operating funds and other capital are often invested alongside.
Footnotes
- Endowment Radar is a methodology that Cambridge Associates developed to visually evaluate the endowment’s role in the college and university enterprise. Data as reported to Cambridge Associates LLC, or as reported in publicly available audited financial statements for 80 private colleges and universities.
- Consumer inflation measured by Urban Consumer Price Index: CPI-U.
- The 2022 to 2023 comparison is for a constant universe of 73 institutions. Financial aid commitment is measured as all scholarship aid provided to students as reported on financial statements, including aid for undergraduate and graduate students, and aid to tuition, fees, room, and board.
- Note that the endowment distribution is not all designated for financial aid. We are simply comparing the subsidy from endowment to the forgone revenue of student aid. We are also using discount rate as a barometer of price, recognizing that it is an imperfect assumption.
Tracy Filosa - Tracy is a Managing Director and Head of CA Institute.
About Cambridge Associates
Cambridge Associates is a global investment firm with 50+ years of institutional investing experience. The firm aims to help pension plans, endowments & foundations, healthcare systems, and private clients achieve their investment goals and maximize their impact on the world. Cambridge Associates delivers a range of services, including outsourced CIO, non-discretionary portfolio management, staff extension and alternative asset class mandates. Contact us today.