Endowment Radar Study 2022: A Dynamic Role

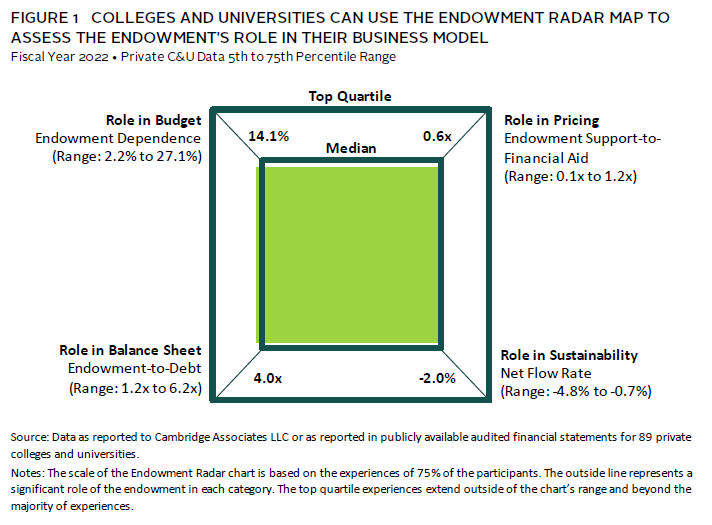
Endowment Radar is a methodology that Cambridge Associates developed to visually evaluate the endowment’s role in the college and university enterprise. The four components of Endowment Radar measure the endowment’s role in supporting the annual budget (Endowment Dependence), pricing strategy (Endowment Support-to-Financial Aid), balance sheet health (Endowment-to-Debt), and financial sustainability (Net Flow Rate).
Our 2022 Endowment Radar Study reflects the important role of the endowment in the dynamic private college and university business model (Figure 1). The endowment played a relatively smaller role in supporting growing operating budgets and financial aid commitments compared to 2021. At the median points of our data set, the endowment supported 14.1% of operating expenses and represented 0.6x coverage of tuition discounts. Flat or depleted endowment market values in 2022 also led to a diminished, but still substantial role on the balance sheet, measured by 4.0x median Endowment-to-Debt ratio. The net flow improved to -2.0%, as spending from the endowment was partially offset by new gifts, providing an additional source of endowment growth.
The Endowment is Supporting a Smaller Portion of Growing Costs
The endowments in this study range from supporting a small fraction of the university budget to supporting more than half (Figure 2).
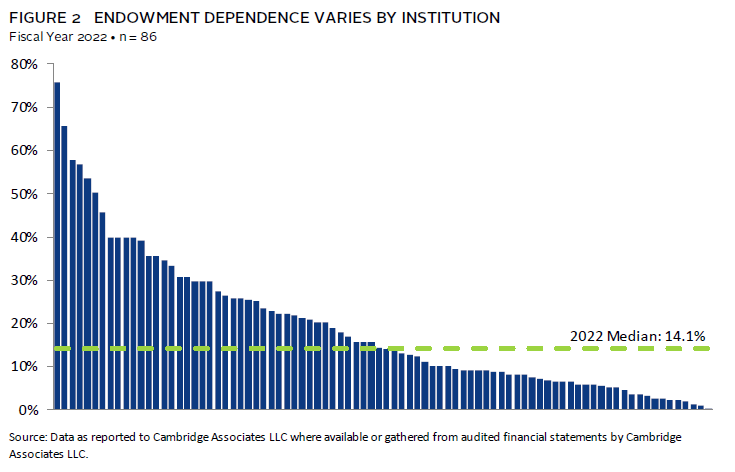
The median level of endowment dependence was 14.1% in 2022, which was similar to the level in 2020, and down from the uptick to 16% in 2021. The ups and downs of endowment dependence over the past three years have been driven by the major shifts in expenses; endowment support has grown consistently at more than 4% per year during that period (Figure 3).
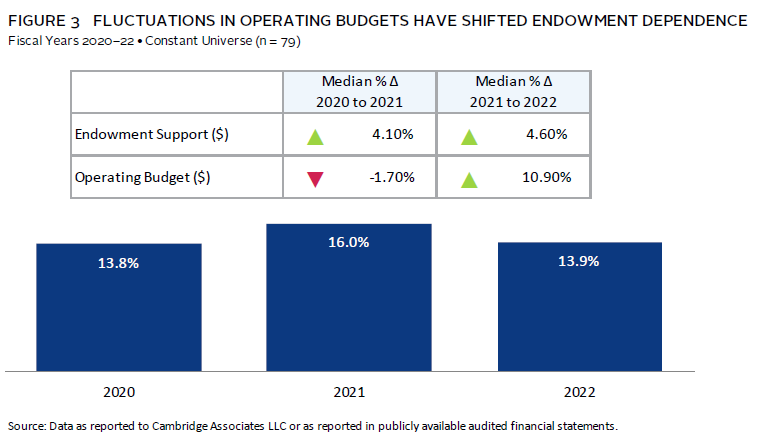
In 2021, nearly half of institutions that saw growth in endowment dependence also experienced a contracting operating budget—a very unusual financial outcome for the modern-day university. That trend reversed emphatically in 2022, as operating expenses increased at every institution in our study. For more than 75% of private colleges and universities, growing costs coincided with a reduction in endowment dependence in 2022, as shown in the lower right-hand corner of Figure 4.

Tuition Discounts Continue to Grow
One of the pressure points for the operating margin is the growing “cost” of forgone revenue in the form of discounted tuition provided to students as financial aid and scholarships. Financial aid commitments have increased for the colleges and universities in our study every year. This trend continued in 2022, when the median growth rate in financial aid was 12.0%. 1 The average tuition discount was 44%, meaning on average, institutions collected 57% of the tuition charged to students. Net tuition revenue growth has been limited in 2022, as schools have increased financial and merit aid to respond to growing student needs and the competitive enrollment landscape. 2
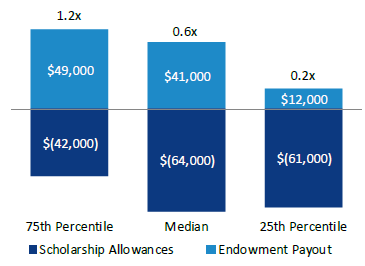
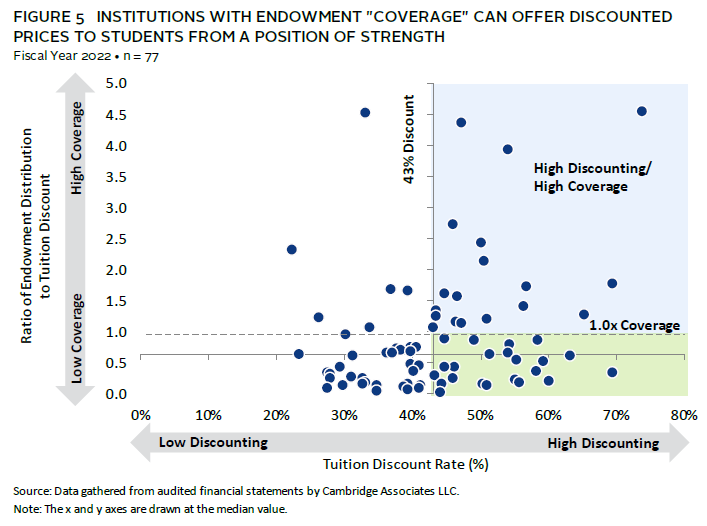
The endowment distribution supports financial aid and scholarships directly via endowments restricted for those purposes and indirectly by subsidizing total costs, which increases the availability of other funds that can be used to support financial aid. Endowment Support-to-Financial Aid is a coverage ratio that considers the direct and indirect roles the endowment plays in pricing strategy. 3 It measures the relationship between endowment distribution and tuition discounts to compare the endowment subsidy to the budget to the forgone revenue discounted to students. The coverage ratio of endowment distribution to financial aid ranged from 0.1x to 4.6x and the median was 0.6x.
Coverage Ratios
A coverage ratio of 1.0x, means the endowment subsidy (a revenue line) and the student subsidy (a contra-revenue) are evenly matched.
When this relationship is greater than 0.5x and closer to 1.0x, we believe institutions are discounting from a position of financial strength.
The institutions that have endowment “coverage” for financial aid can offset forgone tuition revenue with endowment spending (Figure 5). This enables them to deliver their discounted price to students from a position of strength, as shown in light blue shading in the upper-right quadrant. The colleges and universities in green shading on the lower-right side are offering high discount rates, but from a weaker financial position. Without a higher subsidy from the endowment to offset this forgone revenue, they will need to employ other financial levers—such as auxiliary revenue, annual fund gifts, and careful expense management—to fund these commitments and balance the budget.
Declines in Endowment Values Shifted the Balance Sheet
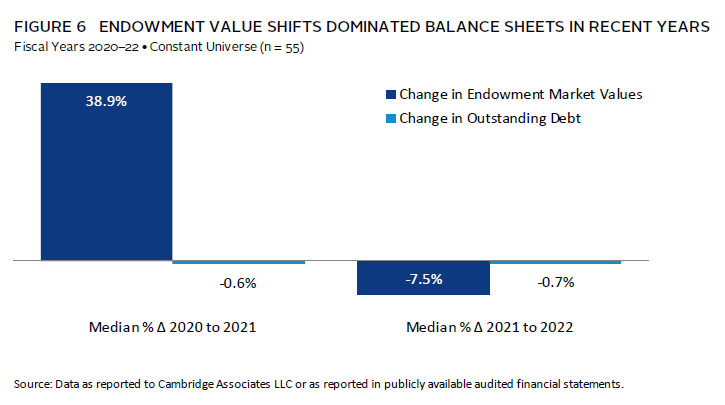
The median change in endowment market value in 2022 was -7.5%, a reversal of the 39% increase in 2021 (Figure 6). Nearly every institution saw a drop in endowment market value in 2022, while debt experiences varied. On average, debt loads in our study increased 9%, but the median declined 0.7%. More than half (56%) of the colleges and universities reduced their outstanding debt balance in 2022. For those that increased borrowing, increases ranged as high as 66%, skewing the average.
Shifting Endowment Values Impact Net Flow Rate
In addition to long-term performance, net flow—the ratio that calculates the net rate of spending and inflows—is an indicator of whether the endowment will keep pace with the enterprise, lose purchasing power, or take on a greater role in the future.
Net flow is a metric that tends to vary considerably by institution, and from year to year for some institutions, because it is sensitive to cash flow timing and unanticipated events, such as the gift of a large bequest. The calculated rate is also sensitive to the beginning endowment market value, which is the ratio’s denominator. Inflow rates and outflow (spending) rates were lower in 2022 because the beginning market value denominator was elevated due to strong 2021 investment performance (Figure 7).
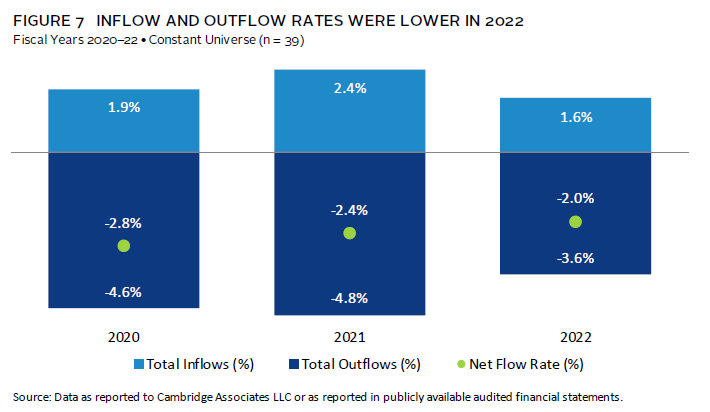
The median net flow rate was -2.0%, meaning that nearly half of the -3.6% spending rate was offset by 1.6% inflow rate. While effective spending rates were lower in 2022, most colleges and universities continue to draw a steady level of spending and adhere to the long-term discipline built into most endowment spending policies. 4
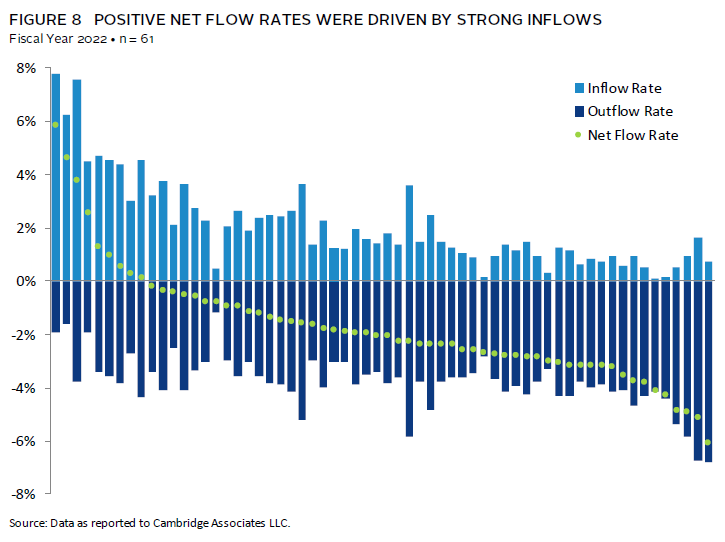
Positive net flow rates were driven by strong inflows, and, in some cases, more muted spending rates (Figure 8). Net flow is a source of endowment growth when inflows outpace outflows. At the lower end of the net flow range (right-hand side), high spending significantly overshadowed inflows. To grow their endowment, those institutions must rely on performance outpacing a low net flow rate. In the middle of Figure 8, we see a variety of experiences. In some cases, high spending is partially offset by successful fundraising; in others, we see lower spending accompanied by low inflows.
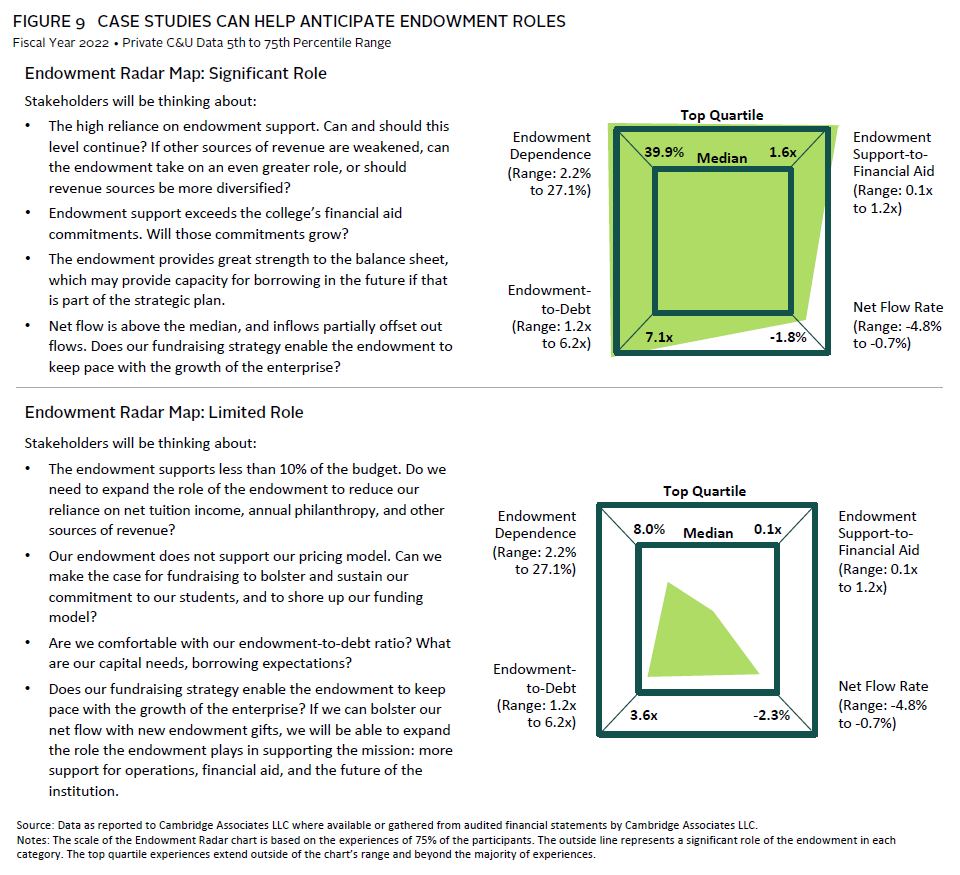
Endowment Radar Case Study Comparison
An annual review of Endowment Radar results provides context for discussions about investment policy and endowment management, as well as an institution’s financial sustainability. It can help institutional leaders and investment committees understand key links to the enterprise as they consider or underwrite the liquidity and risk profile of the endowment.
In our case studies, we anticipate the conversations about two different Radar charts, one example where the endowment plays a significant role and another where the endowment has a more limited role (Figure 9). Each institution can use this information to discuss the current and future role of the endowment.
Conclusion
The private college and university business model experienced more change in 2022. For many institutions, higher costs and financial aid commitments were accompanied by a reduction in endowment market value, but net flows provided hope that the endowment can keep pace with the growing enterprise. While the endowment’s role was slightly diminished this year, it continued to play an important role in funding the enterprise and providing ballast to the balance sheet and the sustainable financial model. Endowment Radar brings together analyses of several financial metrics that can and often do change from year to year. Reviewing these results helps us manage with an eye toward future risks that may impact investment markets and university operations, including inflation, interest rates, and demographics. We evaluate these metrics and the role of the endowment in supporting colleges and universities during these tumultuous times to support near-term and long-term decisions and strategies.
Notes on the Data
This report includes data on 89 private college and university clients of Cambridge Associates, with endowment market values as of June 30, 2022, ranging from $78 million to $55 billion, with a median of $1.3 billion. Most of the data used in this report were provided to Cambridge Associates LLC through our annual survey of colleges and universities. We have accessed additional data through publicly available audited financial statements, specifically on tuition discounting and to fill gaps in reported data. “Endowment” is used throughout to refer to the entire long-term investment portfolio (LTIP); the vast majority of college and university LTIPs are composed of endowment, though operating funds and other capital are often invested alongside.
Footnotes
- The 2021 to 2022 comparison is for a constant universe of 55 institutions. Financial aid commitment is measured as all scholarship aid provided to students as reported on financial statements, including aid for undergraduate and graduate students and aid to tuition, fees, room, and board.
- According to Moody’s, private university net tuition revenue grew at a median of 1.8% in fiscal year 2022, trailing inflation.
- Note that the endowment distribution is not all designated for financial aid. We are simply comparing the subsidy from endowment to the forgone revenue of student aid. We are also using discount rate as a barometer of price, recognizing that it is an imperfect assumption.
- Most endowed institutions rely on annual distributions from the endowment as a source of supplemental operating revenue. These distributions are based on the institution’s endowment spending policy, which links the long-term investment portfolio (LTIP) and the enterprise. The spending policy should be designed to balance the needs of current and future generations of stakeholders, with the goals of providing appropriate levels of support to operations and preserving, or even growing, endowment purchasing power.
About Cambridge Associates
Cambridge Associates is a global investment firm with 50+ years of institutional investing experience. The firm aims to help pension plans, endowments & foundations, healthcare systems, and private clients achieve their investment goals and maximize their impact on the world. Cambridge Associates delivers a range of services, including outsourced CIO, non-discretionary portfolio management, staff extension and alternative asset class mandates. Contact us today.