VantagePoint – The Path Ahead: From a Bear Market to the New Normal


There are two kinds of forecasters: those who don’t know, and those who don’t know they don’t know—John Kenneth Galbraith
Equity markets have priced in an optimistic scenario of earnings recovering to pre-COVID-19 levels by the end of next year—a V-shaped recovery. While certainly within the realm of possibility, there is considerable risk to this scenario.
We have received many inquiries about what shape the economic and capital market recovery from this recession will take and what life will look like after the COVID-19–related crisis passes; we readily admit that we do not know. As investors, we are guided by what outcomes or events would cause different types of recoveries and the degree to which our understanding and beliefs are different from those of the market consensus. We ground our views in our understanding of historical events, nuances of the current environment, and market valuations.
In this edition of VantagePoint, we review the shape of historical recoveries from bear markets and recessions. We consider what conditions could support a V-shaped recovery, and circumstances under which other, more gradual recoveries would likely prevail. Finally, we briefly explore some possibilities about how COVID-19 will change behavior and demand preferences over time. In preview, we believe that both a V-shaped and a disastrous L-shaped economic recovery are unlikely, with a W- or U-shaped economic recovery more probable. With regard to how the world may change, we are looking for opportunities that have been accelerated by current conditions but are not overly expensive, as well as areas where markets are pricing in poor long-term prospects even though the future may be brighter.
The Anatomy of a Bear Market
The circumstances around the current market environment could hardly be more unusual. The sudden stop in economic activity across much of the globe in response to a novel coronavirus, SARS-CoV-2, has triggered an economic collapse and led to an extraordinary monetary and fiscal policy response. Never have we seen this mix of circumstances, yet markets have moved with unusual speed to price in high odds of a V-shaped economic recovery. Global equities fell 32.4% in just over a month and have now retraced 65% of their losses. Markets often begin their recovery and never look back in the aftermath of exogenous events; they fall in response to a shock and recover once it appears that the conditions that caused the shock have passed. However, often when economies fall into recession, relief rallies fade—in the United States, since 1928, six of nine recessionary bear markets saw relief rallies before they ultimately bottomed. Recessionary bear markets saw a median of three such rallies, with a median gain of 17.8%. If history serves as a useful guide, we would expect interim setbacks before markets bottom and then fully recover.
As we’ve discussed, progress toward containment of the spread of COVID-19, together with a fast and forceful policy response, have reduced downside risk to the economy and corporate earnings, thus improving prospects for risk asset returns. Yet considerable uncertainty remains. In this paper, we look at historical bear market recessions and consider what assumptions or conditions are consistent with various economic recovery paths.
The ABCs of Recession-Related Bear Markets
Most recessions are relatively short-lived. Since 1928, the United States has experienced 14 recessions, nine of which have lasted less than one year (V-shaped recessions), four (1937–38, 1973–75, 1981–82, and 2007–09) lasted more than a year (U-shaped recessions), and one—the Great Depression—lasted for 3.7 years and saw the economy relapse into another recession four years later before markets and the economy had a chance to recover (L-shaped recession). The back-to-back recessions in 1980 and 1981–82 can be considered a W-shaped recession. All these types of recessions are prevalent in other countries with similar frequency—V-shaped being most common; U-shaped being fairly common; and W- and L-shaped being rare. There is considerable art in these definitions, as such letter shapes aren’t standardized. 1
All but five US recessions resulted in equity bear market contractions (20%+), with the remaining nine recessions lasting an average of 14 months and experiencing an average peak-to-trough equity price decline of -35.6% over 17 months. On average, it took 45 months, or 3.75 years, to fully recover from the trough (although this was skewed by the Great Depression). The most optimistic picture is provided by looking at the five V-shaped bear-market recessions. For these periods, the average recession duration was 10 months, the average equity drawdown was 25% over 16 months, and the time to recover from the trough was 22 months. The picture for earnings looked quite similar. If markets saw their bottom on March 23 after falling for just over one month, this would mark the fastest bottoming process on record.
EQUITY MARKET RECOVERIES FROM RECESSION-INDUCED BEAR MARKETS CAN TAKE TIME
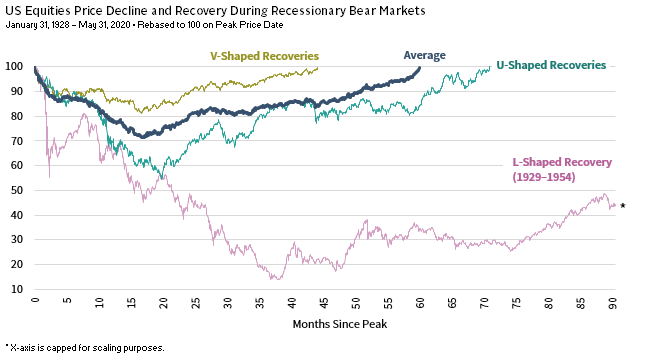
Sources: MSCI Inc., Standard & Poor’s, and Thomson Reuters Datastream. MSCI data provided “as is” without any express or implied warranties.
Notes: The V-shaped recoveries line is the average of the following market peak to recover periods: 1946–50, 1956–58, 1968–72, 1990–91, 2000–07. The U-shaped recoveries line is the average of the following market peak-to-recovery periods: 1973–80 and 2007-13. The 1937–38 recession is also considered to be a U-shaped recovery, but the associated market returns are not included in the U-shaped average because the period overlaps with the Great Depression–related market peak-to-recovery (1929–54) and with WWII, therefore may not be representative of the average market experience during U-shaped recessions. The average line includes all of the V- and U-shaped periods plus 1929–54, 1937–46, and 1980–82. Data are based on the S&P 500 prior to December 31, 1969, and MSCI US Index thereafter. All data are daily price returns.
Real US GDP fell an estimated 1.3% in first quarter 2020 (5.0% annualized), and analysts expect it to drop another 8.5% to 11% in second quarter (30%–40% annualized). For context, this would swamp the declines seen during the Great Recession, which saw GDP fall 4.3% from its peak in fourth quarter 2007 through its trough in second quarter 2009. The Organisation for Economic Co-operation and Development (OECD) estimates the initial direct economic impact of COVID-19 containment measures could result in an annualized GDP decline of between 20% and 25% in many economies, or roughly a 2 percentage point decrease in annual GDP growth per month. That figure doesn’t account for spillover effects from global trade and potential for a second wave of COVID-19 in the fall or winter.
With such a large decline in GDP, it is hard to imagine the economy regaining all the lost ground in a V-shaped recovery. For the economy to bounce back so strongly, a variety of highly uncertain conditions would need to resolve favorably. The following table provides a summary of key assumptions that would underpin various types of recoveries.
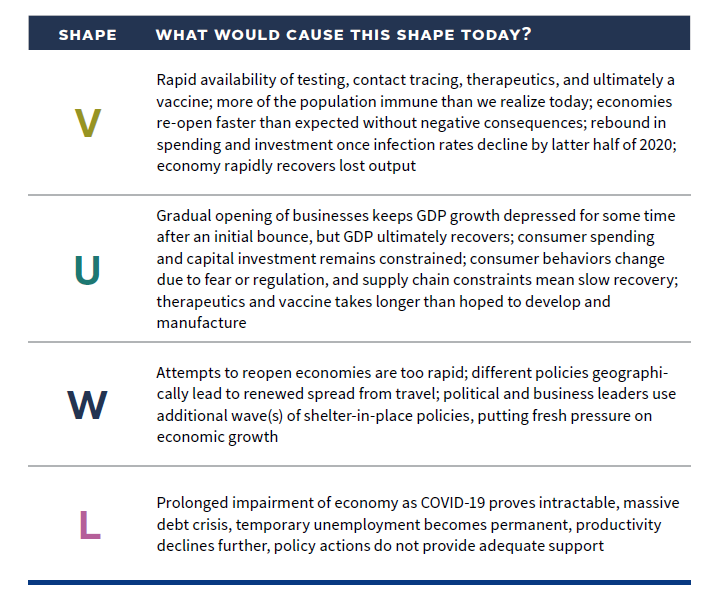
We regard a U- or W-shaped recovery as most plausible, and it appears we are not alone. A global association of CEOs found that 60% of survey respondents (3,534 in 109 countries) were planning for a U-shaped economic recovery. Similarly, according to a survey by Reuters, 55% of economists believe a U-shaped recovery is most likely.
Indeed, even as the economy begins to recover from the sudden halt in economic activity resulting from lockdowns, will the recovery be strong enough to stop the cyclical recessionary forces that have started to take root? Key challenges to a V-shaped economic recovery relate to consumer attitudes, high unemployment, high levels of corporate debt, and constraints on businesses as we learn to live with COVID-19.
Constrained Consumers
In consumption-driven economies, how feasible is it that individuals will rapidly resume normal spending patterns? Even in China, where draconian measures deemed unacceptable in most Western countries have nearly eliminated the spread of the virus, consumers have been slow to open their wallets (or WeChat Pay and Alipay apps). China’s economic recovery has been concentrated in its industrial sector, investment, and exports, while consumption has trailed—retail sales fell 16% in March and 7% in April, as industrial value added increased 3.9% in April after falling 1.1% in March. Most large economies are driven by consumption, with the United States at roughly 70% of GDP, the euro area and Japan at slightly more than 50%, and the United Kingdom at about 60%. Consumers will remain crowd-averse, even after governments lift restrictions, as long as they perceive the virus as a threat to their safety. As an extreme example, after the September 11 attacks, it took more than a decade for real household spending on airlines to recover to pre-September 11 levels.
High unemployment also presents a challenge, and nowhere has it soared more than in the United States with its flexible labor force. The official unemployment rate of 14.7% would be nearly 19% if it included the 8 million workers who have dropped out of the labor force since February. However, almost 80% of layoffs since March 2020 were reported as temporary, suggesting that companies will rehire workers more quickly, and at a lower cost, than is typical as the economy reopens. Of course, some temporary unemployment will become permanent, with the risk of this increasing the longer business activity remains constrained. Even as consumers return to work, the experience of this recession is likely to boost precautionary savings, pressuring consumption, as is typical following recessions. This effect is likely to be higher this time given the scale of the shock.
Credit Cycle Interrupted?
The flip side of reduced consumption is lower corporate revenues. While governments are providing short-term loans and seeking to bridge funding gaps for corporations, these are short-term measures and cannot prevent companies from going under if the recession lasts beyond the lockdown period. The retail sector, which was under pressure before COVID-19, has already seen some high-profile bankruptcies, and corporate debt in emerging markets is particularly elevated, with much of it denominated in US dollars. Furthermore, companies’ ability to invest may be constrained by the additional debt taken to survive the crisis. While efforts to contain the spread of COVID-19 triggered the recession, the global economy’s high debt levels were a pre-existing condition that could contribute to the recession continuing after the virus fades, especially if economic growth does not snap back quickly.
Medical Progress Versus Uncertainty
Encouraging progress has been made by several pharmaceutical and biotech firms. However, medical experts continue to stress that developing and testing a vaccine and obtaining approval for it in 12 to 18 months would be a remarkable feat. How remarkable? The current record for developing a new vaccine is four years. To receive approval for and manufacture enough quantities of a vaccine for COVID-19 in 12 to 18 months, absolutely everything must go right. It is likely that society will face a second wave of infections prior to wide availability of a vaccine, and it is unclear how severely this resurgence would impact the economy and capital markets.
The good news is that vaccine development has been fast-tracked and, while estimates vary, it appears there are roughly 95 COVID-19 vaccines (and more than 250 therapies) being explored. The high number of vaccines improves the odds considerably—only 10% of drugs to enter clinical trials obtain approval by the Food and Drug Administration. The timeline is accelerated, since much research had been done to address the SARS and MERS outbreaks, which were also caused by coronaviruses. The SARS virus is 80% identical to the virus that causes COVID-19. Furthermore, companies will need to fast track the build-out of factories to produce a potential vaccine at great cost, especially if the effort is unsuccessful. To this end, the Gates Foundation is funding efforts for the seven most promising potential vaccines. The next question, of course, is who will get access to the vaccine first? For example, a vaccine produced in China may not be immediately available in the United States, especially given heightened tensions.
Another encouraging discovery recently published by scientists from the Korean CDC found that individuals who survived COVID-19 and tested positive later were falsely diagnosed and had not been re-infected. The study showed these patients have antibodies that can prevent them from being infected again, and virus samples collected from these patients couldn’t be grown in cultures, indicating that they aren’t capable of transmitting infection. However, we still do not know how long COVID-19 survivors will maintain their immunity and whether that immunity will be partial or complete. A final important question is the degree and nature of coronavirus mutation. Flu viruses mutate over time, limiting the effectiveness of immunity and vaccines and requiring modifications each season. We don’t know whether SARS-CoV-2 mutations will hamper control efforts.
We cannot dismiss the potential for positive surprise. Already, we have seen emergency room doctors improve outcomes and reduce the need for ventilators through experimentation. Research by microbiologists at the University of Hong Kong found that simply wearing surgical masks can reduce transmission by 75%. However, it is difficult to imagine a full economic recovery without an available vaccine or an effective therapy as long as COVID-19 continues to circulate. While various countries have “flattened the curve,” the virus’s circulation requires continued vigilance and constrains businesses and consumers. 2
Fiscally Fine for Now
The monetary and fiscal policy response to the COVID-19 economic crisis has been swift and extraordinary, easily outpacing the response to the 2008 financial crisis. However, the economic contraction is also more severe, secondary and tertiary economic effects are uncertain, and the duration of business closures is another major unknown (with potential for a second wave). Adding to the difficulty of assessing the situation, estimates of the fiscal stimulus amounts by country vary considerably, largely because of varying definitions.
Analysis by BCA Research uses a consistent methodology to break down fiscal policy into “above-the-line” measures (such as direct fiscal spending and tax cuts) and “below-the-line” measures that support businesses through capital injections and loan guarantees. Most measures in Europe fall into the below-the-line category. Such measures are often in the form of credit offered on a conditional basis and are more likely to have negative second-round effects than above-the-line strategies, such as tax cuts, infrastructure investment, and increased unemployment compensation. The chart below reflects BCA’s estimates of above-the-line fiscal measures, boosted by their estimate of the fiscal multiplier on spending (1.1). The figure shows that Japan, Australia, the United States, and China have provided the most aggressive fiscal support relative to the size of their economies.
The purpose of this fiscal spending is to offset the negative effects of closing down economies, preventing otherwise solvent companies from going out of business and keeping households afloat. A reasonable way to evaluate the degree to which countries are meeting this objective is to compare fiscal spending to expected economic contraction. BCA uses three categories based on OECD and Bank for International Settlements estimates of the effect of COVID-19 containment efforts: the direct impact of shutdowns, the spillover effects across economies, and the implications from a second wave of the virus that would result in an additional shutdown.
FISCAL STIMULUS: ENOUGH FOR NOW
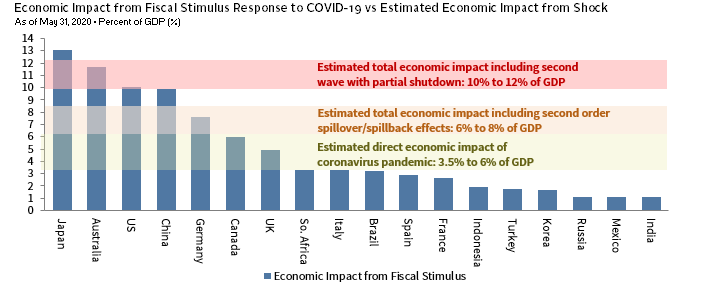
Sources: BCA Research (www.bcaresearch.com) and Goldman Sachs Research.
Notes: All “Economic Impact from Fiscal Stimulus” figures are based on BCA estimates except for Japan; data for Japan’s second supplementary appropriation bill in 2020, which was announced on May 27, are based on Goldman Sachs estimates. The blue bars represent the impact on real GDP from direct fiscal stimulus (excluding loans, guarantees, and non-specific revenue deferrals, and assuming a fiscal multiplier of 1.1x) as estimated by BCA. The yellow shaded area represents the annual real GDP decline in major economies due to direct effects from the coronavirus shock (i.e., the outbreak and the associated lockdowns). This range is based on OECD estimates that assume different impacts on individual economic sectors from a ten-week lockdown. The orange shaded area represents that the cumulative decline in annual real GDP when accounting for the second order effects. The range is based on BIS estimates and reflects how a decline in demand and trade from overseas may affect domestic economic output. The red shaded area represents the cumulative decline in annual real GDP if a second wave of COVID-19 were to emerge in second half 2020. The range is based on BIS estimates and assumes that only a partial lockdown would be required.
Thus far, the fiscal support provided by Japan, Australia, the United States, China, and Germany appears to be sufficient to offset the estimated direct and indirect economic contraction stemming from containment efforts. Other countries, particularly other euro area economies and some emerging markets, are falling short, highlighting the importance of the proposed EU rescue fund and IMF and World Bank support to emerging markets. Outside of Japan and Australia, no major countries are offering fiscal support equal to BIS’s estimated impact from a second wave of the virus; they believe this would increase the blow to GDP to 10%–12%.
As fiscal debt increases as a share of GDP, it may become more difficult for countries to pass legislation allowing increased fiscal support. For now, most major economies are pragmatically providing adequate fiscal support to plug the holes that lockdown policies have created, but that may change if the price tag goes up, especially if an end to the pandemic remains elusive.
Investors should maintain a healthy degree of skepticism about the ability of the global economy and risky assets to manage a V-shaped recovery. While possible, especially if there is a medical breakthrough on a vaccine and/or therapeutics, the burden of proof falls on the optimists. Until there are more positive signs around the ability of business activity to return to normal and of governments to provide adequate policy support for the duration of this pandemic, we maintain neutral positions in risky assets rather than chase the rally.
Monetary Policy–Induced Decoupling?
Monetary policy has been easier to measure and has focused on maintaining liquidity, supporting market function, and facilitating credit creation. However, some strategists put forth the argument that central banks have lowered the discount rate for equities, pushing up their fair value, particularly in the United States where the US Federal Reserve policies helped lower the risk-free rate and credit spreads. J.P. Morgan estimates that Fed actions have lowered the discount rate for US equities by over 100 basis points, offsetting the decline in earnings, assuming they recover lost ground within 1.5 years. We have some sympathy for this argument, but, counter that an extended recovery period for earnings, further shocks that boost the cost of credit, and an increase in the risk premium to compensate for incremental risk of equity over credit could depress equity values even with low risk-free rates. Monetary policy on its own cannot support the rally in equities in the absence of economic recovery.
Into the New Normal
Further complicating the investment picture is the consideration of how our lives will change because of COVID-19. What changes will be permanent and what are temporary shifts that will likely return to the status quo over time? COVID-19 has accelerated several trends that were in development and will surely result in other shifts over time. Most obviously, adoption of technology has accelerated as the global population had a crash course in the ins and outs of ecommerce and virtual meetings. How quickly Zoom became a verb! Business models across sectors are being forced to adapt more rapidly to a digital world. The transition from office healthcare visits to telemedicine and from classroom instruction to distance learning has been remarkable. Demand for improved infrastructure, such as data centers, cell towers, and industrial space, for last-mile deliveries has accelerated. Clear losers in this environment are businesses that do not adapt to these changes. Brick-and-mortar retail establishments without an internet presence were already suffering and are under more pressure today, as are real estate (especially hotel, offices, and retail space) and hospitality/travel services.
Markets, as they are prone to do, will extrapolate such expectations to extremes. We already see such expectations priced into markets as we look at the dominance this year of technology and communication services in the equity markets and of data centers, cell towers, and industrial properties in real asset markets. We can’t help but recall how markets reacted after September 11 with regard to airlines, travel, and high-rise office buildings in major cities, discounting a permanent decrease in demand. Eventually, demand returned as the businesses adapted and the clear and present threat of terrorism faded. We imagine that this will be the case again and are evaluating markets for such overreactions that will provide buying opportunities.
We do not think the market, or the economy will make a V-shaped recovery. This gives us time to carefully evaluate where the opportunities lie. We are doing so across a wide range of asset classes and investment strategies, looking for the most cost-effective means of gaining access to secular themes we think will endure while patiently evaluating opportunities in more distressed areas.
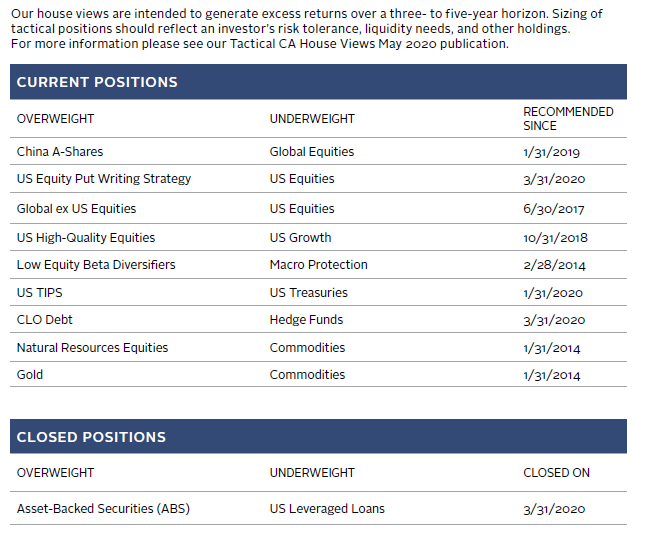
OVERVIEW OF TACTICAL CA HOUSE VIEWS
May 31, 2020
INDEX DISCLOSURES
MSCI US Index
The MSCI US Index is designed to measure the performance of the large- and mid-cap segments of the US market. With 617 constituents, the index covers approximately 85% of the free float–adjusted market capitalization in the United States.
S&P 500 Index
The S&P 500® is widely regarded as the best single gauge of large-cap US equities. There is more than USD 9.9 trillion indexed or benchmarked to the index, with indexed assets comprising approximately USD 3.4 trillion of this total. The index includes 500 leading companies and covers approximately 80% of available market capitalization.
Footnotes
- For example, we could make a strong case that the 2007–08 recession in the United States was L-shaped, not U-shaped. After all, while the recession itself lasted 18 months, it took six years for per capita GDP to return to pre-recession levels, and GDP has not caught up with pre-recession projections of trend economic growth. We evaluate US recession and equity market history for simplicity and because of its relatively long data history.
- Initial data from countries and states that have loosened stay-at-home restrictions over the last two to six weeks have not shown an uptick in transmission rates. This may be due to continued physical distancing or perhaps to a change in the character of the virus.
Celia Dallas - Celia Dallas is the Chief Investment Strategist and a Partner at Cambridge Associates.
About Cambridge Associates
Cambridge Associates is a global investment firm with 50+ years of institutional investing experience. The firm aims to help pension plans, endowments & foundations, healthcare systems, and private clients achieve their investment goals and maximize their impact on the world. Cambridge Associates delivers a range of services, including outsourced CIO, non-discretionary portfolio management, staff extension and alternative asset class mandates. Contact us today.