The Complex Relationship Between Inflation and Asset Prices


It is easy to be cautious about the future. As we write in March 2020, COVID-19 is spreading across much of the world, undercutting economic activity. Many governments are working to offset this loss with monetary and fiscal policies. But with central banks uniquely extended at present, academics and practitioners are actively debating new methods to stimulate. Like others, we are unsure of how this situation will unfold. But we have long believed that the best way to guard against future uncertainty is to have a well-constructed portfolio.
One key component in developing a well-constructed portfolio is understanding the relationship between asset prices and inflation. While it is true that the story of recent years has been the absence of price growth, volatile levels of inflation can erode a portfolio’s real value. For instance, a traditional portfolio invested in US equities and bonds lost nearly 40% of its value from 1972 to 1974 before any spending. This result occurred as the annual inflation rate spiked to double-digit levels.
Using nearly 50 years of data, we estimate the sensitivity of asset prices to inflation, noting that sensitivities have not been stable through time. We discuss the trade-off that has existed between protecting against a sharp short-term change in inflation and protecting against inflation over the long term. We then conclude by highlighting ten lessons that we’ve found helpful. Ultimately, the relationship between asset prices and inflation is unfortunately complex, but a better understanding can inform decision making.
Estimating Asset Sensitivity
Asset prices change as the probability of future cash flows change. In other words, asset prices react more strongly to unexpected news than expected. Consider the impact of an upcoming US manufacturing data release on US equities. A release widely different from market expectations should prompt a sharper US equity price change than a release consistent with expectations. Of course, on any given day, the market is responding to an untold number of events, meaning isolating the impact of one variable is never clean.
This reality is certainly true with inflation. To understand the impact this economic variable has on asset prices, we compiled annual USD total return data from 1973—which roughly coincides with the end of the Bretton Woods system—to 2019 across ten different asset classes. Using multiple linear regression, we compared these annual returns to the US inflation rate at the start of the year and the change in the US inflation rate during the year. This model, whose variables act as proxies for expected and unexpected inflation, results in a better understanding of inflation’s impact than a comparison of returns to just the inflation rate.
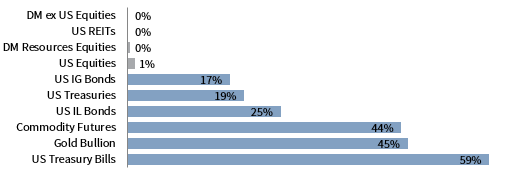
These inflation variables explained more of cash’s performance than any of the other nine asset classes we reviewed (Figure 1). Fully 59% of cash’s performance across our 47-year period was explained in this model. While that may seem underwhelming, considering that this result suggests that 41% of cash’s performance is explained by other factors, it is a meaningful result for a limited model. Take Nobel laureate Robert Shiller’s cyclically adjusted price-to–earnings ratio, for example. It is often compared to subsequent ten-year US equity returns, despite only explaining roughly 40% of the data.
FIGURE 1 PERCENTAGE OF PERFORMANCE EXPLAINED BY INFLATION
1973–2019 • Adjusted R2 Values
Sources: Bloomberg Index Services Limited, FTSE International Limited, London Bullion Market Association, MSCI Inc., National Association of Real Estate Investment Trusts, Standard & Poor’s, Thomson Reuters Datastream, and US Bureau of Labor Statistics. MSCI data provided as is without any express or implied warranties.
Notes: Values are the adjusted R2 values of a multiple linear regression model that relates asset class performance to the change in the inflation rate and the one-year lagged inflation rate. Gray bars highlight models that are not statistically significant at the 5% level.
Beyond cash, our inflation variables explained a statistically meaningful amount of return data for commodity futures, gold, inflation-linked bonds, Treasuries, and investment-grade bonds. In fact, regarding the first two asset classes mentioned, almost half of the performance data was linked to inflation, according to our model. Of the remaining four asset classes, which are US equities, US REITs, international equities, and natural resources equities, no one asset class had a statistically meaningful relationship with this inflation model over this time period.
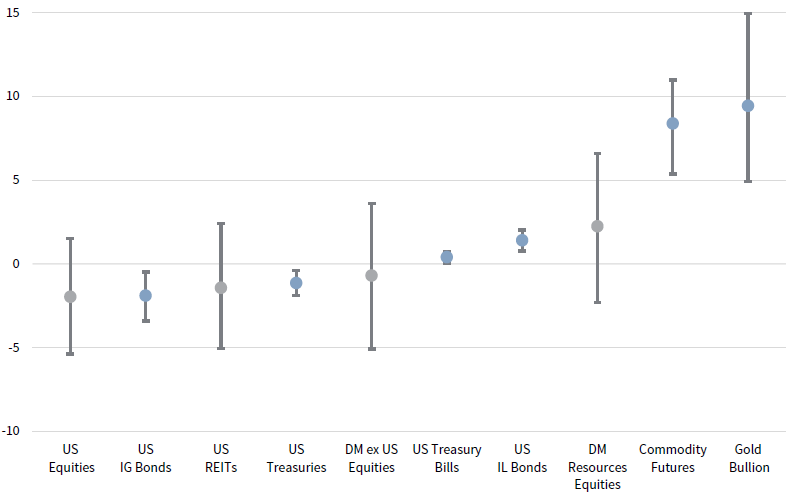
So, understanding that none of these models will perfectly predict returns, which asset classes have been the most sensitive to inflation? Gold and commodity futures top the list (Figure 2). Looking at just gold, a 100 basis point (bp) increase in the inflation rate over one year is estimated to increase performance by 940 bps. However, because these models only partially explain asset returns, we calculated 90% confidence intervals for our sensitivity estimates using a resampling technique. In this specific case for gold, inflation’s impact on returns is expected to be in the range of 490 bps to 1500 bps.
FIGURE 2 SENSITIVITY TO INFLATION RATE CHANGES
1973–2019 • Beta Coefficients with 90% Confidence Intervals
Sources: Bloomberg Index Services Limited, FTSE International Limited, London Bullion Market Association, MSCI Inc., National Association of Real Estate Investment Trusts, Standard & Poor’s, Thomson Reuters Datastream, and US Bureau of Labor Statistics. MSCI data provided as is without any express or implied warranties.
Notes: Values are the beta coefficients for a change in the inflation rate variable, as calculated in a multiple linear regression model that relates asset class performance to the change in the inflation rate and the one-year lagged inflation rate. Gray circles represent betas that are not statistically significant at the 5% levels. Error bars are calculated using a bootleg resampling technique with 10,000 simulations and replacement, and they highlight a 90% confidence interval.
Of the four other asset classes with meaningful relationships to inflation, only two had positive relationships with inflation rate changes. They were inflation-linked bonds and Treasury bills. For the latter, the 0.4 beta is likely related to the lag in time associated between US Federal Reserve policy rate decisions and changes in inflation. The two other asset classes, which were investment-grade bonds and Treasuries, both reacted negatively to changes in the inflation rate. This result makes sense, as higher inflation levels tend to prompt the Fed to raise its policy rate, putting pressure on longer-dated rates and credits.
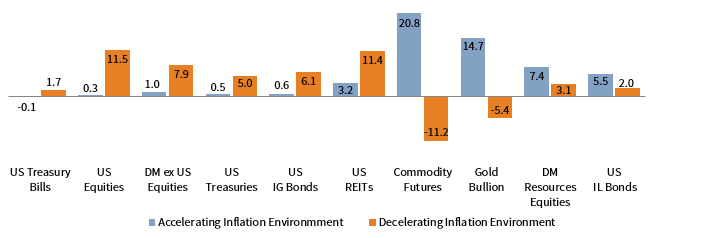
These patterns are also clear when looking at how returns change based on the underlying inflation environment (Figure 3). For example, commodity futures returned an annualized 20.8% in years with positive inflation rate changes in real terms, as compared to a -11.2% in years with negative inflation rate changes. In all, six asset classes performed better when inflation decelerated, including US equities, international equities, and US REITs. The price stickiness of those three asset classes goods and services likely is a key reason behind the differences in performances across the two inflation environments.
FIGURE 3 REAL RETURNS ACROSS DIFFERENT INFLATIONARY ENVIRONMENTS
1973–2019 • Percent (%)
Sources: Bloomberg Index Services Limited, FTSE International Limited, London Bullion Market Association, MSCI Inc., National Association of Real Estate Investment Trusts, Standard & Poor’s, Thomson Reuters Datastream, and US Bureau of Labor Statistics. MSCI data provided as is without any express or implied warranties.
Notes: An accelerating (decelerating) inflation environment is when the annual change in the inflation rate is positive (negative). Returns are adjusted by inflation and geometrically linked across periods.
Time Period Check
To better understand the relationship between our assets and inflation, we divided the 47-year period into two halves and re-analyzed the data. This sanity check helps us gain insight on whether assets respond differently to different types of inflation. For instance, the first period (1973 to 1996) was characterized by an average inflation rate of 5.7%, while the inflation rate of the second period (1997 to 2019) was just 2.1%. Similarly, the volatility [or magnitude] of inflation rate changes shrunk by nearly half from the first period to the second period.
The results of the time period check suggest two nuances are needed. First, many assets that had a meaningful relationship with our inflation model in the first period did not have one in the second period. This was true for US equities, Treasuries, investment-grade bonds, and gold. These assets, which all had negative relationships with inflation in the first period except gold, were seemingly overwhelmed by volatile inflation in the first period. The tame inflation environment of the second period permitted other factors to drive the performances of these assets.
Second, natural resources equities had a meaningful relationship with our inflation model in the second period, but not the first period. We suspect this change over the two periods has less to do with the shift in inflation backdrops than with the declining power of OPEC. For much of the last two decades, OPEC’s total spare capacity remained at low levels, which limited its ability to respond to periods of rapidly rising demand. With a more constrained OPEC, energy equity prices likely have had a closer relationship with oil and, as a result, inflation.
A Sensitivity and Performance Trade-off
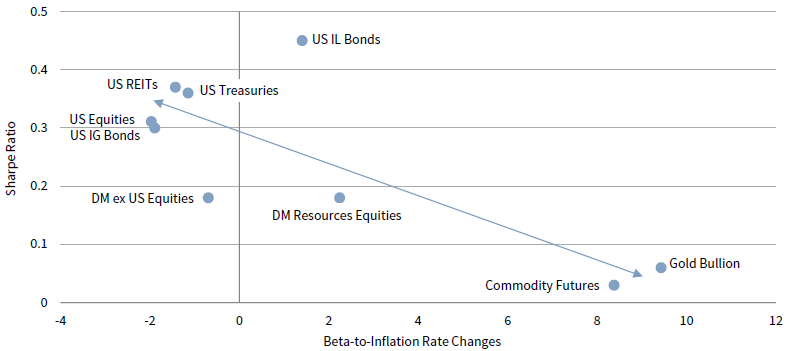
The unfortunate truth about the two most inflation-sensitive assets in our review is that their long-term performance has been terrible. Across the 47-year period, commodity futures and gold returned an annualized 5.6% and 7.0%, respectively, which rank as the lowest two performances besides Treasury bills across the assets in our review. Furthermore, these assets were the most volatile, meaning their risk-adjusted returns were much lower than the other assets. What seems to be clear is that a trade-off between sensitivity to inflation rate changes and risk-adjusted returns exists (Figure 4).
FIGURE 4 RETURNS PER UNIT OF RISK RELATIVE TO SENSITIVITY TO INFLATION RATE CHANGES
1973–2019
Sources: Bloomberg Index Services Limited, FTSE International Limited, London Bullion Market Association, MSCI Inc., National Association of Real Estate Investment Trusts, Standard & Poor’s, Thomson Reuters Datastream, and US Bureau of Labor Statistics. MSCI data provided as is without any express or implied warranties.
Notes: Values are the long-term asset class returns divided by the standard deviation of annual returns relative to beta coefficients for a change in the inflation rate variable, as calculated in a multiple linear regression model that relates asset class performance to the change in the inflation rate and the one-year lagged inflation rate.
This reality makes our jobs as allocators difficult, as it would have been nice if the most sensitive assets to inflation rate changes were also strong performers. C’est la vie… So, what’s behind this trade-off? Well, there are many reasons. One often mentioned is that commodities have no cash flow, making returns totally dependent on entry and exit prices. In contrast, companies use internally generated cash flow and debt to improve their operations, making their equities more valuable. Many works have highlighted this distinction.
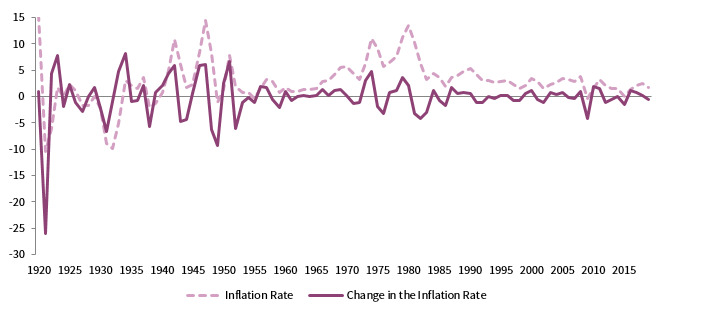
Additionally, annual changes in the inflation rate are mean reverting (Figure 5). Said differently, our proxy for the level of unexpected inflation varies around one number, which in this case is zero. In fact, over the last 100 years, there have been 52 years in which the inflation rate change was positive and 48 when it was zero or negative, with both groupings having similar average magnitudes. This suggests that the price pressure on assets stemming from annual changes in the inflation rate hasn’t been overly skewed in one direction.
FIGURE 5 US INFLATION
1920–2019 • Percent (%)
Sources: Thomson Reuters Datastream and US Bureau of Labor Statistics.
This fact leads to another shortcoming of commodity futures and gold. The time it has taken for the annual change in the inflation rate to mean revert (switching from positive to negative or vice versa) has been swift. It has averaged just two years across the last century. Also, the longest periods of accelerating inflation we’ve witnessed was one stretch of six years and three stretches of four years. In other words, there have been few multi-year periods where inflation was consistently putting upward pressure on commodity futures and gold prices.
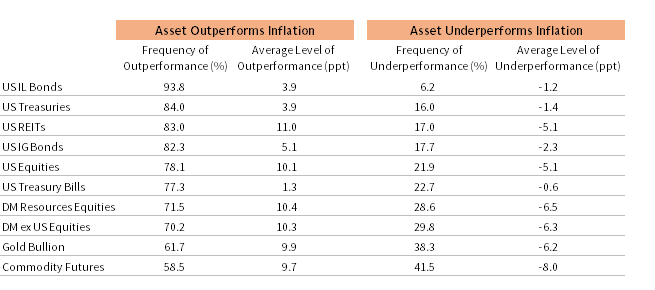
So, what assets hold the most promise to protect against inflation over the long-term? To think about that question, we used a statistical procedure in which we randomly sampled five individual years of data from our original 47-year dataset and compared asset performances over the full five-year period to inflation. We repeated the sampling 1,000 times, comparing returns to price levels in each sample. While this approach has its weaknesses—including the assumption that future return patterns will resemble prior return patterns—it gives us one lens to view the probability of an asset class outperforming inflation over a long-time horizon.
The results are striking (Figure 6). Inflation-linked bonds led, outperforming inflation 93.8% of the 1,000 samples, with the other fixed income assets bunched in the top half. Equity assets followed. While these assets were generally less consistent than the fixed income assets, their average levels of outperformance were higher. For instance, when REITs outperformed inflation, they did so by an average of 11.0 percentage points (ppts). Commodity futures and gold were the least consistent performers, with the former underperforming inflation 41.5% of the time by an average of 8.0 ppts.
FIGURE 6 ASSET PERFORMANCE RELATIVE TO INFLATION OVER FIVE-YEAR PERIODS
Resampled Data 1973–2019
Sources: Bloomberg Index Services Limited, FTSE International Limited, London Bullion Market Association, MSCI Inc., National Association of Real Estate Investment Trusts, Standard & Poor’s, Thomson Reuters Datastream, and US Bureau of Labor Statistics. MSCI data provided as is without any express or implied warranties.
Notes: Data summarizes 1,000 random samples of five years of annual data between 1973 to 2019. Each sample compares the total asset performance over the five-year period to how much price levels change. The average level of outperformance is cumulative across the full five-year period.
Energy Landscape
One phenomenon that is likely to impact inflation’s relationship to both commodity futures and natural resources equities is the changing energy landscape. By 2050, renewable energy is expected to displace petroleum as the most widely used global energy source, accounting for more than a quarter of all energy consumption, according to a recent US government forecast (Figure 7). What is notable is that this forecast simply extrapolates current trends forward. It assumes no regulatory changes or technological breakthroughs. So, if current trends accelerate, emissions regulations strengthen, or technological progress occurs, these forecasts may understate the impact.
FIGURE 7 GLOBAL PRIMARY ENERGY CONSUMPTION
As of January 2020 • US EIA Reference Case Forecasts • Percent (%) of Total
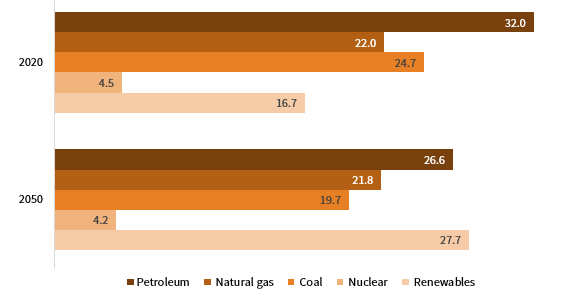
Source: US Energy Information Administration.
A fair response to this argument is that even though renewable energy may grow dramatically, petroleum and natural gas will still be needed, at least for some period of time. Indeed, the same US government forecast suggests that petroleum and natural gas consumption in 2050 will be larger than today by 19% and 40%, respectively. Global energy demand is just growing so swiftly that even the considerable growth expected in renewable supply cannot satisfy a wealthier and more crowded planet. In any case, the energy mix is much more diverse today than during the years we reviewed.
This suggests that the contribution of energy price changes to future inflation levels will be less dependent on oil prices than in years past. Even the role oil prices do play may be less volatile going forward, given the deflationary impact of recent technological advancements. Specifically, horizontal drilling and fracking has allowed for new oil supplies from US shale basins to be brought online far more quickly than any other market historically. Coupled with the fact that these basins are some of the cheapest sources of new oil volumes globally, producers in these plays can more easily calibrate production to meet demand, which should act to moderate oil price volatility.
Private Investments
Private investments were not included in the study because of a desire to review data over a common period and with a sufficiently long history. Still, these investments’ relationships with inflation should be somewhat similar to their equivalent public market. For example, private property’s relationship with inflation should be more similar to REITs than other assets we reviewed. There are two caveats worth mentioning.First, the smoothed nature of private investment returns will temper their apparent sensitivity to annual changes in the inflation rate. Second, private investments illiquidity means they cannot (or really should not) be relied on as a source of funds during a spike in inflation that depresses bond and equity markets.
A Well-Constructed Portfolio
Predicting the future path of inflation is notoriously difficult;just ask any economist. The best protection against future uncertainty is a well-constructed portfolio, tailored to meet the asset owner’s risk tolerance, portfolio objectives, and spending needs. While there are trade-offs associated with all solutions to protect a portfolio against inflation, below are ten final thoughts we’ve come to appreciate:
- The drivers of asset performance and inflation vary through time, meaning the link between them should not be thought of as stable.
- There is a difference between protecting against changes in the inflation rate and protecting against inflation over the long term.
- Long stretches of positive changes in the annual inflation rate have been rare.
- Commodity futures and gold have had a positive relationship with changes in the inflation rate, but these assets have performed poorly over the long term.
- Treasuries and investment-grade bonds have had a negative relationship with changes in the inflation rate, particularly when inflation volatility was high.
- The changing energy landscape is likely to blunt the sensitivity of hydrocarbon-heavy commodity futures and natural resources equites to changes in the inflation rate.
- Private investments’ illiquidity means they should not be relied on as a source of funds during a sharp change in the inflation rate.
- Equities and bonds have been more helpful in guarding against inflation over the long-term than many assume.
- Inflation-linked bonds and REITs have added protection to a portfolio of equities and bonds over the long term.
- Holding a diversified pool of assets to guard against inflation will likely lead to be better long-term outcomes than an undiversified pool.
Kevin Rosenbaum, Deputy Head of Capital Markets Research
Methodology Note
The index returns used in this study are all in USD terms and based on the following: S&P 500 TR Index (US Equities); MSCI EAFE TR Index (DM ex US Equities); Bloomberg Barclays US Treasury TR Index (US Treasuries); Federal Reserve 3 Month TR Index (US Treasury Bills); Bloomberg Barclays US Corporate Investment Grade TR Index (US IG Bonds); Simulated ten-year duration inflation-linked bond returns from 1973 to 1996, courtesy of Bridgewater Associates, and the Bloomberg Barclays US TIPs TR Index from 1997 to 2018 (US IL Bonds); S&P GSCI TR™ Index (Commodity Futures); FTSE / NAREIT Equity TR Index (US REITs); London Bullion Market Association Gold Price (AM) (Gold Bullion); Thomson Reuters Developed Market Natural Resource TR Index (DM Resource Equites). Inflation reflects US CPI – All Urban Items data.
Index Disclosures
Bloomberg Barclays US Corporate Index
The Bloomberg Barclays US Corporate Bond Index measures the investment-grade, fixed-rate, taxable corporate bond market. It includes USD-denominated securities publicly issued by US and non-US industrial, utility, and financial issuers. The US Corporate Index is a component of the US Credit and US Aggregate Indices, and provided the necessary inclusion rules are met, US Corporate Index securities also contribute to the multi-currency Global Aggregate Index. The index was launched in July 1973, with index history backfilled to January 1, 1973.
Bloomberg Barclays US Treasury Bond Index
The Bloomberg Barclays US Treasury Bond Index includes public obligations of the US Treasury (i.e., US government bonds). Certain Treasury bills are excluded by a maturity constraint. In addition, certain special issues, such as state and local government series bonds (SLGs), as well as US Treasury TIPS, are excluded.
Bloomberg Barclays US Treasury Inflation-Linked Bond Index
The Bloomberg Barclays US Treasury Inflation-Linked Bond Index (Series-L) measures the performance of the US Treasury Inflation Protected Securities (TIPS) market. Federal Reserve holdings of US TIPS are not index eligible and are excluded from the face amount outstanding of each bond in the index.
Federal Reserve Three-Month Treasury Bill Index
The Three-Month Treasury Bill Rate is the yield received for investing in a government issued treasury security that has a maturity of three months. The three-month Treasury yield is included on the shorter end of the yield curve and is important when looking at the overall US economy. The three-month Treasury yield hovered near 0 from 2009 to 2015 as the Federal Reserve maintained its benchmark rates at 0 in the aftermath of the Great Recession.
FTSE/NAREIT All Equity REITs Index
The FTSE NAREIT All Equity REITs Index is a free float–adjusted, market capitalization–weighted index of US equity REITs. Constituents of the index include all tax-qualified REITs with more than 50% of total assets in qualifying real estate assets other than mortgages secured by real property.
MSCI EAFE Index
The MSCI EAFE Index is an equity index which captures large- and mid-cap representation across 21 developed markets countries around the world, excluding the United States and Canada. Developed markets countries in the MSCI EAFE Index include: Australia, Austria, Belgium, Denmark, Finland, France, Germany, Hong Kong, Ireland, Israel, Italy, Japan, the Netherlands, New Zealand, Norway, Portugal, Singapore, Spain, Sweden, Switzerland, and the United Kingdom. With 918 constituents, the index covers approximately 85% of the free float–adjusted market capitalization in each country.
S&P 500 Index
The S&P 500 Index measures the stock performance of 500 large companies listed on stock exchanges in the United States. The S&P 500 is a capitalization-weighted index and the performance of the ten largest companies in the index account for 21.8% of the performance of the index. The average annual total return of the index, including dividends, since inception in 1926 has been 9.8%; however, there were several years where the index declined more than 30%.
S&P GSCI™ Total Return Index
The S&P GSCI™ is designed as a benchmark for investment in the commodity markets and as a measure of commodity market performance over time. The S&P GSCI™ is calculated primarily on a world production-weighted basis and comprises the principal physical commodities that are the subject of active, liquid futures markets. There is no limit on the number of contracts that may be included in the S&P GSCI™; any contract that satisfies the eligibility criteria and the other conditions specified in this methodology are included. The S&P GSCI™ Total Return Index is composed of the principal physical commodities futures contracts.
Kevin Rosenbaum, CFA, CAIA - Kevin Rosenbaum is Head of Global Capital Markets Research and Investment Communications at Cambridge Associates.
About Cambridge Associates
Cambridge Associates is a global investment firm with 50+ years of institutional investing experience. The firm aims to help pension plans, endowments & foundations, healthcare systems, and private clients achieve their investment goals and maximize their impact on the world. Cambridge Associates delivers a range of services, including outsourced CIO, non-discretionary portfolio management, staff extension and alternative asset class mandates. Contact us today.