Pension Risk Transfers Have Several Downside Risks for US Plan Sponsors


Pension Risk Transfers (PRTs), including the increasingly popular partial annuity purchase, are a set of tools used frequently by US plan sponsors to de-risk their pension plans. These transactions are intended to lower the risk and cost of the plan by shrinking its size. However, in many cases, they may achieve the opposite result. Specifically, their use can lead to a lower funded status, particularly for underfunded plans. Perhaps even more troubling, while PRTs reduce costs via short-term fee savings, the additional underfunding resulting from these transactions can cause higher fees and premiums over the long run. While the past decade offered some additional incentives to perform these transactions, these have since disappeared or have been fully extracted. Yet, despite these shortcomings, PRTs continue to be adopted by plan sponsors at a surprising rate.
Managing liability risk is an important part of successful pension plan management, and for plans that are overfunded (or perhaps under the Pension Benefit Guaranty Corporation Variable Rate Premium [PBGC VRP] cap 1 ), PRTs may offer a cost-effective solution if the PRT is engaged prudently. However, for many plans, a better option lies within the asset allocation and in tailoring portfolio strategy to effectively navigate liability-specific risks and market conditions. Sponsors should fully understand the potential impact of a risk transfer transaction on their plan, specifically as it relates to three dimensions explored in this paper: funded status, risk reduction, and future costs. Without this understanding, the hidden cost of these transactions may go unnoticed.
Some Historical Context
PRTs have become more prevalent with plan sponsors since 2010 for several reasons:
PBGC PREMIUMS. Through the Moving Ahead for Progress in the 21st Century Act (MAP-21) funding relief, premiums have been steadily rising, with increases of nearly 200% per participant over the past ten years. Finding a way to reduce these costs has led many to believe PRTs are a solution.
PENSION PROTECTION ACT OF 2006. Starting around the time of the Global Financial Crisis, plan sponsors were required to disclose their pension shortfall on their balance sheet. The Pension Protection Act of 2006 put greater pressure on corporations to maintain healthy funded status at a time when doing so was particularly challenging. This led to a desire to move away from defined benefit plans for employees’ retirement needs.
INSURER PRICING. For various reasons, including increased competition, enhanced purchasing efficiencies, and the appeal of pension liabilities as a hedge against insurers’ own books of business, pricing has continued to become more favorable. This has reduced costs for plan sponsors wishing to transfer liabilities to an insurance company.
TRANSACTION INCENTIVES. Service providers in this space have financial incentives to continue deal making and have used the concepts above to adeptly sell PRTs. Furthermore, for those sponsors that bundle their service providers, the objective opinion of independent advisors may be lost.
The four main styles of PRT are buyouts, buy-ins, lump sum offerings, and partial annuity purchases. 2 As a group, and despite a greatly improved market environment since 2010, PRTs have become increasingly popular as evidenced by the total deal size over the past decade (Figure 1). 3

For many plan sponsors, the idea of reducing their plan size for purposes of PBGC premium savings and having a net zero impact on the balance sheet have made using a PRT a popular way to achieve near-term savings. But all of this comes at a cost.
Weighing Plan-Specific PRT Consequences
Pension plans come in all different shapes, sizes, and funded levels, and the specific risk tolerances of the sponsors that fund their employees’ benefits likewise greatly vary. Their frequent use has put PRT transactions top of mind for sponsors wishing to take steps to de-risk. Before implementing a transfer, however, all sponsors should carefully explore the implications in terms of funded status, risk reduction, and future costs for their plan.
Funded Status
While a PRT transaction can reduce PBGC premiums in the short term, two of the most overlooked downsides are the impact on funded status and long-term PBGC premiums. Figure 2 depicts the effects of a PRT on two sample plans; one 85% funded and the other 100% funded. For both plans, the results of two transaction alternatives are calculated. Option one involves a smaller annuity purchase, one that annuitizes 40% of the plan’s retirees with a $3.0 million gain, while option two annuitizes all the retirees at par. 4 Both transactions assume highly competitive pricing, so as to provide a “best-case scenario” for these transactions.
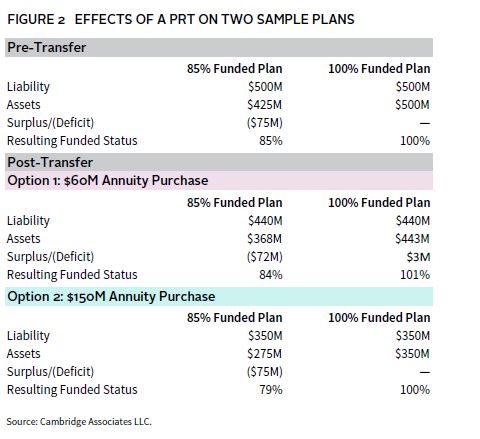
A partial annuity purchase can negatively impact funded status for an underfunded plan, even if the amount of assets transferred is less than the liability (a gain to the plan). This could amount to a 1% decrease for smaller purchases, or a 6% decrease for larger ones. The inverse relationship is true for overfunded plans; these risk transfers would increase funded status, which can assist a plan in decreasing risk and PBGC premiums. Regardless of funded status, the question remains as to whether the PRT is worthwhile on an after-fee, long-term benefit basis.
Risk Reduction
Typically, reducing risk means managing the funded status from the perspective of a downside market scenario, such as what occurred during the emergence of the COVID-19 pandemic. Imagine that a plan sponsor with the 85% funded pension plan described in Figure 2 had the foresight to consider reducing risk and contemplated either a small or large partial annuity purchase on December 31, 2019. How would that plan have performed during the start of the COVID-19 crisis and the ensuing rally? Figure 3 depicts the outcome of this sample plan from before the crisis to 15 months later.
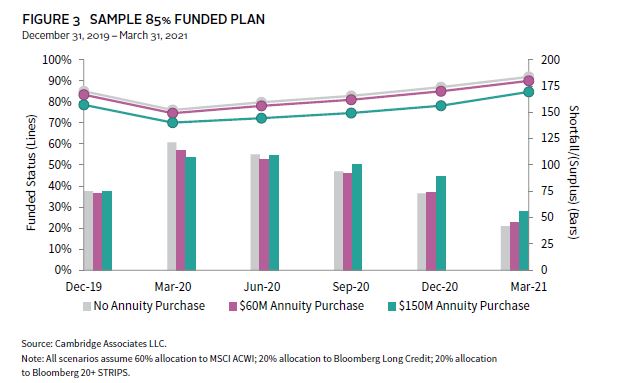
Over the course of first quarter 2020, the plan was able to protect capital by implementing a PRT transaction, but any value was gone within a quarter. A year later, the highest surplus would have resulted if no annuity purchase took place. If we continue this analysis to today, the results would be clear—no annuity purchase would achieve the best possible outcome.
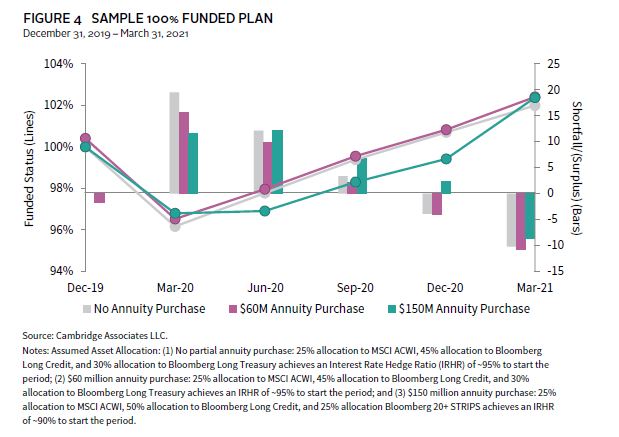
A different outcome would occur for a 100% funded plan, per Figure 4. Not only does the annuity purchase help protect funded status during the shock event as the plan had less equities, but it also results in a similar funded status at the end of the period. This is because the plan had fewer assets dedicated to growth strategies when equities fell. Therefore, this well-funded plan did achieve meaningful risk reduction over the short term, without meaningfully harming future returns.
However, three notes of caution bear emphasis for well-funded plans considering a risk transfer:
- If the remaining plan population were to have a very high duration (e.g., 18 years), a PRT would introduce idiosyncratic risk as the duration of investment-grade long credit is markedly shorter at around 14 years;
- If a plan were to transfer most, or all, of its retirees and within a few years attempt to fully terminate the plan by purchasing annuities for the remaining population, the insurer pricing would be very poor as the less risky participants were already bought out; and
- If a large annuity purchase is facilitated by a transfer of credit/corporate bonds, called an asset-in-kind transfer, it could leave the remaining fixed income portfolio sub-par and cause poor future performance.
Therefore, if you maintain a plan that is more than 100% funded and considering a PRT, ensure you have done a full review of the post-transaction risk and ensuing return.
Future Costs
The counterargument to the example above is that the pandemic-related market crisis and recovery played out over a very short period. Many believe that a partial annuity purchase results in a cost reduction to the plan due to lower PBGC premiums. While this is generally true in the short term, over a long-term period and under most scenarios, plans will have to pay higher PBGC premiums. This phenomenon is ultimately related to the decrease in funded status that occurs from the transfer event—a decrease that persists over time.
Figure 5 projects the path of the same 85% funded plan again, with and without the PRTs, assuming a 6% return over ten years. The outcome largely remains the same—initial impact is minimal, but over time, the projected returns increase funded status and decrease shortfalls.
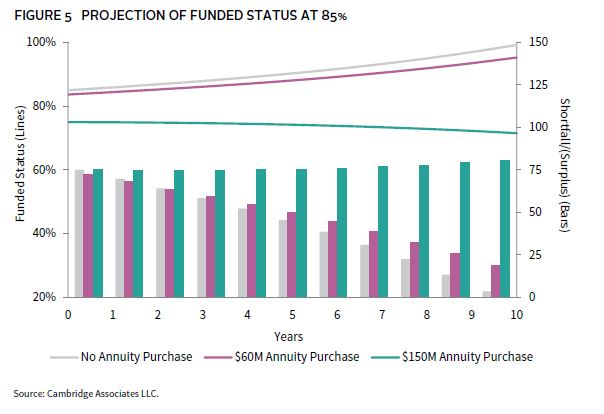
This analysis highlights two particularly intriguing points. First, the large annuity purchase benefits from hitting the PBGC VRP cap, saving the plan a total of $600,000 in year 1 from PBGC premiums. However, this benefit does not outweigh the impact of asset returns. By the end of the period, the shortfall and funded status are worse than at the beginning. Second, by the end of the period, the “no annuity purchase” plan has consequently realized such a funded status improvement that its PBGC premiums are lower. Total premiums are $11.9 million lower over the ten-year period (Figure 6).
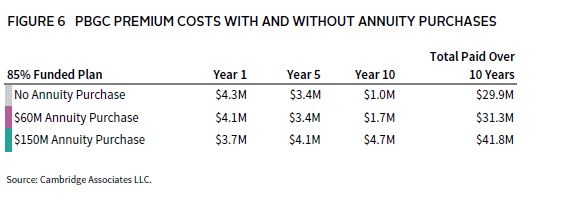
In summary, all else equal, any short-term PBGC premium savings do not appear to be worth the cost of the decrease in funded status, as higher PBGC premiums are likely to result over time.
Is There a Better Way?
For plan sponsors exploring ways to de-risk their pension plans, a more flexible solution is to instead concentrate efforts on managing risk from an asset allocation perspective. Some ways to manage pension risk while benefiting from investing in the market include:
- Diversifying risk premia across growth asset classes, including—but not limited to—global equities, high-yield bonds, real assets, hedge funds, private equity, and private credit;
- Managing the beta of the portfolio to an appropriate level of risk and excess return over the liabilities;
- Focusing on asset classes with higher alpha generation properties; and
- Employing a thoughtful liability-driven investing design that uses an optimal blend of credit and treasury securities and capital-efficient asset classes to optimize interest rate and credit spread hedge ratios.
Any of the above strategies can be tailored to achieve both greater risk reduction and potentially larger cost savings than a PRT transaction can provide. The overall concept is to use the current assets in the portfolio to achieve fully funded status as quickly and prudently as possible. This allows for greater PBGC premium savings and faster achievement of end-state objectives.
Conclusion
The PRT market has grown markedly over the past decade as recent regulatory changes, coupled with greater pricing competition from insurers, have increased the popularity of PRTs. These strategies offer no silver bullet though, and especially for plans that are not fully funded, the case for them seems murky at best. Certainly for plan sponsors wishing to fully terminate a plan, a risk transfer is necessary and—if the sponsor fully understands the cost of this transaction—will result in ultimate risk reduction as the pension liabilities are permanently removed from the company’s balance sheet. For other plan sponsor situations and objectives, however, caution and thorough evaluation is advised.
Completing a PRT for an underfunded plan will more likely be at the detriment of a plan sponsor’s goal of achieving a fully funded plan. For more well-funded plans, a one-time partial annuity purchase for participants that either are preferred by insurers or receive small benefits has value-add potential. However, continually performing these transactions or settling all retirees only diminishes this value and could hinder future opportunities.
Ultimately, most plan sponsors would be better served by maximizing plan return potential through both alpha and beta sources. For those seeking to reduce risk, this can be achieved by concentrating on the proportion of risky assets in their plan, coupled with optimally hedging the liabilities in the plan; after all, even a 5% adjustment from equities to fixed income can achieve the same risk reduction as a PRT.
Having an independent voice in the room can provide valuable perspectives for sponsors. In a world of bundled solutions where many service providers are financially incentivized to complete these transactions, this dissenting opinion may get lost. So, before moving forward with a PRT, plan sponsors should ask themselves: (1) What is the ensuing funded status after the transfer? (2) What is the change to the risk/return profile after the transfer? and (3) Where will we be in five years, under various return assumptions, with and without a PRT?
Index Disclosures
Bloomberg US STRIPS 20+ Year Index
The Bloomberg US STRIPS 20+ Year Index measures the performance of US Treasury STRIPS (Separate Trading of Registered Interest and Principal of Securities) with a maturity of 20 years or more.
Bloomberg US Long Credit Index
The Bloomberg US Long Credit Index represents long-term corporate bonds. It measures the performance of the long-term sector of the United States investment-bond market, which, as defined by the Long Credit Index, includes investment-grade corporate debt and sovereign, supranational, local-authority, and non-US agency bonds that are dollar denominated and have a remaining maturity of greater than or equal to ten years.
Bloomberg US Long Treasury Index
The Bloomberg US Long Treasury Index measures the performance of US dollar-denominated, fixed-rate, nominal debt issued by the US Treasury with a maturity greater than 10 years. STRIPS are excluded from the index because their inclusion would result in double-counting. The US Treasury Index is a component of the US Aggregate, US Universal, Global Aggregate, and Global Treasury indexes. The US Long Treasury Index has history back to January 1, 1973.
MSCI All Country World Index
The MSCI ACWI is a free float–adjusted, market capitalization–weighted index designed to measure the equity market performance of the full opportunity set of large- and mid-cap stocks across 23 developed and 25 emerging markets. It covers more than 2,900 constituents across 11 sectors and approximately 85% of the free float–adjusted market capitalization in each market. The developed markets country indexes included are: Australia, Austria, Belgium, Canada, Denmark, Finland, France, Germany, Hong Kong, Ireland, Israel, Italy, Japan, the Netherlands, New Zealand, Norway, Portugal, Singapore, Spain, Sweden, Switzerland, the United Kingdom, and the United States. The emerging markets country indexes included are: Brazil, Chile, China, Colombia, Czech Republic, Egypt, Greece, Hungary, India, Indonesia, Korea, Kuwait, Malaysia, Mexico, Peru, the Philippines, Poland, Qatar, Russia (Russia will be removed from all MSCI indexes as of the close on March 9, 2022), Saudi Arabia, South Africa, Taiwan, Thailand, Turkey, and the United Arab Emirates.
Footnotes
- The PBGC charges a premium based on the underfunding of the plan (4.8% of any unfunded liability for the 2022 plan year). However, the PBGC also limits the total on this variable rate premium through the Variable Rate Premium cap. For 2022, a plan sponsor will not be required to pay more than $598 per participant.
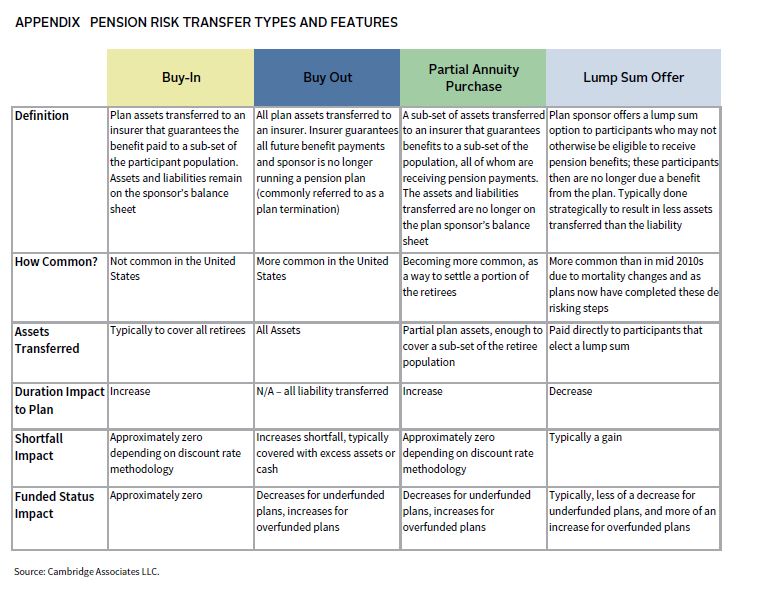
- Please see Appendix for a complete description of these styles.
- Total deal size has increased year-over-year, except for 2012, which saw the arrival of two very large annuity transfers by GM and Verizon, sparking interest throughout the marketplace.
- We have assumed the liabilities are $500 million and the retiree population is 40% of the total liability with a duration of eight years, while the remaining population has a duration of 15 years.
Serge Agres, CFA, FSA, EA - Serge Agres is a Managing Director and Investment Actuary at Cambridge Associates.
About Cambridge Associates
Cambridge Associates is a global investment firm with 50+ years of institutional investing experience. The firm aims to help pension plans, endowments & foundations, healthcare systems, and private clients achieve their investment goals and maximize their impact on the world. Cambridge Associates delivers a range of services, including outsourced CIO, non-discretionary portfolio management, staff extension and alternative asset class mandates. Contact us today.