Life After Zero: Reassessing the Role of Sovereign Bonds with Negative Nominal Yields


Most investors with broadly diversified portfolios maintain small allocations to safe-haven assets as a form of “insurance” during periods of market stress. Safe havens provide portfolio ballast and allow investors to rebalance, meet liquidity needs, and take advantage of investment opportunities while markets stabilize. Several assets serve as traditional safe havens, Cambridge Associates and most other advisors have long recommended that clients primarily use high-quality sovereign bonds to fulfill this role. But, negative nominal yields challenge this orthodoxy.
Negative nominal yields reduce the intermediate- to long-term return prospects of high-quality sovereign bonds, increase their opportunity cost, and may even limit their upside during periods of market stress. Investors in Japanese and many European sovereign bond markets have had to grapple with the issue of negative yields for some time, but in recent weeks, as the COVID-19 pandemic has moved beyond China’s borders and rapidly spread across the globe, nominal high-quality sovereign bond yields throughout developed markets have plummeted toward zero. It is becoming increasingly likely that most developed markets may soon need to contend with negative yields, leading investors to question whether high-quality sovereign bonds are still the best form of insurance.
In light of these developments, this paper examines the historical safe-haven characteristics of high-quality sovereign bonds and assesses whether they remain a viable safe-haven asset when nominal yields are negative. The notion of locking negative returns from negative yielding sovereign bonds into portfolios can be a psychological barrier, but from a starting point of today, we believe high-quality sovereign bonds still have a role to play in providing portfolio ballast in most broadly diversified portfolios. However, while it may be premature to shun high-quality sovereign bonds at this time, it would be prudent for investors to begin exploring alternative insurance options, to understand their trade-offs and determine whether it makes sense to adjust or replace high-quality sovereign bond allocations in preparation for life after zero.
The Rise of Negative Nominal Yields
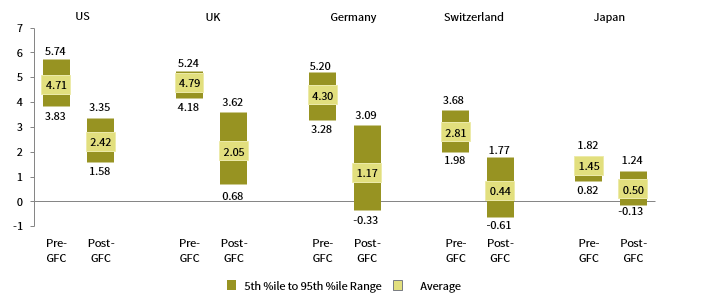
There are several perceived causes of extremely low or negative bond yields, 1 but the unprecedented monetary policy measures many major central banks adopted in the wake of the 2007–09 global financial crisis (GFC) are clearly contributing. These measures include negative interest rate policies (NIRP), quantitative easing (QE), and yield curve control (YCC). These policies put downward pressure on high-quality sovereign bond yields. Furthermore, central banks’ inability to unwind them amid the sluggish real growth and low-inflation environment following the GFC has contributed to yields remaining lower for longer. Nominal ten-year sovereign bond yields in most developed markets have traded well below their pre-GFC trading range this cycle (Figure 1).
FIGURE 1 RANGE OF SELECT 10-YR SOVEREIGN BOND YIELDS PRE- AND POST-GFC
January 1, 2000 – March 31, 2020 • Yield (%)
Source: Thomson Reuters Datastream.
Notes: Data are daily. The pre-GFC range spans from January 2000 through November 2007 (up to the start of the GFC), and the post-GFC range starts after the end the GFC (July 2009) and goes through the present. The chart excludes data during the GFC (December 2007 to June 2009). The maximum and minimum values for each range are the 95th and 5th percentile values.
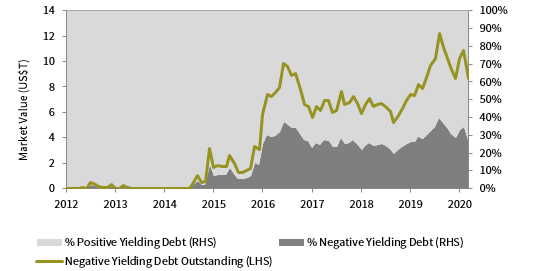
One consequence of high-quality sovereign bond yields remaining lower for longer is that they have less room to decline before hitting zero during periods of market stress. As a result, we’ve witnessed the stock of negative yielding government debt surge during recent periods of economic weakness, such as in 2016, 2019, and most recently, in early March 2020 following the COVID-19 outbreak. Yields reached new extremes in March 2020. At one point, the entire German and Swiss sovereign bond yield curves turned negative, yields on UK gilts with maturities of up to seven years briefly fell below zero for the first time ever, US Treasury Bill yields dipped below zero, and ten-year and 30-year US Treasury yields touched new record lows of 0.3% and 0.7%, respectively, intra-day. Today, nominal yields on high-quality sovereign bonds remain near their record lows and 28% of outstanding developed markets sovereign bonds offer negative yields—still elevated, but below the 40% peak level in August 2019 (Figure 2).
FIGURE 2 BREAKDOWN OF BLOOMBERG BARCLAYS GLOBAL TREASURY INDEX: POSITIVE VS NEGATIVE YIELDING DEBT
January 31, 2012 – March 31, 2020
Source: Bloomberg Index Services Limited.
While negative yields remain concentrated in regions with NIRPs (Europe and Japan), bond yields look more likely than ever to swing negative in other developed markets, especially if COVID-19’s economic impact turns out to be more severe and prolonged than expected. Central banks have already responded to the anticipated economic disruption from COVID-19 by cutting their monetary policy rates to zero (if they weren’t already negative) and committing to large-scale asset purchases for the foreseeable future. If the economic shock’s depth and length demands even more monetary stimulus than is currently planned, then central banks that have previously resisted NIRPs, including the US Federal Reserve and Bank of England, may be forced to reconsider. Even if these central banks keep policy rates positive, the monetary policy alternatives (e.g., more QE and/or YCC) should keep high-quality sovereign bond yields well anchored around zero in the near term, increasing the probability that nominal yields in these countries could become slightly negative in future risk-off markets even without monetary policy rates moving below zero. Therefore, now is as good a time as ever for investors to re-evaluate the safe-haven status of high-quality sovereign bonds.
The Case for Sovereign Bonds Before and After Negative Nominal Yields
Three key benefits of high-quality sovereign bonds have bolstered their long-standing position as safe-haven assets: (1) persistent liquidity; (2) steady income; and (3) a tendency to appreciate when equities struggle, especially over the last 30 years.
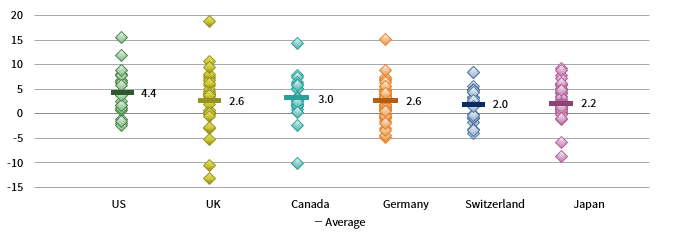
Consider the historical case for ten-year US Treasuries (Figure 3). Since 1990, US equity markets have experienced 23 price corrections greater than or equal to -10%. During these periods, nominal yields on ten-year US Treasuries declined by an average of 40 basis points (bps) and they delivered an average cumulative return of 4.4% (bond prices rise when yields fall). In some instances, returns were significantly higher; ten-year US Treasuries returned 11.8% during a six-month period at the onset of the GFC and 15.5% over five months during the height of the European Sovereign Debt Crisis. US Treasury returns haven’t always been positive during past equity market corrections, but returns were negative during only four of the total 23 US equity market corrections since 1990, with an average loss of just 1.7%. Beyond a few outliers, this pattern has been observed across many major developed markets. Even in markets where nominal yields have been lower for longer, such as in Japan, sovereign bonds have consistently provided portfolio ballast during local equity market corrections; ten-year Japanese sovereign bonds have offered positive returns during 86% of 50 Japanese equity market corrections since 1990.
FIGURE 3 10-YR SOVEREIGN BOND RETURNS DURING COUNTRY-SPECIFIC EQUITY MARKET CORRECTIONS
1990–2020 • Percent (%) • Local Currency
Sources: Deutsche Börse Group, FTSE International Limited, MSCI Inc., Ned Davis Research, Inc., Nikkei Inc., Thomson Reuters Datastream, and Standard & Poor’s. MSCI data provided as is without any express or implied warranties.
Notes: Data for 2020 are through March 23. Most recent data points assume lows reached in late March 2020 represent respective bear market bottoms. Bear markets defined as equity declines of greater than 10% peak to trough. Equity indexes used to calculate equity bear markets are represented by S&P 500 Index (US), FTSE® 100 Index (UK), MSCI Canada Index (Canada), DAX Index (Germany), MSCI Switzerland Index (Switzerland), and Nikkei 225 Index (Japan).
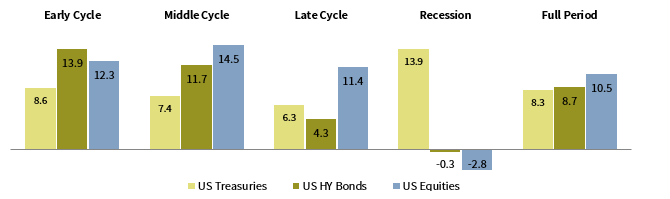
Yet, holding high-quality sovereign bonds has always necessitated trade-offs, particularly the opportunity cost versus higher-returning risk assets over the full cycle. Over the past five economic cycles, US Treasuries have significantly outperformed US high-yield corporate bonds and US equities during US recessions but have lagged over the course of a full cycle (Figure 4).
FIGURE 4 ANNUALIZED RETURNS ACROSS LAST FIVE FULL ECONOMIC CYCLES
AACR (%) • Local Currency
Sources: Bloomberg Index Services Limited, MSCI Inc. and Thomson Reuters Datastream. MSCI data provided “as is” without any express or implied warranties.
Notes: Data reflect the annualized value of geometrically linked monthly total returns across different economic environments. Recessions reflect National Bureau of Economic Research definitions. All expansionary periods were divided into three equal parts by date and named early, middle, and late cycle. If the number of months in each expansionary period was not divisible by 3, an extra month was allocated to early or early and middle. Data assumes the last expansion ended in December 2019. Asset classes represented by the Bloomberg Barclays US Treasury Index (US Treasuries), Bloomberg Barclays High Yield Corporate Bond Index (US HY Bonds), and MSCI US Index (US Equities). US HY Bond data begin in July 1983, in the early third cycle. Most recent full cycle ended on June 30, 2009.
In the past, when yields were higher, the opportunity cost associated with holding high-quality sovereign bonds over the course of a cycle was more manageable because they consistently delivered both income and capital appreciation, and only a small allocation was needed to provide portfolio ballast through down markets. But, negative (or near-zero) yields have reduced their intermediate- to long-term return potential and increased the opportunity cost of high-quality sovereign bonds by making them “one-dimensional.” Said differently, high-quality sovereign bonds no longer provide a reliable stream of income when yields are stuck at such low levels, and they become more dependent on further capital appreciation to generate positive returns. In the 1990s, the income return generated by ten-year sovereign bonds in the United States, Germany, and Japan contributed to 98%, 88%, and 58% of total average annualized returns for the decade, respectively (Figure 5). In contrast, by the 2010s the contribution from income returns fell to 54% in the United States, and just 23% in Germany and 21% in Japan where yields have been negative for part of the decade. At the same time, total sovereign bond returns have declined across markets over time, as yields have fallen and the contribution from income returns has receded.
FIGURE 5 BREAKDOWN OF 10-YR SOVEREIGN BOND RETURNS FOR SELECT COUNTRIES BY DECADE
AACR (%) • Local Currency
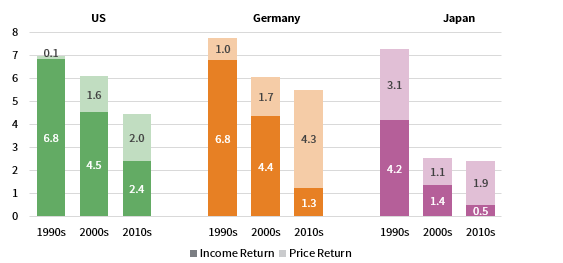
Source: Thomson Reuters Datastream.
Not only do negative rates reduce high-quality sovereign bonds’ future expected returns and increase their opportunity cost, but there are also indications that negative yielding bonds provide less downside protection during periods of market stress (Figure 6). Following the 2007–09 GFC, sovereign bonds in countries that adopted NIRPs have underperformed sovereign bonds of countries that resisted NIRPs by an average of 328 bps during global equity market corrections. The underperformance of sovereign bonds in countries with NIRPs is underscored by market expectations that central banks in these countries would not or could not cut monetary policy rates further. This has especially been the case during the most recent period of equity market volatility caused by the COVID-19 pandemic. As global equities returned -34% in USD terms from February 19, 2020, through March 23, 2020, central bankers in countries with NIRPs did not respond with rate cuts (e.g., Germany and Japan), while countries with positive policy rates were more likely to cut rates. For example, the Fed lowered the Fed funds target rate by 150 bps in March. Average cumulative returns for sovereign bonds in countries with NIRPs were -1.6% over this period, while sovereign bonds in countries with positive interest rate policies returned 4.1%.
FIGURE 6 DIFFERENCE IN AVERAGE 10-YR SOVEREIGN BOND RETURNS FOR SELECT POSITIVE AND NEGATIVE POLICY RATE COUNTRIES DURING GLOBAL EQUITY MARKET CORRECTIONS
2000–20 • Basis Points (bps) • Local Currency
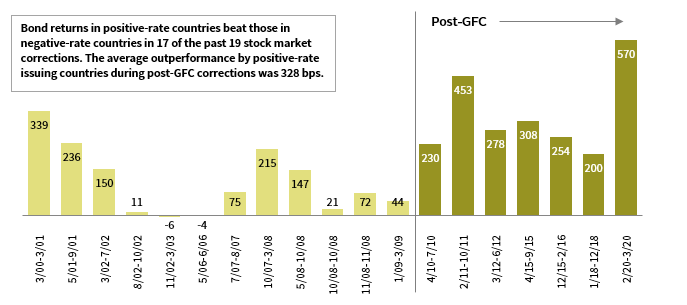
Sources: MSCI Inc. and Thomson Reuters Datastream. MSCI data provided as is without any express or implied warranties.
Notes: Data for 2020 are through March 23. Global equity market corrections are based on MSCI All Country World Index price declines of greater than 10%. Countries with positive policy rates include Australia, Canada, New Zealand, UK, and US; countries with negative policy rates include France, Germany, Japan, Sweden, and Switzerland.
It appears that nominal yields are beginning to meet some resistance as they plunge deeper into negative territory and bump up against their effective lower bound. 2 Case in point, at the onset of the COVID-19 pandemic, ten-year US Treasuries were yielding 1.58% and yields declined more than 100 bps peak-to-trough, whereas ten-year German bund yields and ten-year Swiss sovereign bond yields, which were already deeply negative to begin with, each fell less than 50 bps. While negative-yielding sovereign bonds are less likely to provide the same insurance as comparable bonds with positive yields, they still have some upside remaining. From a starting point of today, if ten-year German bund yields and ten-year Swiss sovereign bond yields fell to -1.0% over the course of the next year—which isn’t an unreasonable scenario in the event of a more protracted downturn—they would still return 5.1% and 6.1%, respectively, well above their average cumulative returns during previous equity market corrections (Figure 7). As the duration and convexity of bonds increases when yields decline, in negative yield territory, even a small exposure to these assets could have a material impact. At the same time, sovereign bonds with negative yields are more vulnerable to a sharp rise in interest rates for the same reasons. If ten-year German bund yields increased to 0.50% (their level roughly 18 months ago) in the span of 12 months, they would return -8.5% over that period. In countries where yields remain positive but are low relative to history, such as in the United States and United Kingdom, sovereign bonds also carry more interest rate risk, but the risk/return profile is less skewed to the downside; ten-year US and UK sovereign bond yields could fall to zero (but remain slightly positive) from current levels over the next year and returns over that period would still line up with historical risk-off periods. 3
FIGURE 7 1-YR TOTAL RETURN OF SELECT 10-YR SOVEREIGN BONDS AT DIFFERENT TARGET ENDING YIELDS
As of March 31, 2020 • Local Currency
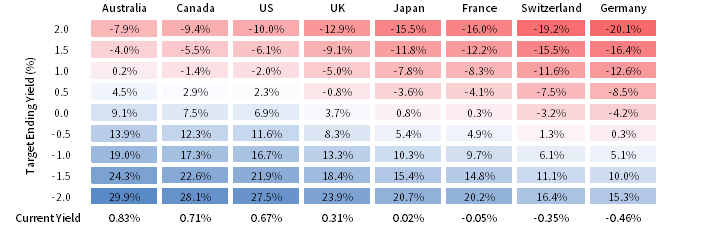
Source: Thomson Reuters Datastream.
Notes: Our fixed income return projections estimate the total nominal return an investor would earn from holding a market index over a specific time horizon and reinvesting the dividends, given assumptions about the movements in the risk-free rate and roll return. Each portfolio is assumed to have a constant maturity profile where a portfolio of newly issued bonds is purchased on Day 1, held for one year, and then sold at the end of Year 1.
Alternative Approaches to Portfolio Protection in a World of Negative Nominal Yields
There is no denying that negative rates have lowered the safe-haven power of high-quality sovereign bonds. They reduce intermediate- to long-term return prospects, increase the opportunity cost relative to holding riskier assets, and limit the upside during periods of market stress. However, from a starting point of today, with yields on a substantial portion of the universe extremely low but still positive and room for yields on negative-yielding bonds to move slightly lower, high-quality sovereign bonds will likely continue to be one of the best safe-haven insurance policies during future periods of market stress. We’ve seen that even those with negative yields have managed to deliver consistently positive, if diminished, returns during risk-off environments this cycle. But investors holding negative-yielding sovereign bonds should not rely on these assets to enhance portfolio returns over the long term; instead, they should invest in them primarily for liquidity or capital preservation.
As yields across the developed markets continue to move lower, it is essential that all investors, not just those combating negative rates today, begin to adjust to life after zero. We are investigating alternative safe-haven options; none are slam dunks and all (like bonds) have trade-offs that involve taking different risks, such as sacrificing liquidity or capital stability in stressful environments. Regardless of our findings, many are likely to stick with high-quality sovereign bonds. Ultimately, investors must determine what works best for their specific situation, but from where we are standing, we see three potential paths forward for investors:
- Do nothing (at least where yields are not consistently negative). Market prognosticators have pronounced the end of the 30+ year bond bull market on several occasions over the years, only to watch yields grind lower. Yields in some countries appear to be testing their limits and will probably begin an extended move higher, but there is no indication that day is around the corner. On the contrary, several factors continue to apply downward pressure, including long-standing structural headwinds (e.g., demographics, technological innovation, and globalization) and the extreme monetary policy setting. Provided investors are aware of the impact of negative (or near-zero) rates (lower-than-expected returns, higher opportunity costs across the cycle, and limited protection during equity corrections), then investors should be well positioned to understand whether they can continue to meet spending needs and adequately rebalance during periods of market stress by maintaining a benchmark weighting to high-quality sovereign bonds. (Where yields across the curve have been consistently negative for an extended period [e.g., Europe and Japan], there is a strong case for favoring cash over high-quality sovereign bonds for insurance as a matter of policy.)
- Rotate tactically between traditional safe-haven assets and less traditional safe-haven assets based on tactical indicators such as valuations, fundamentals, technicals, etc. Safe-haven assets include domestic and/or international high-quality sovereign bonds, cash or shortening duration, extending duration, gold, FX reserve currencies, etc. and less traditional assets include investment- grade credit, private real estate/infrastructure, or defensive liquid alternatives. For instance, when rates are negative and yield curves are flat, there is less of an opportunity cost associated with holding cash and/or gold relative to high-quality sovereign bonds. In this environment, it might make sense to hold some combination of bonds, cash, and gold. However, investors should be aware of the trade-offs associated with alternative safe-haven assets. In the case of cash, yields are also low/negative, and tilting toward shorter-duration assets can generate significant tracking error skewed to the downside. Further, gold is much more volatile than bonds and occasionally suffers sharp losses during severe equity market declines, while less traditional safe-haven assets can suffer from poor liquidity conditions in stressful markets.
- Trim strategic allocations to high-quality sovereign bonds by modifying the target policy portfolio. This option is similar to the previous strategy in that it involves increasing portfolio exposure to alternative safe-haven assets, such as cash at the expense of bonds, but it differs in that it forgoes relying on timely tactical bets and instead establishes a more permanent new normal by changing the policy. Yet, investors that choose to take a more strategic approach will want to consider whether they are willing to adjust their financial goals (e.g., settle for a lower long-term real return and spending rate). One option to consider addressing this issue is a barbell strategy—holding some cash in lieu of sovereign bonds and increasing risk elsewhere in the portfolio—which can boost expected returns without increasing total portfolio risk.
INDEX DISCLOSURES
Bloomberg Barclays Global Treasury Index
The Bloomberg Barclays Global Treasury Index tracks fixed-rate local currency government debt of investment-grade countries. The index represents the Treasury sector of the Global Aggregate Index and currently contains issues from 37 countries denominated in 23 currencies. The three major components of this index are the US Treasury Index, the Pan-European Treasury Index, and the Asian-Pacific Treasury Index, in addition to Canadian, Chilean, Mexican, and South African government bonds.
Bloomberg Barclays US Treasury Index
The Bloomberg Barclays US Treasury Index includes public obligations of the US Treasury with a remaining maturity of one year or more.
Bloomberg Barclays US Corporate High Yield Bond Index
The Bloomberg Barclays US Corporate High Yield Index measures the US corporate market of non-investment grade, fixed-rate corporate bonds. Securities are classified as high yield if the middle rating of Moody’s, Fitch, and S&P is Ba1/BB+/BB+ or below.
Deutscher Aktien Index (DAX) Index
The Deutscher Aktien Index (DAX) is a stock index that represents 30 of the largest and most liquid German companies that trade on the Frankfurt Exchange. The prices used to calculate the DAX Index come through Xetra, an electronic trading system.
FTSE® 100 Index
The FTSE 100® Index is a capitalization-weighted index of the 100 most highly capitalized companies traded on the London Stock Exchange. The equities use an investability weighting in the index calculation. The index was developed with a base level of 1,000 as of December 30, 1983.
MSCI ACWI
The MSCI ACWI is a free float–adjusted, market capitalization–weighted index designed to measure the equity market performance of developed and emerging markets. The MSCI ACWI consists of 46 country indexes comprising 23 developed and 26 emerging markets country indexes.
MSCI Canada Index
The MSCI Canada Index is a free float–adjusted, market capitalization–weighted index designed to measure the equity market performance of Canada.
MSCI Switzerland Index
The MSCI Switzerland Index is a free float–adjusted, market capitalization–weighted index that is designed to measure the equity market performance of Switzerland.
MSCI US Index
The MSCI US Index is designed to measure the performance of the large- and mid-cap segments of the US market. With 617 constituents, the index covers approximately 85% of the free float–adjusted market capitalization in the United States.
Nikkei 225 Index
The Nikkei 225 Index is a price-weighted index comprising Japan’s top 225 blue-chip companies on the Tokyo Stock Exchange.
S&P 500 Index
The S&P 500 Index gauges large-cap US equities. The index includes 500 leading companies and captures approximately 80% coverage of available market capitalization.
Footnotes
- Causes of low or negative yields can include subdued real growth and inflation expectations, structural forces (e.g., demographics, technology, and globalization), and related to these forces, an excess supply of capital relative to investment demand.
- The effective lower bound refers to the level at which lower interest rates become countercyclical. Recent estimates by Princeton University in “The Reversal Interest Rate” publication, suggest the effective lower bound is somewhere between -1% to -2%, but there is a high degree of uncertainty around this range and evidence it could vary by region.
- Sovereign bonds with negative (or ultra-low) yields may be less well compensated for sharp rise in interest rates because the significant price depreciation will outweigh any positive income return when yields are so low, but investors taking interest rate risk when yield curves are flat and negative won’t necessarily lose money in the short term, and where they are positive can still earn money in the long term if rates “normalize” slowly enough.
TJ Scavone - T.J. is a Senior Investment Director in the Capital Markets Research Group at Cambridge Associates.
About Cambridge Associates
Cambridge Associates is a global investment firm with 50+ years of institutional investing experience. The firm aims to help pension plans, endowments & foundations, healthcare systems, and private clients achieve their investment goals and maximize their impact on the world. Cambridge Associates delivers a range of services, including outsourced CIO, non-discretionary portfolio management, staff extension and alternative asset class mandates. Contact us today.