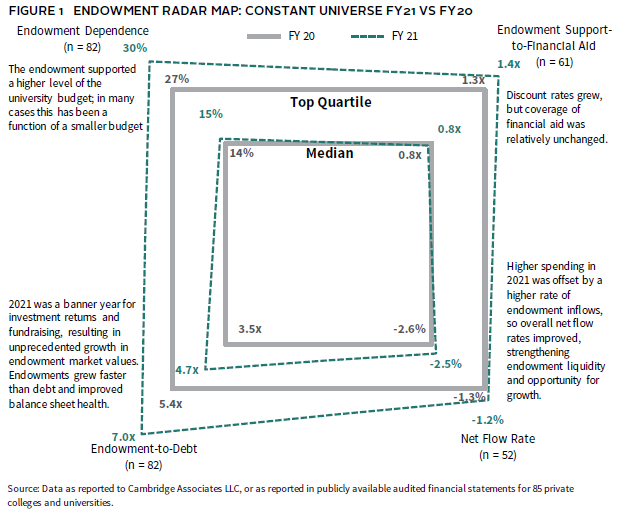
Endowment Radar Study 2021: A Growing Role

Endowment Radar is a methodology that Cambridge Associates developed to visually evaluate the endowment’s role in the college and university enterprise. The four components of Endowment Radar measure the endowment’s impact on budget funding (Endowment Dependence), pricing strategy (Endowment Support-to-Financial Aid), balance sheet health (Endowment-to-Debt), and an indicator of future purchasing power (Net Flow Rate).
Our 2021 Endowment Radar Study reflects the growing role of the endowment in the private college and university business model (Figure 1). This year saw notable growth in the endowment’s support of the budget and its contribution to balance sheet health.
The Endowment is Supporting More of the Budget
The endowments in this study range from supporting a small fraction of the university budget to supporting more than half (Figure 2). The average level of endowment dependence grew from 18.6% in 2020 to 20.3% in 2021.

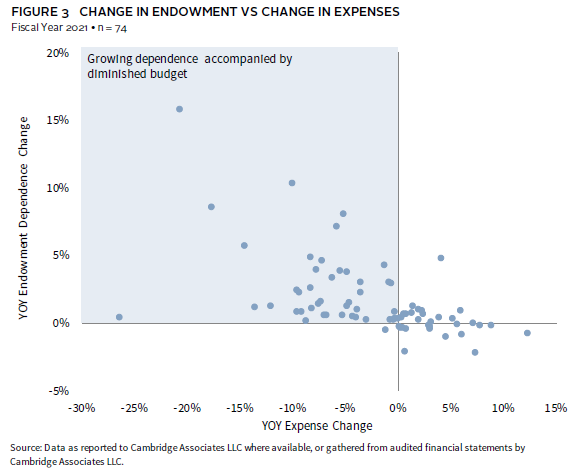
In 2021, the shifts in the underlying components of the endowment dependence ratio were particularly notable. This year, nearly half of the institutions that saw growth in endowment dependence also experienced a contracting operating budget, as shown in the upper-left quadrant of Figure 3. For many, this very unusual financial outcome was driven by a contraction of activity imposed by the pandemic. Only 22% of the participating institutions saw a growth in endowment dependence because of greater endowment spending dollars supporting a growing operating budget.
Tuition Discounts Continue to Grow
One of the pressure points for the operating margin is the growing “cost” of forgone revenue in the form of discounted tuition provided to students as financial aid and scholarships. The average discount rate for the colleges and universities in our study has climbed every year, and this trend continued in 2021, when the average discount rate grew from 42% in 2020 to 43% in 2021. 1 This means that, on average, an institution collected 57% of the tuition charged to students. This line item has eroded net tuition revenue in 2021, as schools have increased financial and merit aid to respond to growing student needs and the competitive enrollment landscape. 2
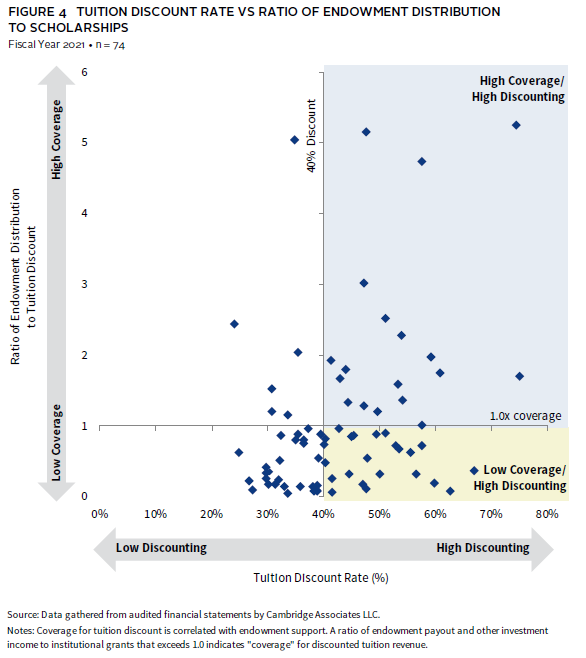
The endowment distribution directly supports financial aid and scholarships via endowments restricted for those purposes and indirectly by subsidizing total costs, which increases the availability of other funds that can be used to support financial aid. Endowment support-to-financial aid is a coverage ratio that considers the direct and indirect roles the endowment plays in pricing strategy. 3 It measures the relationship between endowment distribution and tuition discounts to compare the endowment subsidy to the budget to the forgone revenue discounted to students. On average, the private colleges and universities in our study were in the enviable position of 1.1 times the coverage ratio of endowment distribution to financial aid and ranged from 0.1 to 5.2.
The institutions that have endowment “coverage” for financial aid can offset forgone tuition revenue with endowment spending (Figure 4). This enables them to deliver their discounted price to students from a position of strength as shown in light blue shading in the upper-right quadrant. The diamonds in yellow shading on the lower-right side are offering high discount rates, but from a weaker financial position. Without a higher subsidy from the endowment to offset this forgone revenue, they will need to employ other financial levers—such as auxiliary revenue, annual fund gifts, and careful expense management—to balance the budget.
Endowment Growth Strengthened the Balance Sheet
In 2021, the endowments in our constant universe grew at a rate of 35% on average, far outpacing the growth of institutional debt, which grew 4% in the same period (Figure 5).

This dramatic increase in endowment market values far exceeded any recent increase and bolstered the ratio of endowment to debt, strengthening most institutional balance sheets. Debt has been a valuable and relatively cheap source of liquidity in recent years, but we see institutional appetites are slowing after significant debt increases in 2020. While, on average, debt loads in our study increased, more than half of the colleges and universities (54%) reduced their outstanding debt balance in 2021.
Higher Endowment Spending offset by Higher Inflows
The effective endowment spending rate is the ratio that measures the dollars spent from the endowment as a percentage of the portfolio’s beginning market value. The amount spent is most often determined by a spending policy designed to distribute endowment wealth fairly across generations. 4 In 2021, we did see a slight increase in the rate of endowment spending. For some institutions this increase is the result of a higher spending rate from the endowment to offset disruptions in student revenues. Most colleges and universities, however, continue to draw a steady level of spending and adhere to the long-term discipline that is built into most endowment spending policies.
In addition to long-term performance, net flow—the ratio that calculates the net rate of spending and inflows—is an indicator of whether the endowment will keep pace with the enterprise, lose purchasing power, or take on a greater role in the future.
Net flow is a metric that tends to vary considerably by institution, and from year-to-year for some institutions, because it is sensitive to cash flow timing and the unanticipated event, such as the gift of a large bequest. The net flow rate for the median institution was -2.6%, meaning that nearly half of the 5.0% spending rate was offset by 2.3% inflow rate.
Institutions with positive net flow were driven by strong inflows, and in some cases, more muted spending rates (Figure 6).
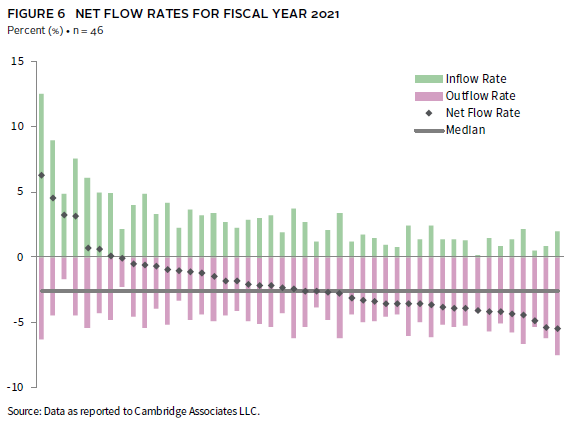
Net flow is a source of endowment growth when inflows outpace outflows. At the lower end of the net flow range (the right side of Figure 6), high spending significantly overshadowed inflows. To grow their endowment, those institutions must rely on performance outpacing a low net flow rate. In the middle of the net flow chart, we see a variety of experiences. In some cases, high spending is partially offset by successful fundraising; in others, we see lower spending accompanied by low inflows.
Endowment Radar Case Study
An annual review of endowment radar results provides important context for the investment policy and endowment management. It can help institutional leaders and investment committees understand key links to the enterprise as they consider or underwrite the liquidity and risk profile of the endowment.
In an example we consider the Endowment Radar of Case Study University (CSU), shown below in Figure 7. On the left side, we see the 2020 Endowment Radar chart plotted against peer experiences, and on the right side, we have the updated 2021 chart.
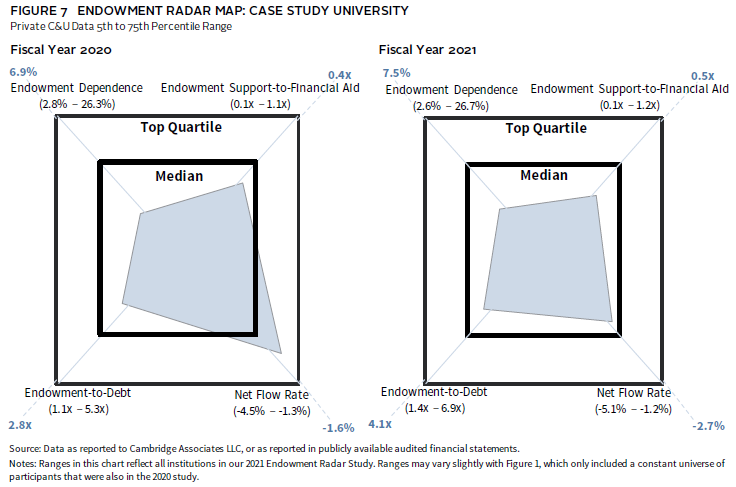
The comparisons provide some helpful context, but also some interesting observations of the drivers of these changes:
- Endowment dependence increased from 6.9% to 7.5%. The endowment had a larger role in supporting the university budget in 2021. Interestingly, the endowment spending policy generated fewer dollars in support, but this change was more than offset by a reduction in university expenses that may have been related to contracted operations during the pandemic.
- The endowment support-to-financial aid ratio improved slightly in 2021. Similar to the Endowment Dependence metric, this shift may have been related to pandemic-related reductions in discount dollars awarded to students in 2021.
- The endowment grew more than 30%, and the level of outstanding debt declined slightly, as principal payments were made and no new debt was issued. While CSU is still lagging a strong peer median, these balance sheet shifts led to a much stronger endowment-to-debt ratio.
- The net flow rate was more negative in 2021. Endowment spending was consistent at 5%, but gift inflow rates were lower. Net flow is time-sensitive, but this will be important to watch if endowment growth goals are based on anticipated investment performance and fundraising achievement.
With a contraction in the financial aid and operating costs, 2021 was an unusual year for CSU, but these reductions may be short-lived as 2022 brings some return to more traditional conditions. Fiscal year 2021 also delivered outsized performance, a tailwind that bolsters the balance sheet and increases the potential role of the endowment. These returns are the upside of investment risk and illiquidity, but expectations and spending reliance will need to be managed going forward to preserve intergenerational equity and the long-term role of the endowment.
Conclusion
The college and university business model experienced more change in 2021. For many institutions, it was a financially strong year, as outsized endowment returns buoyed balance sheets and provided greater levels of budget support. Comparing two years of endowment radar metrics, we saw unprecedented growth that needs to be balanced across generations of stakeholders. Higher endowment values will translate to higher spending, especially for institutions with endowment spending policies that are linked to endowment market values. This good news must always be managed with an eye toward future risks that may impact investment markets and university operations, including inflation, interest rates, pandemic conditions, and demographics.
As geopolitical and economic conditions continue to threaten finances in fiscal year 2022, we will watch these metrics and the role of the endowment in supporting colleges and universities during these tumultuous times.
Notes on Data
This report includes data on 85 private college and university clients of Cambridge Associates, with endowment market values as of June 30, 2021, ranging from $83 million to $58 billion, with a median of $1.2 billion. Most of the data used in this report were provided to Cambridge Associates LLC through our annual survey of colleges and universities. We have accessed additional data through publicly available audited financial statements, specifically on tuition discounting and to fill gaps in reported data. “Endowment” is used throughout to refer to the entire LTIP; the vast majority of college and university LTIPs are composed of endowment, though operating funds and other capital are often invested alongside.
Footnotes
- The 2020 to 2021 comparison is for a constant universe of 66 institutions. Tuition discount is calculated as all scholarship aid provided to students as reported on financial statements, including aid for undergraduate and graduate students and aid to tuition, fees, room, and board. Discount rate is calculated as total tuition discount as a percentage of gross tuition and fees.
- Median net tuition and fees declined 3.6% from 2020 to 2021 for a constant universe of 250 private colleges and universities rated by Moody’s.
- The endowment distribution is not all designated for financial aid. We are simply comparing the subsidy from the endowment to the forgone revenue of student aid. Additionally, we are using discount rate as a barometer of price, recognizing that it is an imperfect assumption.
- Most endowed institutions rely on annual distributions from the endowment as a source of supplemental operating revenue. These distributions are based on the institution’s endowment spending policy, which links the long-term investment portfolio (LTIP) and the enterprise. The spending policy should be designed to balance the needs of current and future generations of stakeholders, with the goals of providing appropriate levels of support to operations and preserving, or even growing, endowment purchasing power.
About Cambridge Associates
Cambridge Associates is a global investment firm with 50+ years of institutional investing experience. The firm aims to help pension plans, endowments & foundations, healthcare systems, and private clients achieve their investment goals and maximize their impact on the world. Cambridge Associates delivers a range of services, including outsourced CIO, non-discretionary portfolio management, staff extension and alternative asset class mandates. Contact us today.