ASEAN Equities: Surprising to the Upside


Southeast Asia, also known as ASEAN (The Association of Southeast Asian Nations), was a relative safe haven for investors in 2022. In local currency terms, ASEAN equities returned -0.1% in 2022, outperforming Asia ex Japan (AxJ) and developed markets (DM) equities, which were down more than 15%. While ASEAN currencies have been under pressure, the market has also held up in USD terms, returning -4.1% for the year compared to AxJ equities, down 19.4%, and DM equities, which returned -17.7%.
In this paper, we analyse the factors that have supported ASEAN equities, including the country/sector composition of the ASEAN market, the earnings outlook for the region, and the currency basket. We also show that the ASEAN market looks different today versus 2013, when the region experienced headwinds due to elevated valuations coupled with a collapse in commodity prices and the Federal Reserve’s tapering cycle.
Performance Overview
For context, the ASEAN region comprises a total of ten member countries 1 , although the MSCI AC ASEAN Index that we use for the purpose of this paper includes a subset of five – Singapore (35%), Thailand (23%), Indonesia (19%), Malaysia (16%), and Philippines (8%). Although it is a member of ASEAN, Vietnam is not in this MSCI index because it is classified as a “frontier” market. The performance of this group of equities has trailed that of broader emerging markets (EM) and AxJ equities over the past decade until recently, as seen in the relative cumulative wealth chart in Figure 1.
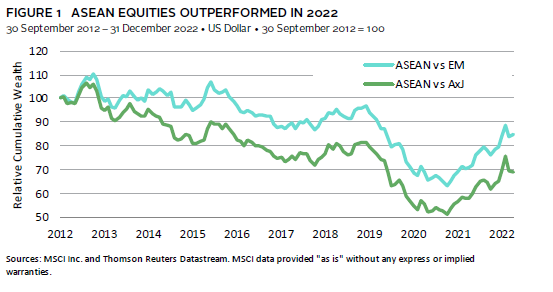
Over the period shown above, the market’s underperformance versus EM and AxJ equities can be attributed to its country and sector composition. For EM and AxJ equities, performance has been driven by internet and technology stocks found in China, Korea, and Taiwan. In contrast, ASEAN equities are underweight technology and growth stocks, and are materially overweight the financials sector, given the large exposure to banks in Singapore, Indonesia, and Malaysia (Figure 2).
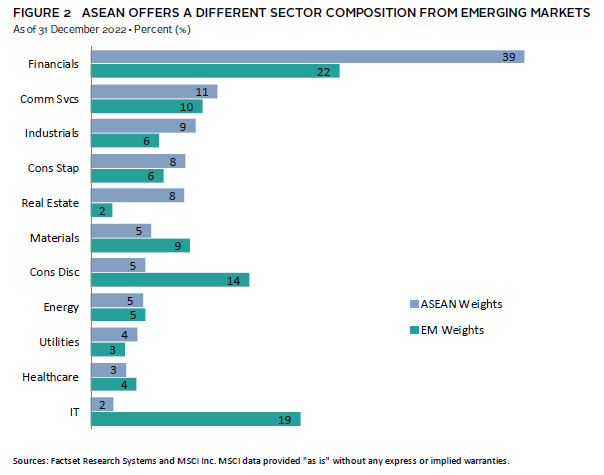
As a result, ASEAN equities have been insulated from the 2021–22 China tech crackdown and equity sell-off, and are less sensitive to rising rates, which have impacted the Korea and Taiwan technology sectors. Improving earnings expectations for the region have also helped to offset the drag from a compression in valuation multiples caused by higher inflation and global central bank tightening. ASEAN banks have seen stronger earnings in 2022 as the region’s interest rates moved higher in tandem with the United States’ rates. In addition, the market is overweight other cyclical sectors such as industrials and real estate, which have benefitted as the underlying economies reopen and domestic demand rebounds.
Earnings Outlook
ASEAN’s sectoral overweight to financials and its underweight to growth and technology sectors imply that corporate profitability has lagged that of its EM and AxJ counterparts in recent years. As of 31 December 2022, the trailing 12-month return on equity to ASEAN equities was 9.4%, versus 12.9% for EM equities and 10.6% for AxJ equities.
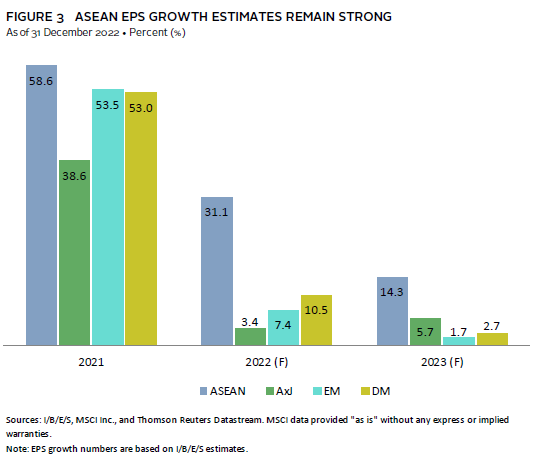
However, as discussed earlier, earnings growth for ASEAN equities had been more resilient in 2022 and forecast to remain so in 2023. Banking profits are holding up, while broader ASEAN equities have been supported by the reopening of the tourism sectors and a rise in commodity prices, which is favourable for commodity-exporting countries, such as Malaysia and Indonesia. Analysts forecast ASEAN earnings per share to grow 31.1% in USD terms in calendar year 2022 and 14.3% for 2023, significantly higher than their global counterparts (Figure 3).
Valuations Have Risen Slightly, but Remain Favourable
Unlike in 2013, when valuations for ASEAN equities were at elevated levels, valuations are now at low levels in part due to the past few years of muted performance. ASEAN equities currently trade at an average return on equity–adjusted price-earnings (P/E) of 14.2 times, which is the 27th percentile of historical observations. Valuations relative to global equities also remain low at the 29th percentile of historical observations (Figure 4). While there is dispersion at the country level, absolute valuations for all regions are below the historical median except Thailand, which trades close to fair value. Given the past few years of political turmoil, valuations for Malaysian equities are depressed at the 8th percentile. However, there is upside market potential if newly appointed Prime Minister Anwar Ibrahim can maintain stability within his coalition government and drive investor confidence.
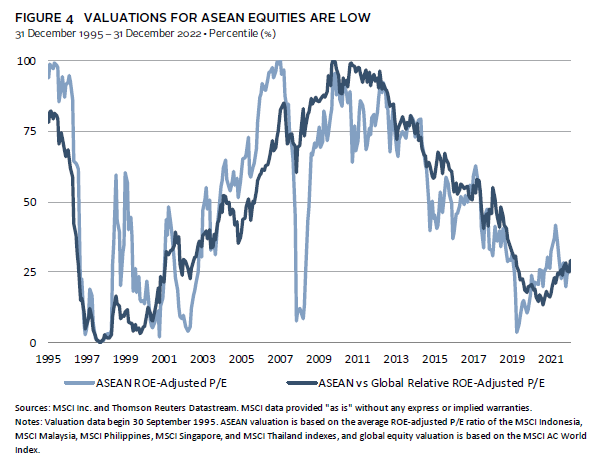
While the dataset for ASEAN equities is relatively limited, the market is very sensitive to global economic downturns and valuations have collapsed during these instances, such as in 2001, 2008 and 2020, before rebounding sharply (let alone 1997–98 when Southeast Asia was the epicenter of the Asian Financial Crisis). Valuations relative to global equities, on the other hand, have tended to move in longer cycles. Current levels of valuations, both in absolute and relative terms, suggest that there could be further upside to ASEAN equities in the near term, barring any global recessionary shocks.
Currency Impact
For ASEAN equities, the currency component is also a factor for consideration. ASEAN currencies were hit hard during the 2013 taper tantrum due to foreign investor outflows, and one would expect them to face similar pressure amid the Fed tightening regime. Over 2022, ASEAN currencies were indeed down 5.1% on average against the US dollar, although this compares favourably to the euro (-6.2%), pound (-11.2%), and yen (-12.7%). The Singapore dollar in particular managed to appreciate 0.5% against the US dollar in 2022, as the Monetary Authority of Singapore aggressively tightened policy to combat rising inflation.
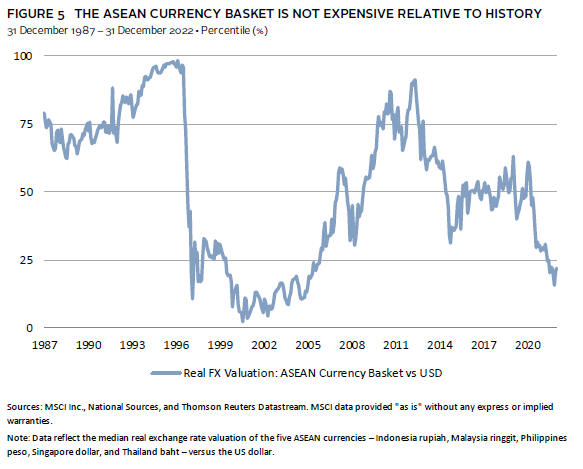
Whether ASEAN currencies can remain supported is a question. On the one hand, real exchange rate valuations for ASEAN currencies versus the US dollar have declined from the elevated levels seen in 2013 (Figure 5), and the currency basket now looks cheap relative to history. The region’s current accounts should remain supported by the continued reopening of ASEAN’s tourism sectors, as well as a rebound in the Chinese economy and demand following the lifting of its zero-COVID policy. However, real-yield differentials between ASEAN and the United States have narrowed in recent months, which could erode the support for ASEAN currencies. This comes as inflation in the region ticked up over second half 2022, and as the Fed moved aggressively to tighten policy, while some ASEAN central banks (e.g., Bank Indonesia and Bank of Thailand) were slower to do so, given their focus on economic recovery.
Considerations and Conclusion
Overall, ASEAN equities have held up better than expected in 2022, benefitting from their sectoral exposure to financials and other cyclical sectors, which have performed well in the rising rate environment and as the underlying economies continue to reopen. Current valuations for ASEAN equities and currencies are also more favourable today as compared to 2013, allowing potential for further upside performance. However, the market is very sensitive to global economic cycles, and a slowdown in global growth remains a key risk for ASEAN equities in the near term.
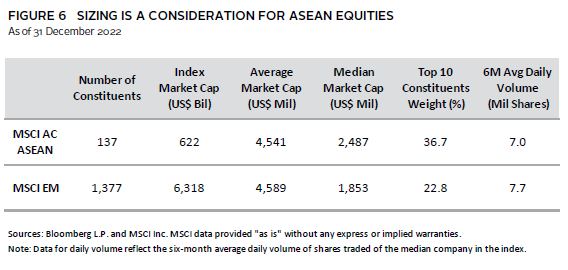
Another key consideration for ASEAN is the relatively smaller size of the market. With a free float market cap of only $622 billion, the market is one tenth the size of broader emerging markets (Figure 6). Within the MSCI AC ASEAN Index, the investable universe is small (137 stocks) and stock concentration is somewhat high, with the top ten constituents accounting for 37% of the index’s weight. However, we do highlight that the ASEAN market is not as illiquid as one may perceive, in terms of the average size of the company as well as the trading volume, both of which are comparable to that of the EM universe.
Finally, in the long term, the region stands to benefit from further US-China decoupling, as companies seek to diversify their supply chains away from China. The pace of change will depend on how quickly and successfully ASEAN countries can develop the required supporting infrastructure to bring down logistics costs, which are currently high relative to China. The increased internet availability in Southeast Asia (e.g., Indonesia and Vietnam) has also created more interest in venture capital areas such as consumer tech, fintech, and software-as-a-service. This could result in a longer-term shift in the sectoral composition of the region and boost corporate earnings and profitability. That being said, China’s sharp pivot from its zero-COVID policy could drive a reversal in foreign investor fund flows from ASEAN and into China, and thus reverse recent performance momentum. However, China’s reopening will ultimately support growth in the region as a whole. Over the longer term, ASEAN markets seem to have favourable tailwinds and may continue to see increased investor interest.
Index Disclosures
MSCI AC ASEAN Index
The MSCI AC ASEAN Index captures large- and mid-cap representation across four emerging markets countries and one developed markets country. With 136 constituents, the index covers approximately 85% of the free float–adjusted market capitalisation in each country.
MSCI AC Asia ex Japan Index
The MSCI AC Asia ex Japan Index captures large- and mid-cap representation across two of three developed markets countries (excluding Japan) and eight emerging markets countries in Asia. With 1,201 constituents, the index covers approximately 85% of the free float–adjusted market capitalisation in each country.
MSCI All Country World Index
The MSCI ACWI captures large- and mid-cap representation across 23 developed markets and 24 emerging markets countries. With 2,898 constituents, the index covers approximately 85% of the global investable equity opportunity set.
MSCI Emerging Markets Index
The MSCI Emerging Markets Index represents a free float–adjusted market capitalisation index that is designed to measure equity market performance of emerging markets.
MSCI Indonesia Index
The MSCI Indonesia Index is designed to measure the performance of the large- and mid-cap segments of the Indonesian market. With 22 constituents, the index covers about 85% of the Indonesian equity universe.
MSCI Malaysia Index
The MSCI Malaysia Index is designed to measure the performance of the large- and mid-cap segments of the Malaysian market. With 34 constituents, the index covers about 85% of the Malaysian equity universe.
MSCI Philippines Index
The MSCI Philippines Index is designed to measure the performance of the large- and mid-cap segments of the Philippines market. With 17 constituents, the index covers about 85% of the Philippines equity universe.
MSCI Singapore Index
The MSCI Singapore Index is designed to measure the performance of the large- and mid-cap segments of the Singapore market. With 21 constituents, the index covers approximately 85% of the free float–adjusted market capitalization of the Singapore equity universe.
MSCI World Index
The MSCI World Index captures large- and mid-cap representation across 23 developed markets countries. With 1,508 constituents, the index covers approximately 85% of the free float–adjusted market capitalisation in each country.
Footnotes
Aaron Costello, CFA - Aaron Costello is the Head of Asia Investment Strategy and is responsible for the firm’s investment and research activities in the region.
About Cambridge Associates
Cambridge Associates is a global investment firm with 50+ years of institutional investing experience. The firm aims to help pension plans, endowments & foundations, healthcare systems, and private clients achieve their investment goals and maximize their impact on the world. Cambridge Associates delivers a range of services, including outsourced CIO, non-discretionary portfolio management, staff extension and alternative asset class mandates. Contact us today.