VantagePoint: Too Much Optimism Amid Uncertainty


What a difference a couple of months makes. Economic conditions have improved since year-end 2022 due to the heady brew of China lifting its zero-COVID policy, Europe navigating its energy crisis better than anticipated, and cooling inflation in the United States. In early February, an exceptionally strong US labor report and a sharp rebound in Institute for Supply Management’s (ISM’s) purchasing manager survey for services had many investors both questioning if the United States is headed for recession after all and worrying that the Federal Reserve would need to tighten more than previously anticipated. Economic data and prospects have improved, but the market appears to have discounted too much optimism, given the degree of uncertainty and the risk to earnings. In this edition of VantagePoint, we explore the improvement in economic conditions, prospects for recession in the United States and Europe, the degree to which markets are pricing in reasonable economic and earnings prospects, and sensible asset allocation considerations.
We conclude that a mild recession remains likely, given the economic stresses already transpiring along with prospects for major central banks to be slow to cut rates to support economic activity. Equity valuations, particularly of US and growth stocks, remain elevated on near-peak earnings, making them vulnerable to decline in a worse-than-anticipated economic outcome. Value stocks, which are also dominant in developed markets exposure outside the United States, remain more reasonable. Investors should resist the temptation to time the market and maintain neutral exposure to high-quality bond duration.
Better Than Expected
Investor sentiment had become extremely negative by late summer 2022, as investors questioned if Chinese equities are investible, if the European industrial model can continue, and if US inflation could be adequately reduced without a recession. Recent developments have taken the worst-case scenario off the table, justifying a rally; however, investors must remember that market risks cut both ways and downside risk remains.
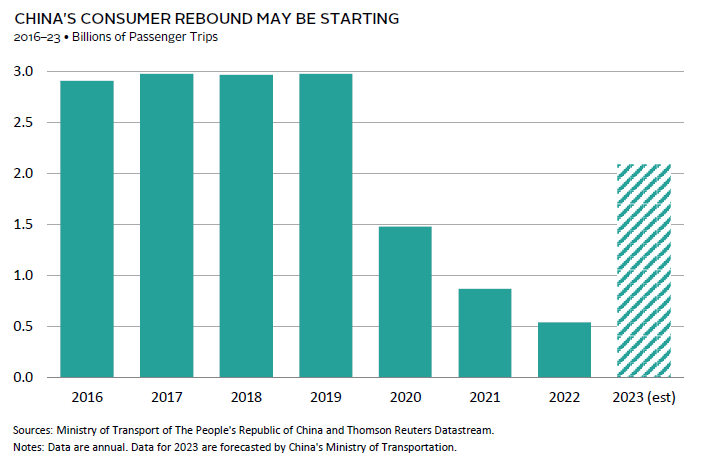
Chinese GDP grew only 3% last year, well below the official target. While its zero-COVID policy depressed consumption sharply in 2022, its recent lifting of restrictions should spur a recovery in demand. Indeed, mobility and economic activity indexes have already rebounded. Easing property sector regulations should also be positive for the economy. Falling global demand and reductions in domestic infrastructure spending will partly offset the growth in consumption, however we still expect aggregate growth will improve. With growth focused on domestic consumption—rather than infrastructure—the impact on the global economy is likely to be less significant than in prior Chinese growth rebounds, but meaningful improvement should be expected.
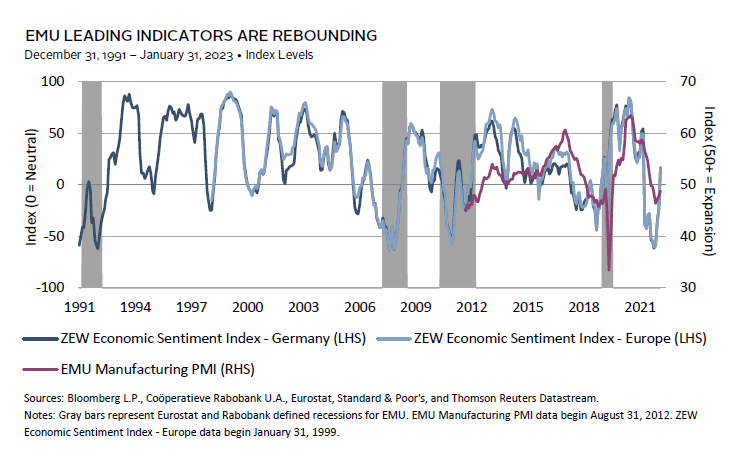
The bull case for Europe is based on the belief that inflation will decelerate from high levels and that economic activity will be supported by China’s reopening given China’s contribution to European growth through imports of European goods and tourism. Euro area headline inflation has come down and concerns over forced energy rationing have been alleviated. Europe’s terms of trade have been improving as cheaper energy has allowed import prices to soften, moving more in line with export prices, supporting profits, economic growth, and the euro. At the same time, falling inflation and energy prices have potential to boost consumption by lessening the drag on real disposable income.
For Europe to sustain economic momentum, inflation must continue to decelerate from still-high levels, which may take time. Stable energy prices near current levels, improved supply chains, falling transportation costs, a stronger euro, and generally decelerating global inflation should eventually dampen core inflation in Europe.
The cause for optimism in the United States has been encouraging news on inflation, even as signs of slowing economic growth were mounting. Inflation in more cyclically sensitive sectors, such as manufacturing and consumer durables, appears to have peaked last March and has been negative on a three-month annualized basis since September. In contrast, sticky inflation—composed primarily of services—has remained relatively steady, even excluding shelter, which is softening, but is well-understood to have a lagged impact on official inflation measures. We expect sticky inflation to soften broadly and are already seeing signs of improvement as wage inflation moderates. The key uncertainty is how long it will take for inflation to fall back to the Fed’s 2% target.

Why a Recession is Likely
Despite an improved backdrop from deeply negative expectations, a recession is likely in United States and Europe. Our view is based on the deteriorating outlook for manufacturing, the slowing pace of consumption, and expectations that central bank tightening will take a bite out of growth.
Mixed Economic Data Point to Still-Elevated Risk of Recession
We see some cracks and stresses in the US and European economies. Home prices, which tend to lead economic downturns, have softened, while risk of consumer and corporate credit defaults have increased, albeit from low levels. Global trade growth has turned negative. Labor markets are showing mixed signals, especially in the United States. Leading indicators, such as temporary help service payrolls, appear to have peaked and small business owners’ plans to hire have been trending down. However, unemployment levels remain steady at low levels, and the United States saw unemployment fall to just 3.4%, a level not seen since the 1960s!
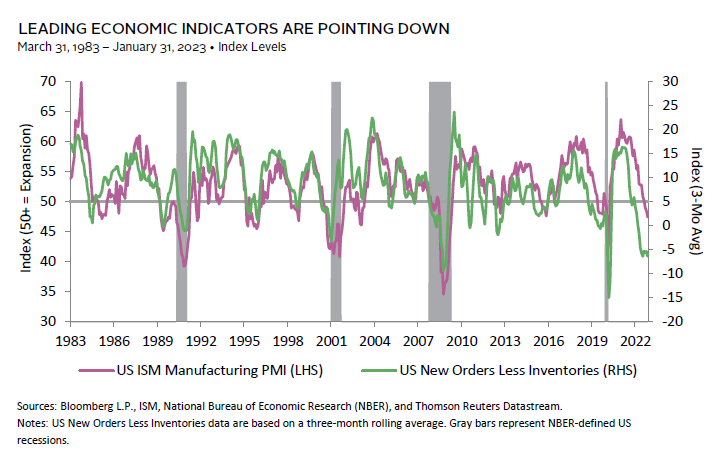
The surprisingly strong bounce back in ISM’s services survey, including the forward-looking new orders component in January, could be somewhat distorted, as it follows December’s downside surprise. While manufacturing purchasing manager indexes (PMIs) have reached the current level several times since 2010 without triggering a recession, ISM manufacturing new orders less inventories are more deeply negative and at these levels have been more reliable in identifying recessions. Further, the measure tends to lead the broad manufacturing PMI. Still, the unexpectedly strong services survey injects some doubt over the direction of the US economy, as it represents roughly two-thirds of the economy and has never provided a false recession signal.
Monetary Policy Biased to Combat Inflation Risk
The downside risk to economic growth ties to the speed and magnitude of central bank hiking, with the Fed leading the way. The Fed’s hiking pace has been the sharpest experienced since the early 1980s. The economic slowdown may accelerate in the months ahead, as much of the impact of aggressive monetary policy tightening may be forthcoming. Still, the end of the tightening cycle appears to be nigh as central banks are generally slowing their pace of tightening because inflation is starting to subside.
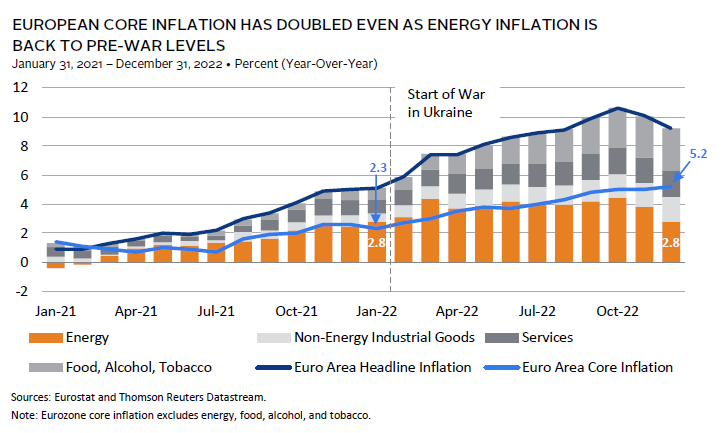
While US inflation is starting to slow more broadly, the situation in Europe is quite different. Headline inflation at 8.5% has come down from peak levels but remains high enough to keep the European Central Bank more hawkish than most other major central banks. Further, even as headline inflation has come down, core inflation is still rising with non-energy industrial goods; services; and food, alcohol, and tobacco subsectors seeing increased inflation nearly every month since the war in Ukraine began. A combination of unseasonably warm weather and good energy management have eased energy prices. Should energy prices remain contained, core CPI should eventually soften.
Slowing inflation should encourage central banks to pause, but they maintain a high bar for actual easing, determined not to repeat the Fed’s mistakes of the 1970s. Several factors could cause inflation to be more persistent in the near term, including China’s reopening and still-tight labor markets. Central bankers face the additional challenge that as markets persist in discounting easing, financial conditions ease, thereby raising the risk that inflation will not subside as quickly as the market anticipates or that central banks will need to keep policy tighter for longer. In sum, disinflation has started, but inflation remains quite high and central banks believe that the risk of persistently high inflation has not passed. Central banks will be slow to ease rates absent a severe recession. Even a financial accident is more likely to result in asset purchases to support affected markets than a lowering of policy rates, as was the case in the United Kingdom as pension plans unwound leveraged bond positions.
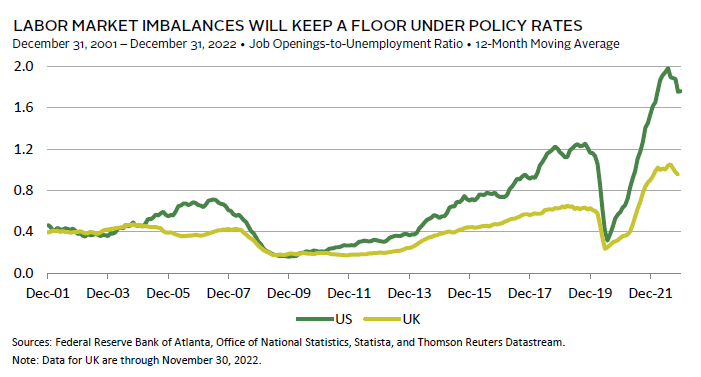
Sources of Sticky Inflation
A key rationale for central banks to maintain a high bar for easing is tight labor markets, particularly in the United States and United Kingdom. In the United States, the ratio of job openings to unemployed workers is near record highs with roughly twice as many job openings as job seekers. While some of these job openings may disappear as the economy weakens, the imbalance may be somewhat structural, given aging labor demographics. One positive force may be found through easing immigration constraints, as US immigration has increased over the last year, bringing the working age immigrant population closer to pre-COVID trends.
Climate change and shifting supply chains are other factors that may push up inflation, keeping central banks in check. However, these factors will play out slowly and their impact will change over time. Initially, the transition to a low-carbon environment is likely to be inflationary, given the massive scale of infrastructure and technological innovation required for clean energy to become pervasive. Ultimately the energy transition will lead to lower cost, more secure, energy sources.
The gradual shift in supply chains—which has been underway for some time—has intensified during the pandemic and war in Ukraine in response to the risks and instability associated with highly complex global supply chains. We expect supply chains to continue to shift closer to end markets and more geopolitically friendly locals, but this is not necessarily highly inflationary. Indeed, businesses may only seek to move production when it is cost effective to do so. For example, Chinese labor is no longer the cheapest among emerging markets, which overall have seen their cost advantages erode over time. Tax incentives and tariffs are also making it more economically feasible for some businesses to shift supply chains.
Climate change, geopolitics, and an increased preference for resilience over cost minimization are increasing the role of governments in moving supply chains through industrial policy. Industrial policy can be inflationary but if done well, it has potential to also increase growth and productivity.
We Expect a Moderate Recession That is Not Priced Into the Equity Market
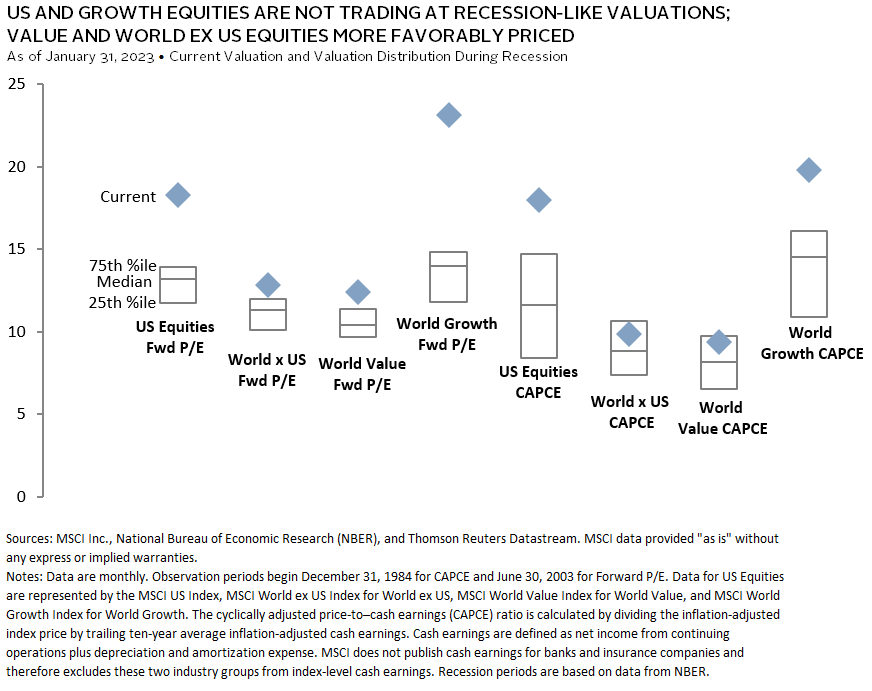
While global equities returned -16% in 2022, the decline was due to valuation compression as interest rates rose sharply. We expect that interest rates will be less of a drag on equity valuations this year with the risk shifting to earnings disappointments. We have argued that if a recession were to transpire, earnings expectations would fall as growth slows and operating leverage turns negative (i.e., earnings growth decelerates even more than sales growth). Indeed, ACWI earnings estimates for 2023 have fallen around 8% over the past year and earnings expectations for the United States, Europe, and Japan are below 2%.
Multiple contraction thus far does not reflect recession expectations; markets remain expensive relative to typical multiples experienced during recessions. This is particularly the case for US equities and growth stocks in general, both on price multiples of forward earnings and normalized cyclically adjusted price-to–cash earnings (CAPCE).
In the short term, if we are right and a recession is forthcoming in 2023, history suggests high-quality stocks will be the best performers. On average, global developed markets quality stocks outperformed the broad market by more than 500 basis points (bps) over the last six US recessions, while value stocks underperformed by more than 100 bps. However, value stocks were able to outperform during recessions, particularly prior to the 1990s. Why might that have been? There are two main theories believed to explain the value stock return premium: 1) High returns for value stocks are necessary to compensate investors for higher risk associated with greater sensitivity to economic growth; and 2) Investors’ tendency to anchor to recent performance and extrapolate current conditions into the future result in overpaying for growth and underpaying for value stocks. The first theory highlights value stocks’ reliance on economic outcomes, while the second implies that mean reversion of fundamentals is essential for value stock outperformance.

Based on these theories, value stocks could have a meaningful runway ahead, even if they were to underperform briefly during a recession. If the post-recession environment looks much like that of the post-2007 era of sustained low growth and low inflation, value would likely lag, as it would be unlikely to benefit from positive economic surprises. However, if economic growth were to improve, driven by increased productivity, we would expect to see better prospects for value. The jury is still out, and economists are engaged in a vigorous debate. Even Larry Summers—the modern champion of the case for secular stagnation over the last decade—has become more optimistic that at least the United States will escape such conditions, while economist Olivier Blanchard is leading the other side of this debate.
Should a stronger growth environment fail to pass, another source of potential outperformance for value stocks rests with behavioral factors. The behavioral argument for the existence of a value premium hinges on mean reversion of fundamentals and stock returns. Investors tend to anchor perspectives based on recent performance. As a result, investors will pay too much for growth stocks because they presume strong growth will persist into the indefinite future, while paying too little for value stocks with less robust earnings growth expectations. This transition has already begun, and we expect it has more space to run. Elevated profit margins have been under pressure, disproportionately impacting large-cap growth stocks. Over time, large-cap growth stocks may be further disadvantaged from shifting long-term trends that have favored large-cap growth companies (e.g., low interest rate expenses, low taxes, minimal regulations, low wage expenses from an increased global labor pool).
Looking at the last two market cycles from market peak to subsequent peak in comparison to the current cycle in process, we see very different dynamics. In the 2000–07 cycle, earnings growth for growth, value, and quality indexes were relatively comparable, although value outpaced growth, and valuations contracted across the board. In contrast, between 2007 and mid-2021, the outperformance of growth and quality stock earnings was pronounced and particularly concentrated in the United States. For developed markets outside the United States, similar trends emerged, although earnings growth was lower across the board. The current cycle bears more resemblance to the 2000–07 cycle, while this performance is still nascent. An important distinction is that the earnings growth this cycle has been narrower, given the dominance of the energy sector. Still, other sectors favored by value screens (e.g., materials) have out-earned growth-favored sectors such as tech and communication services. Should these relatively strong fundamentals persist, mean reversion toward value will continue. We are willing to tilt portfolios in this direction, given the still-strong valuation incentive and the pressure on growth stock earnings, even as this may be a bumpy ride in the face of recession.

We also like the defensive character of high quality in the face of a recession and regard the two styles as complementary. More broadly, prospects for a recession suggest investors should remain neutral with regard to bond duration, which we still view as the first line of defense for portfolios, especially as inflation has been trending down and longer-term inflation expectations remain anchored. We would not seek to time the market, but instead rely on well thought-out plans for maintaining adequate liquidity to meet obligations, while taking adequate risk to meet long-term objectives.
Index Disclosures
MSCI China Index
The MSCI China Index contains 717 constituents and captures large- and mid-cap representation across China A-shares, H-shares, B-shares, red chips, P chips, and foreign listings. Currently, the index also includes large- and mid-cap A-shares represented at 20% of their free float–adjusted market capitalization.
MSCI US Index
The MSCI US Index is designed to measure the performance of the large- and mid-cap segments of the US market. With 625 constituents, the index covers approximately 85% of the free float–adjusted market capitalization in the United States.
MSCI US Growth Index
The MSCI US Growth Index captures large- and mid-cap securities exhibiting overall growth style characteristics in the United States. The growth investment style characteristics for index construction are defined using five variables: long-term forward EPS growth rate, short-term forward EPS growth rate, current internal growth rate and long-term historical EPS growth trend, and long-term historical sales per share growth trend.
MSCI US Quality Index
The MSCI US Quality Index is based on the MSCI US Index, its parent index, which includes large- and mid-cap stocks in the US equity market. The index aims to capture the performance of quality growth stocks by identifying stocks with high-quality scores based on three main fundamental variables: high return on equity, stable year-over-year earnings growth, and low financial leverage. The MSCI Quality Indexes complement existing MSCI Factor Indexes and can provide an effective diversification role in a portfolio of factor strategies.
MSCI US Value Index
The MSCI US Value Index captures large- and mid-cap US securities exhibiting overall value style characteristics. The value investment style characteristics for index construction are defined using three variables: book value-to-price, 12-month forward earnings-to-price, and dividend yield.
MSCI World Index
The MSCI World Index represents a free float–adjusted, market capitalization–weighted index that is designed to measure the equity market performance of developed markets. As of December 2017, it includes 23 developed markets country indexes: Australia, Austria, Belgium, Canada, Denmark, Finland, France, Germany, Hong Kong, Ireland, Israel, Italy, Japan, the Netherlands, New Zealand, Norway, Portugal, Singapore, Spain, Sweden, Switzerland, the United Kingdom, and the United States.
MSCI World ex US Index
The MSCI World ex USA Index captures large- and mid-cap representation across 22 of 23 developed markets countries excluding the United States. With 883 constituents, the index covers approximately 85% of the free float–adjusted market capitalization in each country.
MSCI World Growth Index
The MSCI World Growth Index captures large- and mid-cap securities exhibiting overall growth style characteristics across 23 developed markets countries. The growth investment style characteristics for index construction are defined using five variables: long-term forward EPS growth rate, short-term forward EPS growth rate, current internal growth rate and long-term historical EPS growth trend, and long-term historical sales per share growth trend.
MSCI World Quality Index
The MSCI World Quality Index is based on MSCI World, its parent index, which includes large- and mid-cap stocks across 23 developed market countries. The index aims to capture the performance of quality growth stocks by identifying stocks with high quality scores based on three main fundamental variables: high return on equity, stable year-over-year earnings growth, and low financial leverage. The MSCI Quality Indexes complement existing MSCI Factor Indexes and can provide an effective diversification role in a portfolio of factor strategies.
MSCI World Value Index
The MSCI World Value Index captures large- and mid-cap securities exhibiting overall value style characteristics across 23
developed markets countries. The value investment style characteristics for index construction are defined using three variables: book value-to-price, 12-month forward earnings-to-price, and dividend yield.
ZEW Economic Sentiment Index
The ZEW Indicator of Economic Sentiment is a simple sentiment indicator created out of the monthly ZEW Financial Market Survey. The ZEW Financial Market Survey is an aggregation of the sentiments of approximately 350 economists and analysts on the economic future of Germany in the medium term. It is constructed as the difference between the percentage share of analysts that are optimistic and the share of analysts that are pessimistic for the German (Germany index) and European (Europe index) economy in six months. ZEW stands for Zentrum für Europäische Wirtschaftsforschung, which translates to the Center for European Economic Research.
Celia Dallas - Celia Dallas is the Chief Investment Strategist and a Partner at Cambridge Associates.
About Cambridge Associates
Cambridge Associates is a global investment firm with 50+ years of institutional investing experience. The firm aims to help pension plans, endowments & foundations, healthcare systems, and private clients achieve their investment goals and maximize their impact on the world. Cambridge Associates delivers a range of services, including outsourced CIO, non-discretionary portfolio management, staff extension and alternative asset class mandates. Contact us today.