VantagePoint: Disruption, Demographics, and Decoupling


Advice in Brief
The start of a new year and a new decade is an opportune time to reflect on megatrends that will be consequential over the next ten years. In this edition of VantagePoint, we focus on three such trends and their investment implications:
- Disruption: Evaluating technological waves provides useful insights that help explain why value stocks have seriously lagged growth stocks since 2007. Diversification across growth, value, and other exposures seems sensible today given value’s prospects for revival. Technology remains a worthwhile investment and provides a complementary exposure to value.
- Demographics: As the world’s population ages, consumption patterns are likely to change, resulting in less demand for some goods and services, like clothing and automobiles, and more demand for others, like healthcare and senior housing. A related theme is urbanization, with both millennials and aging societies fueling demand for urban real estate.
- Decoupling: The United States and China may have reached a trade truce, but some further decoupling should be expected. Trade and technology decoupling have potential to cause mutual economic pain, while the United States is particularly vulnerable should the trade war morph into a financial war. The first line of defense for investors under such conditions should be geographic diversification across asset classes and fundamental economic exposures. We continue to recommend investments in public and private Chinese equities, while enhancing due diligence practices to incorporate an understanding of the changing investment landscape.
DISRUPTION, DEMOGRAPHICS, AND DECOUPLING. The start of a new year and a new decade is an opportune time to reflect on megatrends that will be consequential over the next ten years. In this edition of VantagePoint, we focus on three such trends and their investment implications:
- Disruption. Evaluating technological waves provides useful insights that help explain why value stocks have seriously lagged growth stocks since 2007. Diversification across growth, value, and other exposures seems sensible today given value’s prospects for revival. Technology remains a worthwhile investment and provides a complementary exposure to value.
- Demographics. As the world’s population ages, consumption patterns are likely to change, resulting in less demand for some goods and services, like clothing and automobiles, and more demand for others, like healthcare and senior housing. A related theme is urbanization, with both millennials and aging societies fueling demand for urban real estate.
- Decoupling. The United States and China may have reached a trade truce, but some further decoupling should be expected. Trade and technology decoupling have potential to cause mutual economic pain, while the United States is particularly vulnerable should the trade war morph into a financial war. The first line of defense for investors under such conditions should be geographic diversification across asset classes and fundamental economic exposures. We continue to recommend investments in public and private Chinese equities, while enhancing due diligence practices to incorporate an understanding of the changing investment landscape.
Disruption
Technology has transformed society in many ways over time, revolutionizing the way we live and work. Less discussed has been the influence of technological waves on investment opportunities. Technological waves provide perhaps the most promising means for understanding the exceptionally deep and long period (2007 to present) of value underperformance relative to growth stocks. Without a review of technological waves, it would be tempting to conclude that value investing is dead.
The current period resembles the midpoint of the last technological wave—age of oil, automobiles, and mass production—during which value stocks underperformed growth stocks for nearly 15 years by a considerable margin. As technological waves last anywhere from about 45 to 60 years, we don’t have a lot of market data to analyze performance at specific points during multiple waves, but the logic is sound and the similarities between the current and prior cycle are instructive. Our analysis gives credibility to the potential for value stocks to significantly outperform over an extended period when the broad economy and population meaningfully benefits from technology. Timing is a major uncertainty, as the spread of prevailing technology across the global economy has been broad but shallow, suggesting more time is needed before value stocks will have their next decade (or two) in the sun. Shorter, cyclical periods of outperformance relative to growth, such as value’s recent nascent leadership, can certainly transpire in the interim.
Anatomy of a Technological Wave
Economist Carlota Perez laid out a general framework for understanding technological waves in her 2002 book, Technological Revolutions and Financial Capital. Starting with the Industrial Revolution, there have been five consecutive technological waves, which begin when new technologies cluster, building on each other to create economic and societal transformation and ending in economic stagnation as technologies mature. These periods can last the better part of a century. While each period has differences, there are some similarities:
- Tech revolutions have two main phases: Installation and Deployment.
- An Installation Phase begins when the prior tech wave is mature, and a new wave of technology becomes necessary to avoid stagnation and advance profitability. New technologies “irrupt” and are explored through experimentation. Use cases begin to take shape and new standards replace those from the last tech revolution in a period of creative destruction. During this phase, society increasingly sees the potential for new technologies and invests in infrastructure that enables widespread adoption, leading to a frenzy of investment activity. New innovators ultimately get rewarded, and wealth becomes skewed to the new economy. This phase can last about 20 to 30 years but is only the dawn of the new technological era.
- The ability of innovative tech sectors to absorb investment is limited, and the installation period ends in a frenzy of investment that builds into a major market bubble, like canal mania in the 1790s, railway mania in the 1840s, stock market mania in the 1920s, the technology, media, and telecom (TMT) sector in the late 1990s, and the financial/real estate sectors in the mid-2000s that ended with the Global Financial Crisis.
- The bubble bursting marks the start of the transition period between Installation and Deployment of technology—a phase Perez refers to as the Turning Point. The depth and breadth of this difficult and turbulent period (often marked by recession) varies considerably and may include multiple investment bubbles. As new technologies evolve, the rift between old and new economy companies grows and unemployment increases due to new efficiencies and disruption of old business models. According to Perez, a key determinant of the transition period’s length is the degree to which governments engage in designing and applying policy that sets the stage for expansion in the new technology era. In addition, as highlighted by O’Shaughnessy Asset Management (OSAM), 1 the Turning Point of the last cycle is also when growth outperformance is strongest, as the trend is just beginning, and growth expectations are high.
- As new technologies become accepted and pervasive, the Deployment Phase This phase is marked by high real economic growth as the technological revolution spreads across the whole economy. Businesses move from building infrastructure to building the application layer on top and from creative destruction to creative construction. Value stocks that have been depressed, often the result of competition from new entrants embracing disruptive technologies, begin to benefit from these new technologies and surprise strongly to the upside, entering a long cycle of outperformance. Winners emerge, oligopolies tend to form, and the market enters a mature phase with slower growth, setting the stage for the next technological wave to begin.
PHASES OF A TECHNOLOGICAL REVOLUTION
Degree of Diffusion of the Technological Revolution • Time
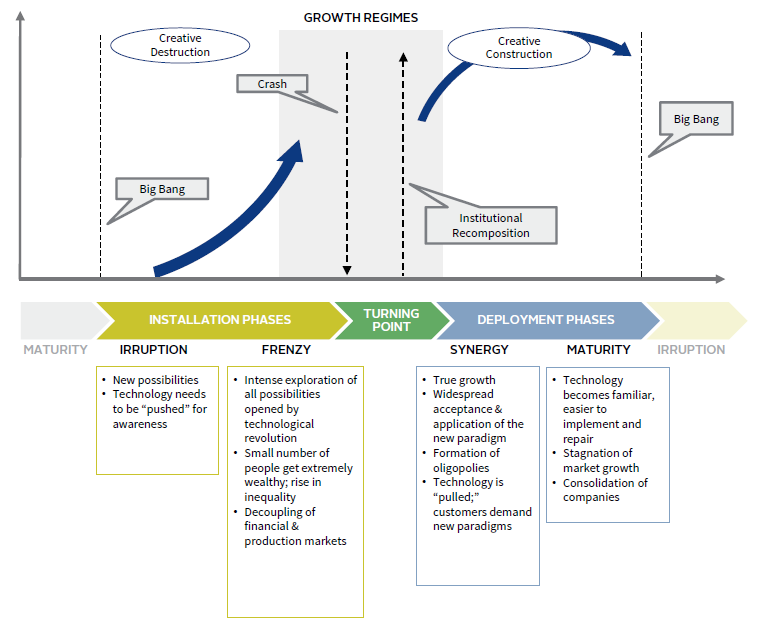
Sources: Carlota Perez and O’Shaughnessy Asset Management.
TIMING OF THE FIVE TECHNOLOGICAL REVOLUTIONS
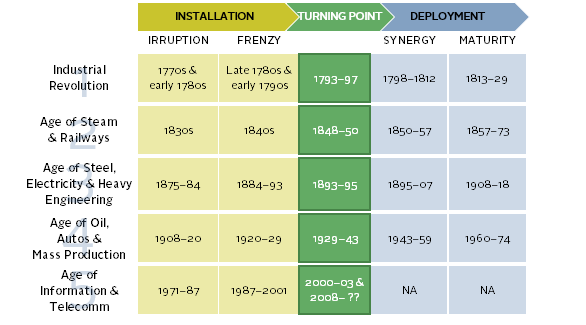
Sources: Carlota Perez and O’Shaughnessy Asset Management.
Timing the Wave
The critical question for value investors is when the Turning Point will end, giving way to the Deployment Phase. There are some indications we are getting close, but there is no way to precisely time this transition. In fact, given how long these cycles last, we only have growth and value relative performance data for the fourth technological revolution (age of oil, automobiles, and mass production lasting from 1908 to 1974) and the current revolution that is in process.
It seems clear that we are still in the Turning Point of this technological wave. A comparison of the relative performance of growth and value during these two technological phases reveals how well the fourth technological wave lines up with relative performance of growth versus value. Value underperformed growth from 1927 to 1941 but then experienced a dramatic turnaround during the Deployment Phase, particularly during the first part (or synergy phase) before the technological wave reached maturity. The relative performance of the current cycle, starting with the Turning Point, lines up quite similarly. However, the magnitude and duration of the Turning Point has little to do with timing, as previously discussed.
VALUE UNDERPERFORMS DURING TURNING POINTS AND OUTPERFORMS DURING THE DEPLOYMENT PHASE
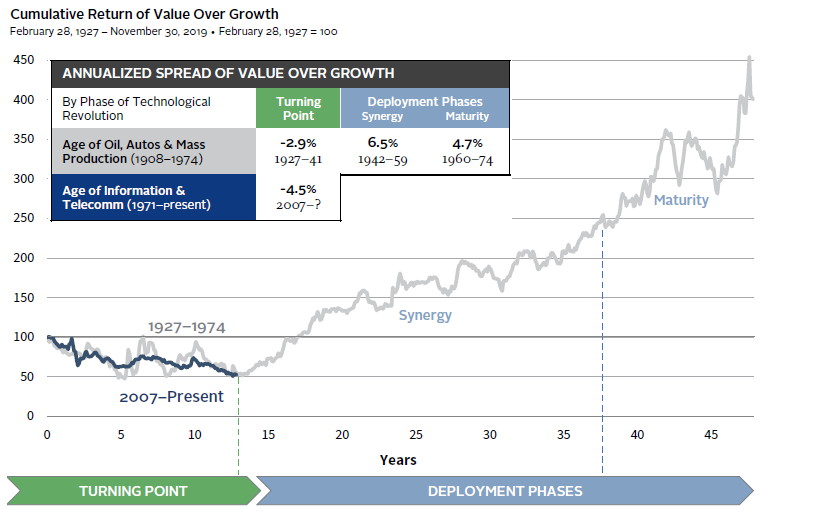
Sources: CRSP, Ken French Data, and O’Shaughnessy Asset Management.
Notes: Turning Point start date represents the peak in cumulative relative value to growth returns, based on data since June 30, 1926. All other dates are based on O’Shaughnessy analysis.
Another indication that we are still in the Turning Point phase is the high level of economic concentration among beneficiaries of new technologies. Much has been written about the growing concentration of wealth and income today, like the lead up to and aftermath of the Great Depression, which marked the start of the Turning Point of the fourth tech wave. We see similar parallels in economic sector concentration of public equity market capitalization. Based on OSAM’s analysis of the fourth wave, the technological development was concentrated in the manufacturing sector, which accounted for 65% of the market capitalization of growth stocks, in contrast to just 19% of value stocks on average during the Turning Point. Within value, utilities (the leader of the third technological revolution) had the highest weighting in the value index. Today, tech sectors are dominant in growth and financials in value. As was the case in the last technological revolution, sector differences have accounted for more than half of value’s underperformance during the Turning Point, to date.
TURNING POINTS ARE MARKED BY SECTOR CONCENTRATION
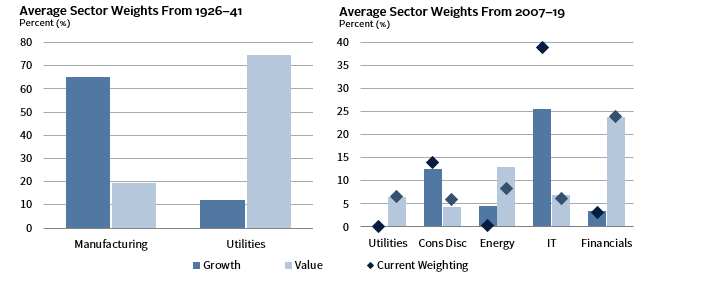
Sources: CRSP, FactSet Research Systems, Frank Russell Inc., O’Shaughnessy Asset Management, and Standard & Poor’s.
Notes: Sectors are not shown if the Growth minus Value index relative weight differential is less than 5 percentage points. The 1926–41 dataset is based on S&P 500 companies. O’Shaughnessy Asset Management (OSAM) constructed the Value/Growth indexes using CRSP data and their own analysis. Sector classifications are based on the North American Industry Classification System (NAICS) and Standard Industrial Classification (SIC). The 2007–19 dataset is based on the Russell 1000® Growth and Value indexes and data from December 31, 2007, to December 31, 2019. Sector classifications are based on GICS. Average weights are calculated using FactSet’s Brinson Attribution Analysis report. Percentages may not add up to 100 because some constituents do not have a defined GICS classification.
While much more subjective, a key indicator of where we are in the cycle is the degree to which new technologies have pervaded into the broad economy, helping the transition from creative destruction to creative construction. The example of the fourth technological wave is instructive. Several technologies were developed at the same time, leading to the development of affordable, mass produced automobiles that operate on cheap gasoline. The “big bang” moment that kicked off the Installation Phase was Henry Ford’s opening of an assembly line plant that cheaply produced a car every two minutes. As the technological revolution moved into Deployment, assembly lines and mass manufacturing became commonplace. US government policies subsidizing home purchases and the development of the suburbs paved the way for a massive self-reinforcing growth cycle. These policies increased not only demand for cars but also demand for a variety of other mass-produced products like appliances for new homes, fostering an ideal environment for value outperformance.
Today, we also have a cluster of new technologies that began with the big bang moment of the development of cheap microprocessors in the early 1970s. As the cluster evolved and venture capitalists provided financing, innovation continued to spread. Tech’s diffusion to the broader economy is happening without regulatory or legislative nudges, disrupting much of the economy via e-commerce, mobile devices, and cloud computing. However, we see continued opportunities for technology to address more challenging areas like energy (renewables displacing oil & gas) and electric vehicles, while the use of robotics and artificial intelligence is just getting started. Even as many corporations have used enterprise software to improve operations, there are still far more problems to solve than there are solutions.
Investment Conclusions
Evaluating technological waves provides useful insights into long investment cycles that help explain why value companies have seriously lagged growth companies since 2007. However, the analysis does little to help with specifics on timing. Diversification across growth, value, and other exposures seems sensible today given value’s prospects for revival. We also recommend the following related to our analysis of technological waves:
- Maintain exposure to value today. We would be at least neutral on value, recognizing we can’t time the change in the cycle and that value is especially cheap relative to growth. History suggests that once we move from the Turning Point to the Deployment Phase, value stocks will enjoy a long period of outperformance.
- Focus on active management. Given the influence of sector concentration in relative performance of growth and value indexes, active managers that take a more diversified approach may deliver stronger returns. Sector concentration of value indexes is largely tied to anachronistic accounting practices that require expensing of intangibles like research & development, brands, and intellectual property, while requiring amortization of tangibles, such as property, plant, and equipment. In other words, accounting practices themselves have not kept up with the evolving new capital-light economy. Investors that move away from indexes that define growth and value based on distorted price-earnings and price-to-book metrics can enhance returns through additional fundamental analysis to define true value.
- Continue to selectively invest in technology. Experienced early-stage venture capital, lower market buyouts, and growth equity managers offer appeal and a good complement to value. Also, look for opportunities to invest in technologies that are being applied to more traditional industries, such as electricity generation and food.
Demographics
Investors face two clear demographic trends: a slowdown in the global population growth rate and an aging population. The implications of the former for economic growth may be offset by other factors, such as productivity and workforce participation. Asset returns can decouple from macro given the primacy of valuations. In contrast, aging and the related topic of urbanization are demographic themes that involve changing consumption patterns and thus clear investment opportunities. Certain real estate and infrastructure strategies seem well positioned to capitalize on these trends, while implications for other asset classes are more nuanced.
Two Clear Trends
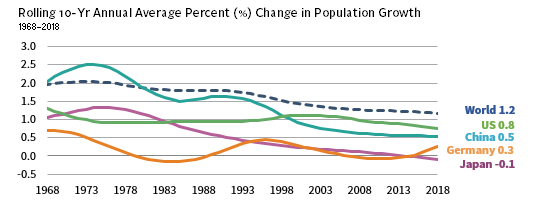
Population growth is slowing globally but more gradually than is often suggested. The 1.2% average expansion of the world’s population over the past decade is virtually identical to the growth rate seen the previous decade. Growth has been fastest in Africa (averaging 2.6% per annum), while Europe’s population has barely budged (0.2%). The US population has expanded around 0.8% per annum, similar to the overall rate in Asia (1.0%), though the latter figure masks wide dispersion across countries (e.g., Japan at -0.1% versus Pakistan at 2.1%).
POPULATION GROWTH IS SLOWING MORE GRADUALLY THAN MANY SUGGEST
Source: United Nations – Population Division.
Note: Data are from the World Population Prospects 2019 report.
Populations are also aging due to falling fertility rates and increasing longevity. Globally, birthrates have halved since the 1960s (from around 5 to 2.4), 2 and numbers are even lower in most developed countries. Meanwhile, the share of the population aged 65 or older has increased from 6% in 1980 to around 9% today. Japan has led this change with 28% of the population falling into this category, almost three times the share seen in 1980. Many European countries like Germany (21%) are not far behind, while emerging and populous economies, such as China (11%) and India (6%), help lower the global average.
Murkier Impact on Growth
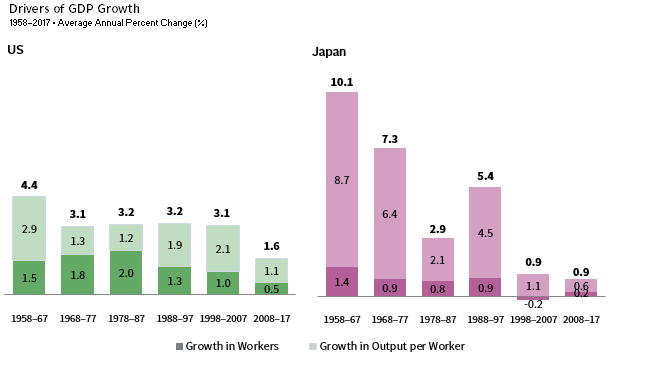
Economic theory suggests slowing population growth equates to slowing economic growth, and many see empirical support for this in trends across many developed economies. The following chart suggests waning population growth has subtracted around 50 basis points per annum of US GDP growth over the past decade compared with the prior period, and trends in birthrates (barring what happens with immigration) suggest this will be an even larger drag going forward.
POPULATION GROWTH IS NOT ALWAYS THE MAIN DRIVER OF ECONOMIC GROWTH
Source: Penn World Tables.
Still, the significance of demographics on growth can be easy to overstate. Economic growth is not just a function of adding more workers; it also is driven by how many hours they work and their productivity. Robust periods of GDP growth in Japan (1960s and 1970s) and India (2000s) were not accompanied by similar population booms. Looking forward, advances in technology (robotics, artificial intelligence, etc.) could help dull the impact of shrinking labor pools. Boosting labor force participation can also help shore up growth. Despite an aging and shrinking population, Japan’s workforce has expanded in recent years—in part, due to broader participation from women and older workers.
Potential Impacts on Asset Classes
The impact of demographics on asset prices in theory is murky and in practice is difficult to isolate from many other competing forces. Aging labor forces could depress productivity and thus real wages, reducing inflation and allowing bond yields to drop. A related dynamic is that aging societies boost savings and reduce consumption; these forces are often cited as suppressing yields in economies, such as Japan and the eurozone (though aggressive central bank bond buying has also come into play).
The problem is that the opposite might also be true—aging populations might boost inflation. Some economists believe that an increasing ratio of consumers to producers, as proxied by dependency ratios (ratio of old and young to each worker) should mean higher price levels, 3 especially if aging workers are less productive. More certain is that older Americans currently spend less than younger ones, 4 but their elevated wealth levels relative to the rest of the population and healthcare inflation could shrink these differentials over time.
The impact of demographics on equities is equally ambiguous. Declining demand should translate into reduced earnings growth and could reduce equity values given lower future expected distributions. On the other hand, slower growth and lower inflation, if accompanied by low enough interest rates (and discount rates), could boost the present value of future company cash flows. Starting valuations can dwarf these effects over even intermediate timeframes. Despite Japan’s weak economic growth over the past decade, its stock market was one of the best performers globally given the tailwind of low starting valuations. The subject of aging and investor preferences is also divisive. Aging baby boomers might spend down savings and move to safer fixed income investments as they grow older, lowering equilibrium stock valuations. Still, the concentration of wealth in some countries (10% of boomers own 75% of their cohort’s stock wealth in the United States, for example) might reduce the need for such sales and dull their impact on equity prices.
More Certain Takeaways
Demographic trends may have uncertain impacts on bonds and stocks, especially in the short run, but some of their implications for consumption may be more clear cut. Whether or not consumption will rise or fall in aggregate, its composition is likely to shift as societies age. Demand for items, such as healthcare, senior housing, and possibly delivery services, will steadily rise in years ahead, while conversely appetite for items, such as clothing, dining out, and automobiles, may fade.
AGING WILL MEAN CONSUMPTION CHANGES
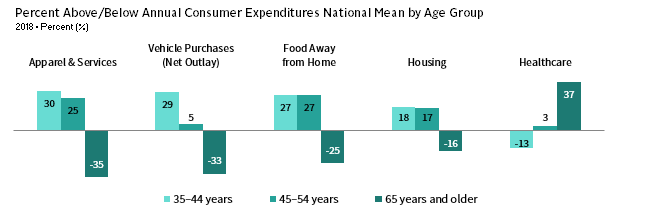
Source: US Department of Labor – Bureau of Labor Statistics.
Note: Data are from the 2018 Consumer Expenditure Survey, which is conducted by the US Bureau of Labor Statistics and was published on September 10, 2019.
The potential stakes are enormous for sectors and thus investors. Per capita healthcare spending by Americans aged 65 to 84 is almost twice as much as for those aged 45 to 64. A key reason is government-sponsored Medicare—for which around 10,000 Americans become eligible every day. This math is behind projections that US healthcare spending (already around $3.6 trillion per annum), will grow around 5.5% annually over the next decade, much faster than underlying economic growth. Likely, beneficiaries include drug companies, medical device manufacturers, outpatient facilities, and senior living providers. Growing demand (and concerns over affordability given that eligibility ages might be pushed back for government programs) could also increase demand for health insurance.
Aging also has implications for real estate and related asset classes like infrastructure. The percentage of Americans that live in urban areas has risen slowly from around 74% in 1970 to around 81% today. Older populations may favor urban real estate, given easier access to healthcare and a diminished desire or ability to drive. They may also require less space and lack interest in maintaining large homes. These dynamics are behind growing demand for apartments (and assisted-living developments), as well as office space to accommodate their service providers. Over the past 15 years, the homeownership rate in the United States has dropped from 69% to 65%, equating to 10 million additional renters. Americans age 55 and older have driven an outsized share of the increase in rental demand. Demand for (mainly urban) apartments is also being driven by the rising millennial population, which for various reasons (including student loan burdens and reduced tax incentives) is said to prefer renting versus owning. These trends have significant implications for the transportation industry. Goldman Sachs estimates that ride hailing may grow from a $65 billion market in 2017 to nearly double that by the end of this year. In contrast, US sales of new cars and light trucks seemed to have peaked in 2016.
Ecommerce is another important theme related to demographics and changing preferences. Today around 11% of US retail sales take place electronically, more than double the share of just eight years ago. Millennials make around 60% of their purchases online, suggesting the share may rise in the future. Real estate funds that focus on logistics may be poised to benefit at the expense of some strategies focused on malls and shopping centers.
Investment Conclusions
Demographic trends are typically clearer than their investment implications. All other things being equal, slower population growth should mean slower economic growth, but other dynamics (productivity) can come into play, and stock market returns can often decouple from economic activity for extended periods. Population aging seem to have more certain investing takeaways. As baby boomers age, demand for healthcare and apartments are likely to continue rising. Demand for other goods (e.g., meals outside the home) may also fall but longer life spans and higher savings levels may challenge this historical precedent. The bar should be high for making investments around this theme. In a similar vein, the growing market power of millennials and their different consumption preferences have clear implications for some companies and investment strategies (e.g., those involved in ecommerce and ride hailing), but more vague takeaways for others. Given this uncertainty, we suggest trying to play demographic themes in a tailored fashion, investing in areas (e.g., healthcare, senior housing) most likely to see increased future demand.
Decoupling
United States and China relations have undergone a fundamental shift, leaving investors to wonder if the countries’ close economic ties will unravel and what that portends. Decoupling pressures fall into three main areas: trade, technology, and capital flows. Higher tariffs pressure corporate profits and consumers’ wallets, raising prospects for costly shifts in global supply chains. National security concerns are driving the governments of United States and China to limit access to each other’s technology in sensitive areas. Most recently, US policy makers have been discussing means to curtail US investment in Chinese corporations even as China continues to expand access to its capital markets. US-China integration has passed its peak, and some decoupling is likely, though any material amount of decoupling will be difficult and gradual. Trade and technology decoupling have potential to cause mutual economic pain, and the United States is particularly vulnerable should the trade war morph into a financial war.
Trade Truce for Now
The “Phase One” trade agreement, scheduled to be signed on January 15, has provided a much-needed truce in the tariff escalation between the United States and China, as trade uncertainty has weighed on financial conditions and further slowed global trade. Structural disagreements run deep on critical topics, such as intellectual property protections and technology transfer requirements for market access, suggesting that this truce is vulnerable. As long as US negotiators view tariffs as leverage to influence these outstanding issues, further tariff escalation remains a risk. Markets have rallied hard on the news of an agreement, and we can expect this trade-inspired volatility to continue.
Tariffs have pushed up the cost of producing US-sold goods in China (to the degree that they have not been offset by a weakening RMB), leaving companies to revisit China’s appeal as a production center. Some migration has already taken place, although recent moves reflect some shipment rerouting to circumvent tariffs.
At the same time, China is somewhat more insulated from the effects of higher US tariffs than generally thought, with exports as a share of GDP down to 20% from 34% in 2005 and increasingly geographically diversified. Indeed, since the end of 2018, China has tilted its export mix away from the United States and toward Europe and emerging markets. Chinese goods exported to the United States total only about 4% of GDP.
Even before the trade war escalated, higher Chinese labor costs had already enticed some manufacturers to move production to lower cost producers (e.g., Vietnam). There are limits, however, on the ability of other countries to handle the same types of manufacturing done in China. China’s tech and capital goods-focused export bundle is hard to replicate. The bulk of Chinese exports to the United States are tech products, industrial capital goods, and inputs to the supply chains of those industries. No one country can replace China’s quality and quantity of goods production. Any material supply chain shift will take substantial investment and considerable time. If the tariff impact is significant and prolonged enough, supply chains will ultimately shift, starting with new production capacity and ultimately leading to some movement of existing capacity (rendering some manufacturing and distribution infrastructure obsolete). The net impact will be to increase costs to manufacturers as they adjust their supply chains to the evolving trade dynamics, dampening demand and squeezing profits. Winners include low-cost manufacturers that can develop skills to take share from Chinese manufacturers, in countries that can improve their infrastructure to handle increased trade.
TRADE WAR IS BEGINNING TO HAVE IMPACT
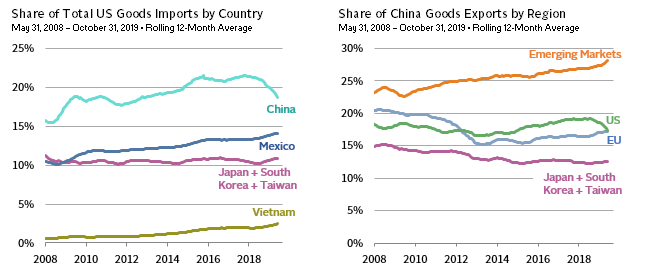
Sources: Administration of Customs of China, Thomson Reuters Datastream, and US Census Bureau.
Stuck Between a Rock and a Hard Place
In large part, conflicts over technology have fueled the United States’ harder stance on trade with China. The United States is using tariffs as leverage to push China on more sensitive tech issues, particularly technology transfer and intellectual property. Even as both countries have legitimate national security concerns it is difficult to imagine a full separation of the technology world into China and US spheres. Technology supply chains are highly complex, utilizing increasingly specialized companies that cross multiple national borders. Further, the stark reality is that China relies heavily on US manufacturers for certain core technology expertise, while US companies are heavily reliant on the Chinese market for revenues. The blurred lines between commerce and national security complicate negotiations, leaving both countries stuck between a national security rock and an economic hard place.
The United States and China have long restricted access to domestic markets and expertise for critical technologies in the name of national security, but the United States and China have ramped up barriers tit-for-tat, raising the odds of partial decoupling of the technology sector. In recent years, China has slimmed down foreign investment requirements that give rise to forced technology transfer and has improved its enforcement of intellectual property protections. 5 However, in 2019 China began increasing requirements for certifications, reviews, and approvals related to national security concerns 6 in response to United States’ moves, such as the US’ stricter enforcement of the Committee on Foreign Investment in the United States (CFIUS) and broader use of its Entity List to deny US technologies to foreign firms that pose a national security or foreign policy concern. Ironically, the main effect of the US’ export controls has been to drive Chinese companies to double down on efforts to eliminate reliance on foreign (especially US) technologies. 7
The Nikkei Asian Review estimates that despite dedicating resources to developing semiconductors since the 1950s, China is only about 15% self-sufficient today. As for the United States, large semiconductor companies generate as much as 40% to 60% of their revenues in China. A rapid transition to eliminate cross-border sales of technology components and expertise would strike to the core of both countries’ tech sectors. While it may take a decade or longer for China to fill the gaps in its technology capabilities, investors must recognize that in a bifurcated tech world, China’s tech products have more appeal to customers in faster growing emerging markets that more closely resemble China’s market a decade ago, while US tech products are more marketable in developed markets. US efforts to clip Chinese tech companies’ wings could deliver a long-term advantage to China through improving their domestic technological capabilities and pushing them to focus on less developed emerging markets with higher growth potential. In the near term, tech companies in Taiwan, South Korea, Japan, and Europe may benefit from a lift in Chinese demand, as virtually all Chinese electronics companies are seeking to reduce their dependence on US tech companies and will seek interim solutions in other markets as they build their internal capabilities.
Financial Decoupling Could Be a Problem for the United States
As discussed in our 2020 Outlook, we believe tensions between the United States and China will rotate from trade to investment. Actions to expand the reach of the CFIUS have already reduced merger & acquisition activity between the United States and China. More recently, bi-partisan United States legislative proposals would limit US investment in China. 8
As tensions flare, a consensus is building in China among noted market reformers that China needs to build long-term defenses against American hegemony. For example, Lou Jiwei (former Chairman and CEO of China Investment Corporation and The People’s Republic of China’s Minister of Finance) says China needs to protect itself in a financial war between the United States and China and advocates for “independent international clearance systems” for cross-border payments. Similarly, Zhou Xiaochuan, former PBOC governor, has advocated for China to increase use of the RMB in international transactions following the United States’ official labeling of China as a currency manipulator in August 2019.
Thus far, despite rising tensions, China has further opened its domestic markets and worked to attract foreign investors. Indeed, China has every incentive to keep moving in this direction—the country requires foreign inflows, as its large current account surplus has shrunk to a narrow surplus or even deficit at times. Additionally, China requires access to foreign capital to deal with its stressed banking sector. Expanded use of equity financing will facilitate corporate deleveraging, while expanding access to China’s government bonds will aid fiscal expansion. China is unlikely to close off its markets to outside investors unless aggression by Western governments forces its hand.
Investors should take note that the balance of power rests with China in this battle. Consider that US policy toward China could starve the US economy of the foreign capital it requires to fund its current account and fiscal deficits. China holds $1.1 trillion worth of US Treasuries, in contrast to US investors, who hold less than $200 billion in Chinese stocks and bonds. China would certainly miss investment from the United States, but it is not dependent specifically on US capital.
We would not expect China to retaliate against the United States by selling US Treasuries, as that would hurt both parties. However, a reduction in demand for additional purchases could push yields higher and the US dollar lower. Indeed, China’s reduced current account surplus has naturally decreased Chinese demand for US Treasuries, as they have fewer US dollars to recycle. Thus far, there has been more talk than action on the financial war front. While both the United States and China stand to lose, the United States is more vulnerable.
FINANCIAL DECOUPLING COULD BE A PROBLEM FOR THE UNITED STATES
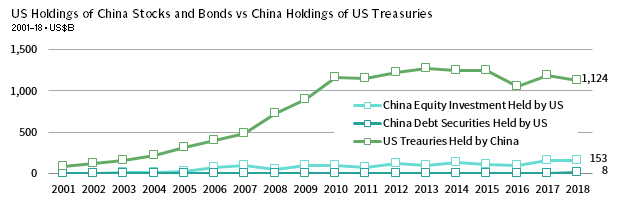
Sources: IMF Coordinated Portfolio Investment Survey (CPIS) Database, US Department of Treasury, and Thomson Reuters Datastream.
Notes: Data for equity and debt securities held by US are based on CPIS. CPIS provides information on portfolio investment securities, not including direct investment or reserve assets, held by residents (i.e., central bank, deposit-taking corporations, other financial corporations—such as insurance corporations, pensions funds, and money market funds—general government, nonfinancial corporations, households, and nonprofits institutions serving households). US Treasuries Held by China data are from the US Department of Treasury’s TIC dataset.
Investment Conclusions
The United States and China may have reached a trade truce, but any full resolution of the wide-ranging issues they are negotiating is impossible in the near term. Some decoupling of the US and Chinese economies should be expected. However, total decoupling is not feasible any time soon and would entail meaningful cost for both sides. The first line of defense for investors under such conditions should be geographic diversification across asset classes and fundamental economic exposures. Additional decoupling investment themes include the following:
- Overweight public Chinese equities relative to global equities. The relative appeal of Chinese equities has increased as trade tensions, along with slowing Chinese economic growth, have disproportionately hurt Chinese assets. Even as risk assets have rallied sharply following news that a “phase one” trade agreement has been reached, Chinese public equities offer relative appeal. US and global equities have reached new highs, and valuations have outpaced earnings growth, putting much faith in future earnings potential. Mainland Chinese equities have also rallied but remain attractively valued, leaving more room for both upside surprise and downside protection. Over time, should tensions in the tech sector continue as we anticipate, Chinese equity investors may also benefit from China’s push to become self-reliant and move to focus on faster-growing emerging markets.
- Use active management in Chinese public equities. Chinese public equities’ asymmetric return profile offers appeal even on a passive basis, although we recommend active management for implementation, given the inefficient, retail-dominated market and wide-ranging prospects for companies. Consider that as equity markets open and companies sell shares to deleverage their balance sheets, investors in public indexes dominated by overleveraged banks stand to get diluted more than investors in active managers attuned to such dynamics. In addition, while we don’t expect the United States to require Chinese companies to delist from US exchanges, as the impact would be too harsh on US investors, any effort to force US investors to divest from China would strike a blow to the $1 trillion market capitalization of US-listed Chinese companies. Active managers have an opportunity to navigate such risks.
- Evaluate the risk of cross-border investment restrictions as part of Chinese and US private equity and venture capital (PE/VC) due diligence. These restrictions have potential to change fundraising dynamics in PE/VC, particularly in China, where US limited partners have large market share. Non-US investors could benefit by taking advantage of newfound fund capacity at more attractive valuations. In contrast, Chinese investment in US-operated PE/VC funds has been relatively limited and any major pullback by Chinese investors should not have any material impact. It is unlikely that either country would place a broad ban on cross-border PE/VC investments. The bigger risk is the degree to which funds are investing in areas related to national security interests. Due diligence should incorporate an understanding of the degree to which any fund is focused on sensitive areas and should exercise appropriate caution.
- Rebalance any overweight positions to US assets and the US dollar back to policy targets. China will continue to open up and deregulate its capital markets unless forced to retaliate against Western aggression. Should a financial war escalate, US assets, and particularly the US dollar, remain vulnerable. The US dollar is expensive, and the US dollar bull market that started in 2011 appears long in the tooth. Add in the United States’ fiscal and current account deficits, and the greenback appears poised for poor long-term results. In the near term, the US dollar will be influenced by the risk environment, as the US dollar tends to appreciate in risk-off environments and may continue to see support from the relative economic growth and interest rate outlook. Investors with a long-term horizon would be wise to rebalance US exposures if they are overweight.
Conclusion
As we commence a new decade, we recognize the risks and opportunities that lie ahead and seek to plant the seeds for success in the future. Technology continues to bring creative destruction, but if history serves as a useful guide, deployment of advancements across the broad economy will ultimately benefit value stocks, which currently sell at steep discounts to growth stocks that price in a perpetually rosy future. Technology remains a worthwhile investment and provides a complementary exposure to value. We would look to incorporate tech opportunities likely to benefit more traditional, old economy businesses. Demographic trends’ impact on prospective investment returns are far from certain. We suggest setting the bar high by focusing on demographic themes (e.g., healthcare, senior housing) most likely to see increased future demand. Finally, the relationship between the United States and China has fundamentally changed, and decoupling has begun to take a toll on prospective returns. We recommend overweighting Chinese public equities relative to global equities, as they better price in risks and may also benefit from strategic advantages over time in the event of continued tensions in the tech sector. The United States may be most vulnerable to financial decoupling given the high level of Chinese investors in US assets, particularly Treasuries, when the US dollar is expensive and foreign financing needs are growing. Rebalancing overweight positions in US assets and the US dollar back to neutral is a sensible defensive measure.
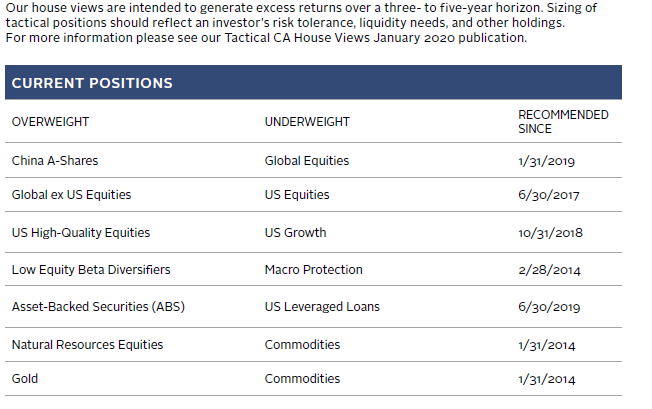
OVERVIEW OF TACTICAL CA HOUSE VIEWS
December 31, 2019
Index Disclosures
Russell 1000® Growth Index
Russell 1000® Growth Index contains those Russell 1000 securities with a greater-than-average growth orientation. Securities in this index tend to exhibit higher price-to–book and price-earnings ratios, lower dividend yields, and higher forecasted growth values than the value universe.
Russell 1000® Value Index
The Russell 1000® Value Index contains those Russell 1000® securities with a less-than-average growth orientation. It represents the universe of stocks from which value managers typically select. Securities in this index tend to exhibit low price-to–book and price-earnings ratios, higher dividend yields, and lower forecasted growth values than the growth universe.
S&P 500 Index
The S&P 500 Index gauges large-cap US equities. The index includes 500 leading companies and captures approximately 80% coverage of available market capitalization.
Footnotes
- Chris Meredith, “Value Is Dead, Long Live Value,” O’Shaughnessy Asset Management, July 2019.
- Birthrates are expressed as births per adult female.
- For example, please see, Mikael Juselius and Elod Takats, “The Age-Structure–Inflation Puzzle,” Bank of Finland Research Discussion Paper, no. 4 (April 2016).
- According to the BLS 2018 Consumer Expenditure Survey, households age 65 and older spend on average nearly $51,000 per annum, 17% less than the average for all households.
- China has lifted joint venture (JV) requirements for much of the Chinese economy, with such conditions only required for sensitive sectors today (such as media). In 2018, the government announced a schedule for the removal of JV requirements in remaining key sectors, most notably automobiles (foreign electric vehicle companies can already operate wholly owned subsidiaries) and financial services. China’s new foreign investment law will also impose criminal penalties on government officials who share trade secrets with domestic companies that were learned during regulatory reviews, although enforcement remains an open question.
- For example, China enhanced its Multi-Level Protection Scheme to require certification of internet-of-things devices, mobile network, and cloud computing systems and announced new cybersecurity review measures governing purchase of technology products and services for critical information infrastructure. Most recently, Beijing has required all government offices and public institutions to swap out foreign computer equipment and software with Chinese products over the next three years, although it is not clear how feasible this order is or how “domestic” will be defined.
- For example, the China National Integrated Circuit & Industry Investment Fund launched a second phase investment of 204 billion RMB (US$ 29.1 billion) to accelerate China’s progress toward semiconductor self-sufficiency. China also launched a new 147.2 billion RMB (US$20.9 billion) investment to improve China’s manufacturing capabilities.
- Potential policies discussed include de-listing Chinese companies from US exchanges, preventing US government pension funds from investing in China, and limiting China’s exposure in investment benchmarks calculated by US companies.
Wade O’Brien - Wade O’Brien is a Managing Director for the Capital Markets Research team at Cambridge Associates.
Celia Dallas - Celia Dallas is the Chief Investment Strategist and a Partner at Cambridge Associates.
About Cambridge Associates
Cambridge Associates is a global investment firm with 50+ years of institutional investing experience. The firm aims to help pension plans, endowments & foundations, healthcare systems, and private clients achieve their investment goals and maximize their impact on the world. Cambridge Associates delivers a range of services, including outsourced CIO, non-discretionary portfolio management, staff extension and alternative asset class mandates. Contact us today.