VantagePoint: First Quarter 2019


Advice in Brief
For investors that weathered the late 1990s, the current environment seems all too familiar. Relative asset class performance over the last five years has been quite similar to that experienced during the second half of the 1990s. Diversified portfolios have underperformed simple 70% stock/30% bond benchmarks, while the majority of active managers have failed to outperform increasingly popular passive benchmarks. Tech stocks have outperformed all other sectors, US equities have outperformed all other major regions, and value stocks have underperformed. In this edition of VantagePoint, we compare and contrast the late 1990s and today; our intent is to help investors navigate this recent downturn and the next recession-related bear market (which may already be in progress), and to position their portfolios for long-term success.
- We do not expect venture capital to repeat its lost decade of the 2000s. Within venture capital, we are focused on smaller funds, earlier stage, markets outside of California, and healthcare.
- Small-cap stocks are not particularly cheap today and are relatively vulnerable in the United States, given high valuations and poor fundamentals.
- While real assets are not cheap like they were in the late 1990s, we do see bright spots in looking at smaller managers focused on secular themes and diversifying strategies.
- And we believe that, like during the 2000s, some recent losers will become winners in the next recession-related bear market and subsequent bull market: global ex US equities, value, active management, and hedge funds.
1998 Redux? For investors that weathered the late 1990s, the current environment seems all too familiar. Tech and telecom stocks and venture capital outperformed everything else by a considerable margin, especially value stocks. Tech, which was largely a US story, propelled US equities to outperform all other regions. Active managers underperformed, especially long-only US equity managers. A hawkish US Federal Reserve and relatively strong economic growth led to a strong US dollar, which in turn strained emerging markets. Real assets lagged behind, and commodity prices sank. Investors began asking, “Why not invest 100% in US equities?” and “Are diversification, value investing, and active management dead?”
We single out 1998, as that was when late-cycle strains started to negatively impact the market, similar to 2018. But in 1998, the Fed reversed course and eased to support the economy during the fallout from the Asian Financial Crisis. Monetary policy easing increased liquidity and settled the markets, which helped extend the bull market through early 2000. Now some investors are expecting something similar today—that US and especially Chinese stimulus will boost the global economy and lift markets—sort of a repeat of 2015/16. We are skeptical, and expect more incremental policy shifts designed to stabilize growth.
In this edition of VantagePoint, we compare and contrast the late 1990s and today; our intent is to help investors navigate this recent downturn and the next recession-related bear market (which may already be in progress), and to position their portfolios for long-term success.
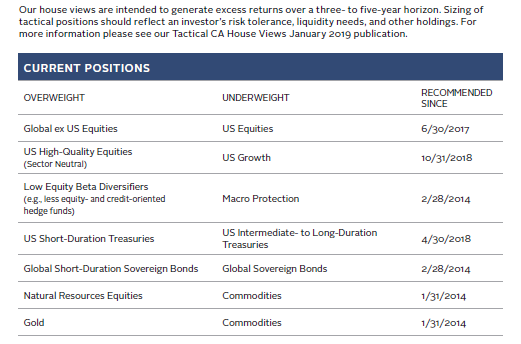
OVERVIEW OF TACTICAL CA HOUSE VIEWS
January 2019
At a Crossroad
Similar to 1998, the current bull market cycle may still have some legs. In July 1998, global equity markets sold off sharply, with the S&P 500 Index falling 19.3% in less than two months before bouncing back. The market retraced all of its losses within three months, supported by aggressive Fed stabilization efforts.
At the time of this writing, a number of equity markets across the globe are in bear market territory, having fallen more than 20% from prior peaks. The S&P 500 fell 19.8% peak-to-trough last fall before recovering some ground and narrowly escaping a technical bear market. The September 20 peak may well end up being the market peak this cycle, but with few signs that a US recession is near, the recent market turbulence may be an extreme correction rather than a more pernicious bear market.
Clearly, central banks and global economies do not have the capacity to ease monetary and fiscal policy in the way the Fed did in 1998. The Fed has sounded a bit more dovish in recent statements, signaling that it will only raise rates twice in 2019 and that it would not hesitate to change course on rate hikes and balance sheet normalization given ample evidence that it would serve its mandate, but an actual cut in rates is not in the cards without recessionary conditions in the United States. At the same time, China is more focused on growth stabilization than economic acceleration. While China provided a wave of stimulus on multiple occasions this cycle, more economic pain would be needed to push China to such aggressive stimulus levels, with 2015 serving as a potential guide.
The future of this cycle is not just dependent on monetary and fiscal policy. Numerous issues are creating considerable uncertainty for the economy and markets. These include trade tensions, primarily between the United States and China; resolution of Brexit negotiations; tensions in the EMU especially related to Italy and France; continuation of the partial government shutdown in the United States; and longer term, the general movement away from globalization and toward nationalism and populist policies.
Even if 2018 ends up being the high point for equities this cycle, and we have a recession within 18 months, we could still see positive returns from equity markets this year. As we pointed out in our recently published 2019 Outlook: Even if global equity earnings expectations for this year come down to historical averages of about 6%, with a 2% dividend yield, that combo yields a baseline return potential of about 8%. Continued stress with rising discount rates could see multiples contract, reducing returns, or positive surprises on trade or other fronts could generate multiple expansion. Further, valuations—and therefore prospective returns—are more attractive today than they were just three months ago. Regardless of these outcomes, investors should recognize that over a three- to five-year investment horizon, a US (and possibly global) recession and accompanying bear market is likely. Even though the Fed was able to extend the cycle in 1998, the market cycle was just over a year from concluding even as recession was two years away. Investors that prepared for the end of the market cycle may have underperformed in the short term, but ultimately benefited.
What Happened When the Bubble Eventually Popped?
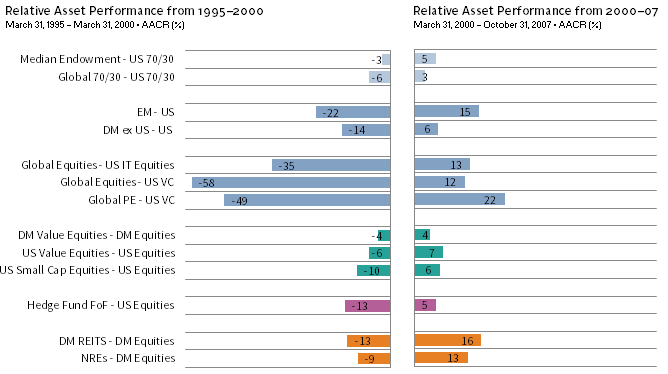
Relative asset class performance over the last five years has been quite similar to that experienced during the second half of the 1990s. Diversified portfolios have underperformed simple 70% stock/30% bond benchmarks, while the majority of active managers have failed to outperform increasingly popular passive benchmarks. Tech stocks have outperformed all other sectors, US equities have outperformed all other major regions, and value stocks have been left behind. One important difference in asset class performance trends is that all real assets, not just natural resources, struggled in the late 1990s.
When the bear market began in March 2000, relative performance trends reversed, even as all equities produced negative absolute returns. During the bear market:
- US equity returns were roughly in line with those of other markets, in contrast to their usual defensive status. Value stocks were cheap enough that they experienced about half the decline of the broad market, and cheap real assets produced positive returns, while tech stocks were so expensive that they experienced nearly twice the decline of the overall market. Venture capital also underperformed, but not as severely as public tech stocks.
- Active management, which had been maligned as the bubble inflated, paid off in spades, as headwinds facing skilled managers abated.
- Bonds and long/short hedge funds produced strong returns, while the broad hedge fund universe was flat.
- All of these shifts led diversified portfolios to resume leadership over simple 70% stock/30% bond benchmarks.
MOST LAGGARDS BECAME RELATIVE WINNERS AFTER THE TMT BUBBLE POPPED
Sources: Cambridge Associates LLC, FTSE International Limited, Hedge Fund Research, MSCI Inc., and Thomson Reuters Datastream. MSCI data provided “as is” without any express or implied warranties.
Notes: All returns are total returns. Equity returns for Emerging Markets, Developed ex US, and Global 70/30 are gross of dividend taxes prior to 2001 and net thereafter; all other MSCI index returns are net of dividend taxes. Global Private Equity, US Private Equity, US Venture Capital, Private Real Estate, and Private Natural Resources, and Median Endowment data are quarterly and all other data are monthly. The 2000–07 returns for private indexes and median endowment end September 30, 2007.
Once the bear market ended, most of these trends persisted. The relatively cheap companies that struggled through the late 1990s handily led in the next cycle. Assets in emerging markets with cheap currencies and newly found fiscal discipline outperformed, as did developed ex US market equities, hedge funds, value stocks, private equity, and real assets (especially real estate). All saw significant appreciation in the bull market from 2002 to 2007, while US equities, growth stocks, and venture capital lagged behind. Furthermore, while the S&P 500 recovered its previous high-water mark by mid-2007, the tech sector did not achieve that same feat until July 2017, even though it more than kept pace with the broad market during the 2002–07 expansion.
The question for investors today is whether we can expect similar reversals. Considerable similarities and differences between the late 1990s and today will influence the degree to which the future for these asset classes looks like that of the 2000s. The remainder of this report provides our perspectives on a variety of major asset classes through this lens.
Tech and Venture Capital for the Long Term
Over the last decade, the information technology sector has once again grown to be the largest in the MSCI All Country World Index (ACWI), 1 due to both the listing of large tech firms and to the sector’s outperformance. As in the 1990s, investor interest in the sector is high. VC firms are raising larger funds, and fundraising cycles are shortening. The number of founders starting companies, new VC firms being formed, crossover investment activity, corporate venture capital, and new LP interest have increased significantly. VC valuations have reached new highs (notably at the growth stage/large-cap end of the market); and expectations are lofty, with “dot-com” mania replaced by all things artificial intelligence (AI).
Despite these striking similarities to the tech bubble era of the late 1990s, the differences between now and then are even more sweeping. The VC industry has matured, and technology has become more integrated into the global economy. In short, today’s public technology firms generate significant profits in diverse businesses across many economic sectors, while private tech companies are generating significant revenues. We expect that today’s era of tech dominance may well end differently (and less painfully) than the last one.
Access to technology has increased at a staggering pace. Smartphones, social networks, and e-commerce is now commonplace. Over the past two decades, the percentage of the world’s population with internet access has exploded from 4% to 55%. There are now three times as many smartphones as there are PCs, and the number of mobile devices exceeds the global population. The widespread availability of mobile devices and cloud computing have allowed large technology-enabled businesses to disrupt traditional industries such as transportation, hospitality, financial services, and media and entertainment. Companies like Uber, Lyft, Airbnb, and Spotify have only been around for the last decade or so, but have shifted consumer behavior considerably. At the same time, healthcare is transforming in this information age, stemming in part from a maturing biotech industry.
Valuations for public tech shares today are more rational than in the 1990s: today, valuation multiples are lower and stronger business models drive higher profitability. The 20 largest tech companies today have higher return on equity (ROEs), return on assets, and much higher profit margins than the tech giants of 1998. Though today’s high profitability supports valuations while it lasts, it raises questions about eventual mean reversion. Given the high operating leverage many of these companies experienced as sales have increased (e.g., Amazon, Alphabet, and Netflix), will the downside for these companies be accentuated? Large tech companies have been able to offset some degree of cyclicality by taking market share from legacy competitors, which can persist for a while, but not indefinitely.
The technology landscape has also become increasingly complex. Different countries have divergent views on data privacy, concerns about security in this information age, and the role of regulation in the market—both in tech and in life science industry. To date, Facebook has borne the brunt of many of these concerns, while Europe has led the charge on consumer data privacy rights with General Data Protection Regulation (GDPR) in 2018. China has made remarkable strides in AI technology given its access to data and heavy governmental involvement. However, it is unclear how its technological capabilities will progress amid potential supply chain disruptions and limitations on technology transfer. Complexity presents investment opportunities, but also highlights the regulatory and geopolitical risks investors need to consider.
TECH COMPANIES ARE MORE PROFITABLE TODAY
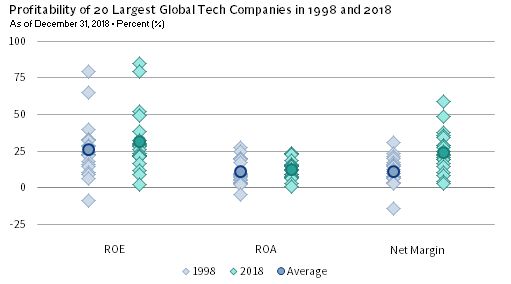
Sources: FactSet Research Systems and MSCI Inc. MSCI data provided “as is” without any express or implied warranties.
Notes: Global tech companies include the information technology and communications services sectors, and the internet & direct marketing retail industry within the consumer discretionary sector in the MSCI All Country World Index. Data for 2018 are as of September 30 and are on a trailing 12-month basis.
On balance, while we do not expect a repeat of the late-1990s lost decade, we regard the tech sector as vulnerable in the next bear market. Further, we suspect that market leadership will rotate from the tech sector to other sectors (perhaps accelerated by access to growth-promoting technology) in the next expansionary cycle. With regard to venture capital, the flood of capital available and stiff competition in the market will likely compress returns on average. However, we still see investment opportunities, particularly in some less trafficked segments, while remaining wary of others.
US venture capital has seen an influx of capital, particularly at the growth stage or large-cap market. Established VC firms are raising larger funds and often dedicated growth funds amid fierce competition at the later-stage segment. Much of the capital is concentrated with firms based on the West Coast and in tech, with tech representing roughly three-quarters of market value and healthcare, one quarter, based on our benchmarks. In terms of new commitments, we favor smaller funds focused on early-stage investments, opportunities outside the Bay Area, and healthcare. We also like opportunities tied to the convergence of tech and impact investing, such as improving access to healthcare, financial products, and education. Tech is increasingly enabling business models that address these social issues to be economically viable. Millennial founders are helping to drive interest in these opportunities, but investors also see the economic rationale in building more sustainable supply chains and reaching a broader consumer set.
Chinese venture capital has seen explosive growth, particularly within innovative tech and internet markets, but remains a relatively young market. Increased government control of tech companies, as well as constraints from trade wars and limitations on technology transfer, create uncertainty, but the large addressable market offers significant upside in both tech and healthcare.
The tech markets in Europe and Latin American are both relatively small, but worth investors’ attention. In Europe, the start-up ecosystem is strengthening; there have been some notable tech IPOs, healthcare innovation is strong, and funds are developing global customer bases with less reliance on the US market. Fewer Europe-focused GPs with smaller war chests and less interest from US funds have led to lower overall valuations at least for now.
Latin America has seen strong tech adoption and a growing start-up market. Latin American growth equity and venture capital provide investors with direct exposure to companies leveraging technology to offer products and services to the middle class, such as mobile banking platforms and online real estate marketplaces not accessible via public markets. The exit market is weak, and geopolitical risks and macro headwinds persist, but this is a market worth watching.
US Primed to Underperform Global ex US Equities
US equities are primed for a reversal of fortune relative to other developed markets and emerging markets, but the timing is highly uncertain. Over the market cycle that began in 2009, the magnitude of US outperformance compared to other developed markets and emerging markets combined, and compared to developed markets alone (for which we have a longer history) is at a record high on a cumulative basis. The duration of the outperformance is also unprecedented. US equities have outperformed other developed markets equities for 11 years, breaking the nine-year record set during the 1990s. The prolonged period of outperformance has brought relative valuations to the highest level on record.
In addition, the profitability of US equities has been higher this cycle than in the late 1990s, even excluding tech stocks. US margins have been elevated for a considerable amount of time, supporting higher US equity valuations relative to the rest of the global equity market. Therefore, just as large US multinational companies have benefited disproportionately from globalization, productivity scale, low interest expenses, and the like, they also might experience outsized margin contraction should these forces move in the opposite direction.
However, two considerations raise caution in underweighting US equities relative to the rest of the world’s equity markets. Namely, US equities are not as expensive in absolute terms today as they were in the late 1990s, especially after the late-2018 decline, and US equities and the US dollar both tend to be relatively defensive in recession-related bear markets, as discussed in our last edition of this publication. The 2000–02 bear market was relatively unique in that US equities underperformed developed and emerging markets equities in common currency terms, although the underperformance was pretty tiny. It is certainly possible that US equities could again underperform in a bear market. Indeed, the market underperformed other developed and emerging markets in the market sell-off in fourth quarter 2018.
US EQUITIES ARE POISED FOR UNDERPERFORMANCE … EVENTUALLY
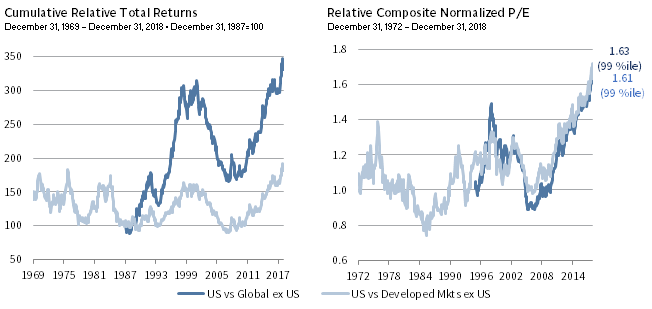
Sources: MSCI Inc. and Thomson Reuters Datastream. MSCI data provided “as is” without any express or implied warranties.
Notes: “Global ex US” equities are represented by the MSCI All Country World ex US Index and “Developed Markets ex US” equities are represented by the MSCI EAFE ex Japan Index. Total returns are net of dividend withholding taxes, except for MSCI All Country World ex US Index returns prior to 2001. The composite normalized price-earnings (P/E) ratio is calculated by dividing the inflation-adjusted index price by the simple average of three normalized earnings metrics: ten-year average real earnings (i.e., Shiller earnings), trend-line earnings, and return on equity–adjusted earnings. All data are monthly. Performance and valuation data for global ex US begin January 1988 and November 1995, respectively.
Given where we are in the US economic cycle and the improvement in US equity valuations, investors should keep US equity underweights small relative to global ex US equity markets, with the goal of increasing such positioning amid a recession-related sell-off.
US EQUITIES ARE EXPENSIVE, BUT NOT AS STRETCHED AS THEY WERE IN 1998 OR AT THE SUBSEQUENT MARKET PEAK
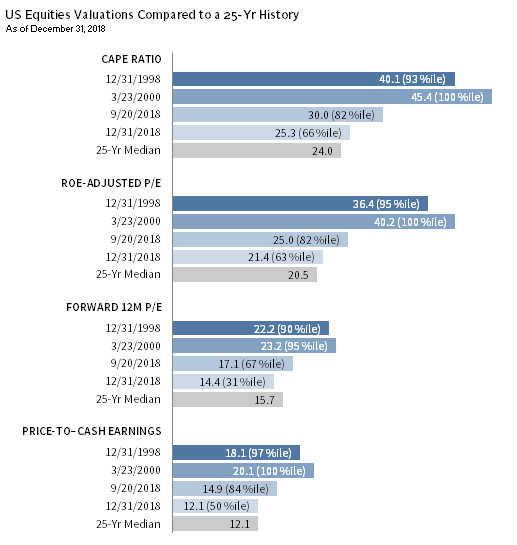
Sources: I/B/E/S, MSCI Inc., and Thomson Reuters Datastream. MSCI data provided “as is” without any express or implied warranties.
Notes: Forward P/E data are calculated by I/B/E/S, all other data are calculated by MSCI Inc. Data are monthly.
Value Stocks Will Take the Lead
As we have discussed numerous times, value stocks appear cheap enough today to do well into a bear market and through the next bull market cycle. Since our data begin in 1978, US value stocks underperformed growth in four of seven bear market declines of roughly 20% or greater. 2 The exceptions are the recession-related bear markets from 1980 to 1982 and from 2000 to 2002 and the brief, but sharp bear market in 1987. During both prolonged recession-related declines, relative valuations began the bear market below their 10th percentile—a level where valuations trade today in the United States and in developed markets in aggregate.
Tilting toward value may hurt if the tech and growth rally resumes, especially if financials and energy stocks remain weak. However, we anticipate value will outperform in a recession-related bear market and continue that outperformance into the next bull market, as was the case in the 2000s. For now, we would move slowly to overweight value, waiting for relative momentum to improve.
Mixed Outlook for Small Caps
In contrast to the late 1990s, small caps have outperformed large caps since the current market cycle began in early 2009, with the MSCI World Small Cap Index returning 14.4% annualized compared to 12.1% for the MSCI World Index of mid- to large-cap stocks. Over the last five years, performance has been more mixed, with global small caps underperforming by about 70 basis points (bps) annualized largely driven by US small caps, which underperformed US mid to large caps by over 250 bps. At the same time, small caps led by a considerable margin in the United Kingdom, Europe ex UK, and Japan. Similar to value stocks, small-cap stocks tend to underperform large-cap stocks in equity bear markets. The only exception since our data began in 1978 was in the 2000–02 bear market, during which small caps, after years of underperformance, were extraordinarily cheap in relative terms—a condition that is not present today. 3
Small-cap stocks arguably face more domestic policy and political risk than large caps, particularly in Europe given ongoing Brexit uncertainty and concerns regarding Italy’s high debt burden under the new populist government. However, small caps can provide important diversification by offering greater exposure to secular growth themes (e.g., those involving new technologies, services, or markets), less government involvement, and less vulnerability to currency and commodity volatility. The global small-cap universe is also less efficient than the large-cap space and therefore may provide more opportunities for particularly skilled active managers to add value over time.
IN CONTRAST TO 1998, SMALL CAPS ARE NOT RELATIVELY CHEAP

Sources: Frank Russell Company, Ned Davis Research, Standard & Poor’s, and Thomson Reuters Datastream.
Notes: The composite normalized price-earnings (P/E) ratio is calculated by dividing the inflation-adjusted index price by the simple average of three normalized earnings metrics: ten-year average real earnings (i.e., Shiller earnings), trend-line earnings, and return on equity–adjusted earnings. All data are monthly. Bear markets are based on a peak-to-trough change in the S&P 500 Price Index in USD terms of at least 19%.
US small caps are comparatively vulnerable in an economic slowdown or in a slow growth period with rising rates. Their vulnerability stems from weak fundamentals that are not appropriately priced in, even after their significant fourth quarter 2018 decline. US small caps trade at a 33% valuation premium to large caps. Though below the historical median relative valuation, this premium appears unwarranted when considering that US small-cap EPS growth has actually lagged that of large caps, as reflected in the historically wide gap between small-cap and large-cap ROE that exists today.
Further, US small caps have higher exposure to US-China tariffs and greater vulnerability to rising interest rates. Small caps have thinner profit margins than large caps, and with weaker pricing power, passing along higher import costs to customers would be challenging. At the same time, small caps have high debt levels with predominantly floating-rate debt and shorter maturities relative to larger-cap issues. Roughly a third of the Russell 2000® US Small-Cap Index is unprofitable from a GAAP earnings standpoint, with more than 40% of negative earners consisting of early-stage biotech and pharma companies, many of which do not have products on the market and may not turn a profit for several years.
Given their more domestic orientation, US small caps are benefiting more than large caps to varying degrees from lower taxes and less regulation (along with higher US growth relative to many non-US economies, to which large-cap multinationals are more exposed), but these differences are well known and may already be largely priced in. Additionally, small caps’ higher exposure to a relatively healthier US consumer sector could be neutralized by rising import inflation as a result of trade restrictions.
The bottom line is that if growth disappoints or macro volatility increases, it could disproportionately impact small caps, given valuations do not provide much of a buffer today (in 2000, they were cheaper than large caps). Further, they have greater cyclicality, and in the United States, weaker profitability and more leveraged balance sheets.
Improving Backdrop for Active Management
While the majority of active managers typically underperform indexes, due to the drag of fees and transaction costs, there are structural conditions that heavily influence the ability of managers to outperform market indexes. A higher percentage of active managers tend to outperform when managers’ structural overweights relative to benchmarks, including out-of-benchmark positions outperform, when the average stock in the index outperforms the largest stocks, and when cash outperforms the index.
Taking US equity managers as an example: between 1995 and 1999 and between 2010 and 2017, the majority of managers underperformed the fee-adjusted benchmark at a time when the structural conditions for active manager outperformance were generally not present. However, as the 1990s demonstrated, these conditions do not last forever, and when they lift, more active managers should outperform.
KEY DRIVERS OF ACTIVE MANAGEMENT SUCCESS HAVE BEEN CHALLENGING
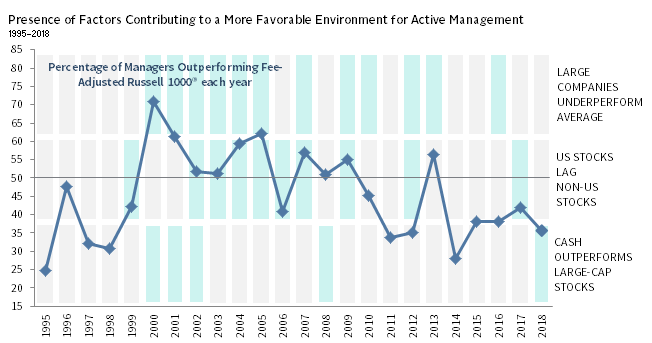
Sources: Cambridge Associates LLC, FTSE International Limited, Intercontinental Exchange, Inc., MSCI Inc., and Thomson Reuters Datastream. MSCI data provided “as is” without any express or implied warranties.
Notes: Factors are represented by: cap-weighted S&P 500 from 1995–99 and cap-weighted Russell 1000® Index thereafter (“large companies”), equal-weighted S&P 500 Index from 1995–99 and equal-weighted Russell 1000® Index thereafter (“average companies”), MSCI US Index (“US stocks”), MSCI EAFE Index (“non-US stocks”), ICE BofAML 91-Day Treasury Bills (“cash”), and Russell 1000® Index (“large-cap stocks”). Cambridge Associates LLC’s (CA) manager universe statistics are derived from CA’s proprietary Investment Manager Database. Managers that do not report in US dollars, exclude cash reserves from reported total returns, or have less than $50 million in product assets are excluded. Performance is generally reported gross of investment management fees. We have added 60 bps to the Russell 1000® Index return as a proxy for manager fees. To be included in analysis of any period longer than one quarter, managers must have had performance available for the full period.
Three market developments may have exacerbated active managers’ struggles over the past decade:
- Quantitative easing has arguably suppressed the dispersion of asset price returns;
- Investors have bid up a handful of disruptive technology stocks resulting in narrow market leadership; and
- Equity markets have been strongly bullish for most of the decade, particularly in the United States.
We believe these challenging conditions are starting to fade. In particular, market volatility and asset price dispersion could be set to rise as central banks pull back on quantitative easing. Tech stocks that have been leading the market are coming under pressure from slowing Chinese growth, trade tariffs, potential regulatory constraints, data privacy concerns, and a litany of other potential issues. The share price decline of companies including Apple and Facebook, on top of Asian tech leaders that corrected earlier last year, has raised the prospect that a larger share of companies will show relative strength. These dynamics could provide a more conducive environment for highly skilled active managers going forward. Even when these mega-cap tech stocks have been outperforming, their contribution to index returns has not been particularly outsized relative to history. However, managers that lack selection skill and do not differentiate themselves much from their benchmarks are unlikely to outperform when index heavyweights (which they tend to underrepresent in portfolios) outperform.
Broaden Your Horizons in Real Assets
The environment for real assets is vastly different from that of the late 1990s. By early 2000, real assets were generally so cheap and tailwinds so abundant that investors easily earned attractive returns in the years that followed by just being invested. In 1998, the biggest real estate bubble in recent memory—US housing—was just beginning; oil was trading at around $11 per barrel; and the commodity super cycle, powered by rising Chinese demand, was just getting started. Today, real assets are not uniformly cheap, the opportunity set has expanded, and investors have moved beyond investing in real assets primarily for their inflation sensitivity to looking more broadly at their diversification characteristics.
Of late, generating outsized returns via real assets has been difficult against a backdrop of economic and geopolitical uncertainty. While real estate fundamentals remain solid, as evidenced by continued net operating income growth above longer-term averages, growth is decelerating in this aging real estate cycle. Cap rates for all major property types are at historic lows and susceptible to rising interest rates. At the same time, resource-related assets have been highly volatile as technological developments disrupt the oil & gas supply chain. Today, a diversified basket of natural resources equities trades at nearly a 25% discount to its historical averages, while our diversified commodity basket currently trades slightly below its long-term, inflation-adjusted average, following declines in energy commodities and subsequent corporate earnings. With respect to private equity energy, hold periods are getting longer and some strategies are highly reliant on capital markets for exits, which have largely been closed. Competition for assets in the best oil-producing basins has been intense, as managers hold significant dry powder from prior-vintage funds and see a relatively finite number of investable opportunities. A decade ago, investors could generate outsized returns from exploiting market inefficiencies and benefit from technological change and rising energy prices. Today, the PE-energy landscape is extremely competitive, mature, and under stress.
The quantum of capital flowing into private real assets is also creating headwinds. In 2018, managers were targeting to raise more than $300 billion across private real estate, infrastructure, and natural resources, although some of that likely was pushed into 2019. We anticipate that competition for new deals will be hot, underwriting standards will relax, and alignment of GPs with LPs will erode, driving down returns for funds raised in 2018. Overall, returns across real assets are coming down, but a diversified real asset portfolio should be less volatile than those of the earlier era, because leverage is lower and return drivers are more diversified.
REAL ASSETS FUNDRAISING HAS REACHED AN ALL-TIME HIGH
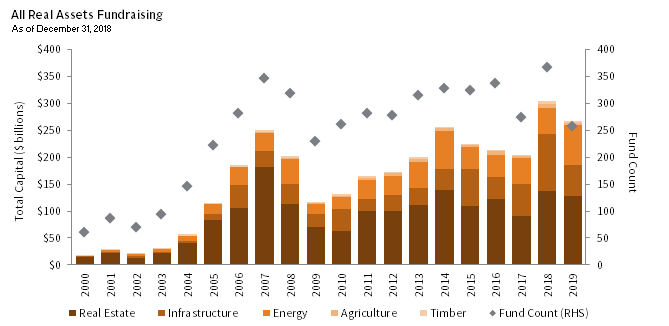
Notes: Data are composed of manager-reported figures and Cambridge Associates’ estimates. Some fundraising targeted for 2019 may extend into 2020.
While real asset returns still have a cyclical element, secular trends including shifting demographics, urbanization, and changing consumer behavior are increasingly creating investment opportunities and in some ways, de-risking real assets. With regard to demographics, the aging populations in large economies, such as the United States, United Kingdom, and continental Europe, create a secular increase in demand for senior housing and healthcare-related assets like medical offices, hospitals, and lab space. Similarly, agribusiness is benefiting from a combination of urbanization and demographics, namely population growth and a rising middle class in developing countries that are driving increased demand for animal protein. The rising demand for food has significant implications for the food value chain, from agribusinesses to infrastructure, shipping, and logistics. Increased access to technology is changing consumer trends and increasing demand for logistics and industrial assets, while increased use of smartphones is elevating demand for data centers. The return drivers for these assets are less economically sensitive, while the markets are still generally fragmented, with more operational inefficiencies for investors to exploit, relative to more traditional, pro-cyclical real assets.
Developments in renewables, which are more economically viable than they were a decade ago, also present a secular investment opportunity. Massive investment is required to meet expectations for continued growth of the renewable power generation. Despite these opportunities, implementation remains a challenge. The universe of quality managers is small but growing, while increased investor interest has materially compressed equity returns. Many investors have been priced out of the core end of the market, and have responded by moving up the risk curve into emerging markets, less proven/scalable renewable technologies such as waste-to-energy and offshore wind, or merchant power plants that incur more commodity price risk. Overall, PE energy is structurally challenged and renewables implementation is tricky, but we see opportunities in both spaces and a role for both in portfolios.
As the institutional opportunity set has broadened, institutional investors have been evolving their implementation strategy. Twenty years ago, investments in real assets tended to be synonymous with procyclical, higher-risk real estate, oil & gas, and commodities. Today, there are a number of diversifying options in real assets, including agriculture, renewables, and infrastructure, which have become more mainstream and institutionalized. Portfolio allocations are going up, in part, because lower risk real assets can provide secured income and diversification. However, the closed-end, higher-risk, PE-style funds traditionally sought after by return-oriented investors may not be the best way to implement. Rather, open-ended, lower-risk vehicles with the ability to hold assets for a long period of time, distribute income, and compound returns may be a more compelling choice. The NCREIF Open End Diversified Core Index and our private infrastructure index indicate such investments have proven reasonably defensive in recent risk-off periods for which we have data, while providing competitive full-cycle returns, outperforming more liquid hedge funds and bonds, while underperforming global equities.
Among real assets, we are emphasizing smaller, hungrier PE energy managers with a proven edge, that are less reliant on capital markets for exits. Within secular themes, we emphasize healthcare-related real estate and infrastructure, datacenters, and student and affordable housing. Within real estate, we are focused on managers who have proven their ability to generate consistent risk-adjusted returns across cycles and have the experience and capital to take action if a period of distress generates public-to-private opportunities. Lower mid-market infrastructure is less crowded and still offers good value relative to many of the mega-funds that are pursuing ever-larger deals. With regard to renewables, we are seeking out managers with unique sourcing channels and deep understanding of local regulatory regimes, technologies, and markets.
BROADEN YOUR HORIZONS IN REAL ASSETS INVESTMENTS
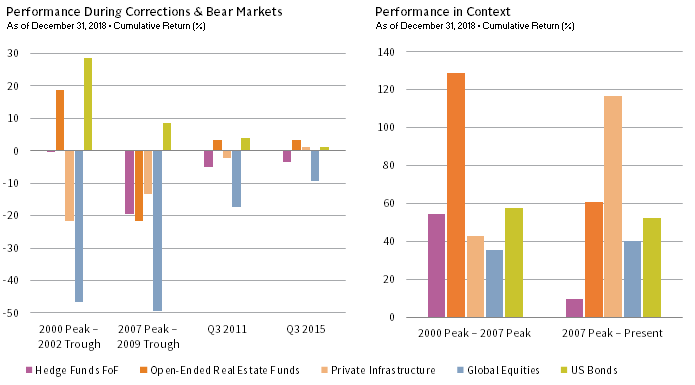
Sources: Bloomberg Index Services Limited, Cambridge Associates LLC, Hedge Fund Research, Inc., MSCI Inc., National Council of Real Estate Investment Fiduciaries, and Thomson Reuters Datastream. MSCI data provided “as is” without any express or implied warranties.
Notes: All data are quarterly. “Hedge Funds FoF” are the Hedge Fund Research Composite Fund of Funds Index; “Open-Ended Real Estate Funds” are the NCREIF Open-Ended Diversified Core Equity Index, net of fees; “Private Infrastructure” is the Cambridge Associates Private Infrastructure Index; “Global Equities” are MSCI All Country World Index, returns are gross of dividend withholding taxes prior to 2001 and net thereafter; and “US Bonds” are the Bloomberg Barclays US Aggregate Bond Index. Open-Ended Real Estate Funds and Private Infrastructure returns are through September 30, 2018. Private Infrastructure returns are based on less than 10 funds prior to 3Q 2004. Third quarter 2018 Private Infrastructure data are preliminary. Hedge Fund Research data are preliminary for the preceding five months.
Hedge Funds as a Bond Substitute?
One of the most significant changes in asset allocation over the last two decades has been a shift away from bonds as the main portfolio diversifier. While difficult to evaluate at the asset allocation level, taking a simplistic approach, we find that the average endowment and foundation, for which we have data for 1998 and today, maintained a roughly 30% allocation to bonds, hedge funds, and cash in aggregate. However, the composition of that basket has changed considerably, with investors cutting the bond allocation by two-thirds, replaced largely by hedge funds. The challenge for investors today is that high-quality sovereign bond yields are still low, suggesting returns will also be low, while hedge funds on the whole have not been providing as much firepower as they had in the early 2000s through 2007. Does it still make sense to maintain hedge funds as a bond substitute in portfolios?
In 1998, the hedge fund industry, despite having been around for decades, was still in its early stages of development with just over 3,000 funds and $375 billion in assets under management. As expected, bonds performed well during the 2000–02 bear market, returning a cumulative 28.3% based on the Bloomberg Barclays US Aggregate Bond Index. Hedge funds, represented as an average diversified program by the HFRI Fund of Funds Composite Index (HFRI FOF), produced flat returns (-0.4%)—still strong diversification compared to a -46.2% return for global equities. And over the longer term, the full cycle from the 2000 peak to the 2007 peak, hedge funds returned 61.9% cumulatively—capturing four-fifths of global equity returns and outpacing bonds.
By contrast, during the global financial crisis period (2007–09), the HFRI FOF failed to preserve capital. The index fell less than equities (21.9% versus 54.9%), providing some diversification to equity-oriented portfolios, but significantly underperformed bonds, which were the only major asset class able to generate positive returns in that environment. Hedge fund proponents hoped that the funds would, in the subsequent bull market regain ground that had been lost to bonds, but this has not yet transpired. Since the equity market bottomed in March 2009, the HFRI FOF has roughly kept pace with US bonds yet, with more volatility, leaving hedge funds well below bonds (and stocks) for the full cycle to date. From the October 2007 peak through present, hedge funds returned 7.4% cumulatively, versus 48.5% for bonds.
In a low-yield environment, such as we have today, high-quality bonds may continue to deliver weak returns as they have during the current market cycle, and increasing use of hedge funds (while recognizing they participate in market downside, just typically not fully) as a substitute for some bonds continues to make sense given their ability to provide some downside protection in exchange for giving up some market upside. Further, carefully selected hedge funds offer the potential to add diversifying return sources, including alpha, which as discussed earlier may be easier to come by in an era of central bank policy normalization. However, there are a number of factors that are worth revisiting:
- Investors that choose to shift assets from sovereign bonds to hedge funds should think carefully about the real-time impact on portfolio liquidity and the risk-reward characteristics of this change. For example, is it appropriate for a bond substitute to be a less liquid investment with meaningful equity risk, credit risk, leverage, carry trade exposure, and/or other more exotic active risks that almost certainly exhibit equity-like beta at an inopportune moment?
- Among low-equity beta hedge funds, many global macro managers build portfolios that allow them to offer daily or weekly liquidity, and therefore share an important characteristic with sovereign bonds. A potential concern is that these managers are likely to have more dynamic exposures to market risks, so it can be more challenging to know what exposures you have at any point in time.
- Higher allocations to hedge funds can increase leverage in portfolios. During a more severe market decline, leveraged managers may find themselves forced to sell positions at the very moment opportunities increase, LPs need liquidity, and prime brokers seek to increase collateral requirements. Of course, managers with less leverage are often those with more equity and credit exposure or illiquidity, so investors should fully consider these trade-offs.
- In addition, the hedge fund industry has matured and investors should have realistic expectations about alpha potential: it is unlikely to return to levels seen in the 2000s. Since 1998, the number of managers has tripled and assets under management has increased by 8.5x.
- At the same time, we have seen challenges associated with crowded positions, suggesting that more diversification within the hedge fund portfolio would be beneficial and that investors need to dedicate adequate resources to evaluate and monitor managers that serve this role in portfolios. In particular, understanding the operational stability is critical, given managers’ vulnerability to poor performance, even if temporary. Elimination of fees from carry can result in a talent drain, while firms are vulnerable to sharp capital outflows that bring assets to levels that challenge their viability.
- Trend following is a diversifying strategy worth considering. Like global macro, the strategy provides ample liquidity, plus it has been tested over decades, is not tied to equity markets, and benefits from information dispersion and ingrained behavioral tendencies.
Overall, investors are wise to seek out a more diverse set of portfolio diversifiers that includes high-quality sovereign bonds, more diversifying hedge funds, and other assets, such as private infrastructure and open-ended core real estate discussed above, or royalty funds and other forms of specialty finance. As the opportunity set expands, investors find a more diverse array of options, each with advantages and limitations.
Conclusion
There are some important differences between this period and the late 1990s that investors must consider when deciding whether to expect a repeat performance. The tech sector has matured, broadened, and become more profitable. The VC industry has evolved from a cottage industry concentrated in Silicon Valley to a global, more diversified industry with more experienced managers. US equities are not as expensive as they were in the earlier era and profitability is higher, but the market is more expensive than ever in relative terms. Small-cap equities are not cheap in absolute or relative terms and US small caps, in particular, are vulnerable. Real assets are not uniformly cheap and the opportunity set has expanded to include secular opportunities less exposed to the business cycle. And finally, the hedge fund industry is far more mature, but select funds and strategies can provide valued diversification in a low-yield environment. In sum:
- We do not expect venture capital to repeat its lost decade of the 2000s. Within venture capital, we favor smaller funds, earlier-stage investing, markets outside of California, and healthcare.
- Small-cap stocks are not particularly cheap today and are particularly vulnerable in the United States given high valuations relative to poor fundamentals. However, active managers have the opportunity to be more selective in the relatively inefficient global small-cap market.
- While real assets are not cheap like they were in the early 2000s, we do see bright spots in looking at smaller, hungrier, and better aligned managers focused on secular themes. We also see a role for real assets as diversifiers, especially in a low- yield environment.
- And just as transpired in the 2000s, we think some losers will become winners in the next recession-related bear market and into the subsequent bull market:
- US equities are poised to underperform, but timing is highly uncertain, and US equities tend to be relatively defensive in bear markets. Underweight, but be cautious about position sizing. And prepare to expand underweights relative to other equities once the United States enters recession, the Fed eases, and the US dollar starts to soften.
- Value is cheap enough that we expect it to perform relatively well in a bear market, but would proceed slowly in building overweights as momentum improves.
- Quantitative tightening and normalization of monetary policy may increase performance dispersion and market volatility, contributing to a better environment for skilled active managers.
- Hedge funds and other diversifying assets like high-quality, income-producing real assets are helpful additions to portfolios (particularly in a low-yield environment), but understand what you own and seek out truly differentiating strategies and managers with stable operations.
Index Disclosures
Bloomberg Barclays Aggregate Bond Index
The Bloomberg Barclays Aggregate Bond Index is capitalization-weighted and measures the total return of the investment-grade, taxable, US fixed income market. The index includes mortgage and asset-backed securities. Issues must have a minimum outstanding par value of $100 million and have a minimum maturity of one year.
Bloomberg Barclays Global Aggregate Bond Index
The Bloomberg Barclays Global Aggregate Bond Index is a measure of global investment-grade debt from 24 local currency markets. This multi-currency benchmark includes treasury, government-related, corporate and securitized fixed-rate bonds from both developed and emerging markets issuers.
Cambridge Associates Private Infrastructure Index
The Cambridge Associates LLC Infrastructure Index is a horizon calculation of 93 infrastructure funds, including fully liquidated partnerships, formed between 1993 and 2015. The inception date of the index is June 30, 1997. Private indexes are pooled horizon internal rate of return (IRR) calculations, net of fees, expenses, and carried interest.
Datastream World Natural Resources/MSCI World Natural Resources Constructed Total Return Index
The Datastream World Natural Resources Index consists of an 80%/20% blend of the Datastream World Oil & Gas Index and the Datastream Mining Index, respectively. Data reflect the Datatstream World Natural Resources Index from January 1986 to December 1998 and the MSCI World Natural Resources Index from January 1999 to the present.
FTSE EPRA/NAREIT Developed Index
The FTSE EPRA NAREIT Developed Index tracks the performance of listed real estate companies and REITS worldwide. The index constituents are free float–adjusted and screened for liquidity, size, and revenue.
FTSE NAREIT All Equity Index
The FTSE NAREIT All Equity REITs Index contains all tax-qualified REITs with more than 50 percent of total assets in qualifying real estate assets other than mortgages secured by real property that also meet minimum size and liquidity criteria. It is a cap-weighted series based on closing monthly price for all tax-qualified equity REITs listed on the NYSE, AMEX, and NASDAQ.
HFRI Fund of Funds Composite Index
The HFRI Fund of Funds Composite Index is equal-weighted and consists of over 800 constituent hedge funds, including both domestic and offshore funds.
ICE BofAML 91-Day Treasury Bills Index
The index represents the return of a single 91-day Treasury bill purchased at the beginning of each month and held for a full month, at which time that issue is sold and rolled into a newly selected issue. The Treasury bill selected each month matures within the following 90 days. The performance shown for the index reflects reinvestment of dividends and, where applicable, capital gain distributions, and is not subject to fees and expenses to which the fund is subject.
MSCI All Country World ex USA Index
The MSCI ACWI ex USA Index captures large- and mid-cap representation across 22 of 23 developed markets countries (excluding the US) and 24 emerging markets countries. The index has 2, 136 constituents and covers approximately 85% of the global equity opportunity set outside the US.
MSCI All Country World Index
The MSCI ACWI is a free float–adjusted, market capitalization–weighted index designed to measure the equity market performance of developed and emerging markets. The MSCI ACWI consists of 46 country indexes comprising 23 developed and 23 emerging markets country indexes. The developed markets country indexes included are: Australia, Austria, Belgium, Canada, Denmark, Finland, France, Germany, Hong Kong, Ireland, Israel, Italy, Japan, Netherlands, New Zealand, Norway, Portugal, Singapore, Spain, Sweden, Switzerland, the United Kingdom, and the United States. The emerging markets country indexes included are: Brazil, Chile, China, Colombia, Czech Republic, Egypt, Greece, Hungary, India, Indonesia, Korea, Malaysia, Mexico, Peru, Philippines, Poland, Qatar, Russia, South Africa, Taiwan, Thailand, Turkey, and United Arab Emirates.
MSCI EAFE
The MSCI EAFE Index is an equity index which captures large- and mid-cap representation across 21 developed markets countries around the world, excluding the US and Canada, including: Australia, Austria, Belgium, Denmark, Finland, France, Germany, Hong Kong, Ireland, Israel, Italy, Japan, the Netherlands, New Zealand, Norway, Portugal, Singapore, Spain, Sweden, Switzerland, and the United Kingdom. The index has 920 constituents and covers approximately 85% of the free float-adjusted market capitalization in each country.
MSCI EAFE ex Japan
The MSCI ACWI ex Japan Index captures large- and mid-cap representation across 22 of 23 developed markets countries (excluding Japan) and 24 emerging markets countries. The index has 2, 436 constituents and covers approximately 85% of the global equity opportunity set outside Japan.
MSCI USA Index
The MSCI USA Index is designed to measure the performance of the large- and mid-cap segments of the US market. The index has 622 constituents and covers approximately 85% of the free float–adjusted market capitalization in the US.
MSCI World Index
The MSCI World Index represents a free float–adjusted, market capitalization–weighted index that is designed to measure the equity market performance of developed markets. As of December 2017, it includes 23 developed markets country indexes: Australia, Austria, Belgium, Canada, Denmark, Finland, France, Germany, Hong Kong, Ireland, Israel, Italy, Japan, the Netherlands, New Zealand, Norway, Portugal, Singapore, Spain, Sweden, Switzerland, the United Kingdom, and the United States.
MSCI World Information Technology Index
The MSCI World Information Technology Index is designed to capture the large- and mid-cap segments across 23 developed markets countries: Australia, Austria, Belgium, Canada, Denmark, Finland, France, Germany, Hong Kong, Ireland, Israel, Italy, Japan, Netherlands, New Zealand, Norway, Portugal, Singapore, Spain, Sweden, Switzerland, the United Kingdom, and the United States. All securities in the index are classified in the Information Technology sector as per the Global Industry Classification Standard (GICS).
MSCI World Select Natural Resources Index
The MSCI World Select Natural Resources Index is based on its parent index, the MSCI World IMI Index, which captures large-, mid-, and small-cap securities across 23 developed markets countries. The index is designed to represent the performance of listed companies within the developed markets that own, process, or develop natural resources.
NCREIF Open-Ended Diversified Core Equity Index
The index is a capitalization-weighted, gross of fee, time-weighted return index with an inception date of December 31, 1977. Supplemental data is also provided, such as equal-weight and net of fee returns, for informational purposes and additional analysis.
Russell 1000® Index
The index consists of the 1,000 largest companies in the Russell 3000 as measured by market capitalization. The Russell 1000 currently represents approximately 92% of the total market capitalization of the Russell 3000 Index.
Russell 2000® Index
The Russell 2000® Index consists of the 2,000 smallest companies in the Russell 3000 Index as measured by market capitalization. The index is a widely used measure of small-cap stocks.
S&P 500 Index
The S&P 500 gauges large-cap US equities. The index includes 500 leading companies and captures approximately 80% coverage of available market capitalization.
Footnotes
- As of December 3, 2018, MSCI implemented changes to Global Industry Classification Standard (GICS) definitions in its indexes. The index providers have made these changes to broaden the definition of communications to include anything that sells and/or distributes information, data, and content to reflect the evolution of the sector. As a result, a portion of the information technology and consumer discretionary sectors was reclassified as communication services. Based on this new GICS construction, financials is the largest sector in the MSCI ACWI, followed by information technology.
- We do not have access to reliable, consistent data for global growth and value valuations prior to 2003, so we use US data, but believe these observations hold globally. Indeed, global value stocks outperformed growth stocks over the same periods.
- Valuation comparison for the late 1990s is based the relative ROE–adjusted P/E ratio for the Russell 2000® versus Russell 1000® indexes. Our global small-cap valuation data date back only to 2003. The relative ROE–adjusted P/E ratio for MSCI World Small Cap Index versus MSCI World Index also trades at its 45th percentile over this shorter history.
Theresa Sorrentino Hajer - Theresa Hajer is Head of US Venture Capital Research and a Partner at Cambridge Associates.
Celia Dallas - Celia Dallas is the Chief Investment Strategist and a Partner at Cambridge Associates.
About Cambridge Associates
Cambridge Associates is a global investment firm with 50+ years of institutional investing experience. The firm aims to help pension plans, endowments & foundations, healthcare systems, and private clients achieve their investment goals and maximize their impact on the world. Cambridge Associates delivers a range of services, including outsourced CIO, non-discretionary portfolio management, staff extension and alternative asset class mandates. Contact us today.