US Private Equity Looking Back, Looking Forward: Ten Years of CA Operating Metrics


Ten years ago, we were emerging from the Global Financial Crisis (GFC); the worst recession and market crash experienced in decades. With increased commitment activity and growing exposures to private investments, institutional investors needed new tools to understand the impacts on and implications for their portfolios. In response to this need, Cambridge Associates issued our inaugural operating metrics analysis.
Reflecting on the last ten years of analyses, we have seen the industry continue to evolve, from Private Equity 1.0 to 2.0, marked by increased sophistication in every aspect of finding, analyzing, and operating companies. With this evolution, private equity has also grown in importance and delivered strong absolute and relative returns. Our analyses have highlighted four key themes.
- Private equity outperformed public markets with better growth and multiple expansion.
- The tech sector was a clear winner with substantial gains in invested capital, market share, and strong returns.
- There has been an emphasis on top-line growth, as strong company performance during private equity (PE) ownership was a driver of superior returns. Firms that have been able to deliver top-line revenue increases have generally performed well.
- Small-cap companies continue to demonstrate promise, given lower entry valuations, better growth, and the ability to then trade at a higher multiple at exit.
Over the next ten years, we expect the industry to continue to mature. Many market segments benefited from the bull market of the 2010s that resulted from generally strong global growth, a stable geopolitical environment, favorable trade and outsourcing dynamics, low inflation, expansionary monetary policy, and low borrowing costs. Many of these trends have started to reverse, but private equity, with its role as a control or influential owner, should be well positioned to help guide companies through the evolving environment. We also envision a move to Private Equity 3.0, with an expansion of private equity’s operating influence to include more substantive engagement in human capital, talent, and DEI initiatives, and environmental, social, and governance assessment.
Two Decades of Growth and Evolution
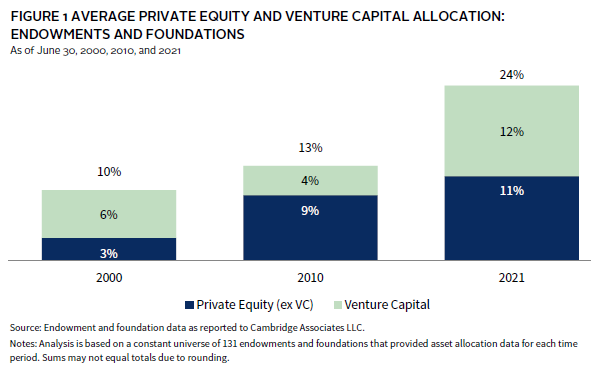
Cambridge Associates’ clients have been committing to PE funds since the industry’s early days and it’s been a growing and fruitful segment of the institutional investment market. Venture capital and private equity have been two key subsegments and represented a meaningful exposure, 10%, at the beginning of the century. That grew to 13% by 2010, and increased further, to 24%, by the most recent date of analysis in 2021. Private equity specifically increased from 3% of client exposure to 11% as of 2021 (Figure 1).
Since 2012, we’ve partnered with PE general partners (GPs), to gather and assess granular information on key risk factors, such as valuations and leverage, and key return drivers, including revenue, earnings, and margins. This approach is not novel, as similar information has been readily available for public companies for decades. However, PE markets are more opaque than public ones, and company information is just that—private—meaning institutional investors have had limited access to and a limited understanding of the exposures and risks in their PE portfolios. Through this partnership, we are able to aggregate the data and analyze PE portfolio risks, exposures, and value drivers. Further, we are able to provide insight into company progression during the PE ownership period, as GPs seek to grow companies and increase the value of their investments and compare that progression across key PE sectors and company sizes. By using indexes as proxies, we also compare private market metrics (valuations, leverage, growth, and margins) to those of similarly sized public market companies. This approach offers a more “apples to apples” comparison of how companies perform in the hands of public and private shareholders.
The industry’s growth has been driven by 1) increased awareness and commitment activity by institutional investors, 2) increased appetite by company founders and owners to access this capital source and use it to grow their businesses and diversify their ownerships, and 3) value appreciation of the underlying investments. These three elements are evidenced in Figure 2, which shows the growth in the number of companies in our US PE benchmark, as well as their cost and market value. By 2021, Cambridge Associates was tracking nearly 6,500 existing US PE-owned portfolio company investments worth over $1 trillion.

The GFC Prompt for a Deeper Understanding of PE Portfolios
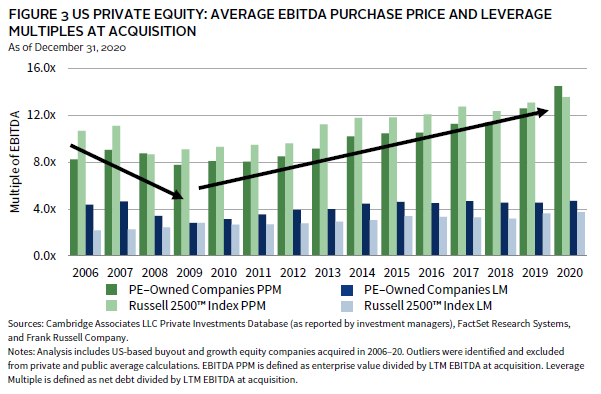
The GFC was a watershed moment for institutional investors. While it reverberated across all asset classes, the opaqueness of private equity—which had grown to be a sizable exposure for investors—made its impact difficult to assess. In the lead-up years (2006–08), the US PE industry hit all-time highs in terms of deal activity, deal size, valuation, and leverage levels. When the recession hit in 2009 and public markets sold off, there was immediate concern about the impact on PE portfolios. Would companies go bankrupt due to excessive leverage, decreasing revenue and earnings, or declining enterprise values? And how should we assess the risks, exposures, and value drivers in PE portfolios? We know now that there was an immediate and meaningful retrenchment in valuations and leverage levels (Figure 3). 1 However, the run-up to the GFC and the pull back in purchase price multiples and leverage seem almost quaint now, given the subsequent bull market in valuations and increased leverage levels that we have seen over the last ten years.
Private Equity Has Outperformed
Private equity has delivered outsized returns using the key levers of purchase price and leverage, revenue growth, and margin. Figure 4 is a summary of our analysis of the roughly 1,700 realized US buyout and growth equity companies acquired from 2000 to 2020 in our operating metrics database. As of March 31, 2022, these companies generated a gross internal rate of return (IRR) of 18.3%, and with all deals included, a gross IRR of 18.6%. In both instances, private equity vastly outperformed public markets (the Russell 2500™ Index 2 ), which returned 9.2% during this same period.
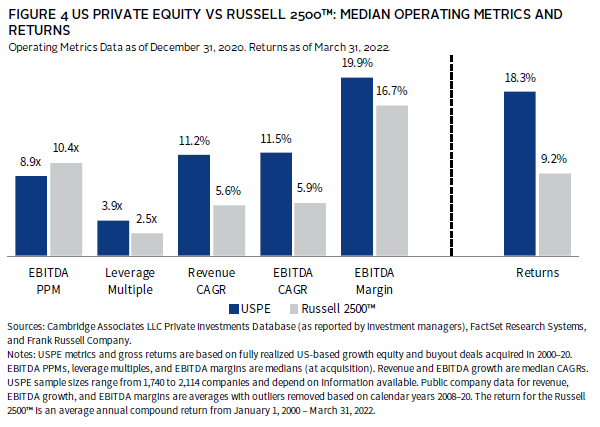
The dramatic outperformance is derived from private equity’s ability to purchase companies at lower valuations using leverage and to subsequently deliver better revenue and EBITDA growth. In our comparison of PE companies acquired from 2000 to 2020, realized PE companies in our database were acquired at a median purchase price multiple (PPM) of 8.9x EBITDA versus a median public markets valuation metric of 10.4x. When acquired, these companies operated at higher margins of 19.9% versus 16.7% in the comparable public sample. Private equity has long been viewed as a cost-cutting, corporate-raiding activity relying on margin improvement as a key lever it sought to use quite forcefully. Our analyses indicate that PE managers no longer seem to be cutting their way to value as operating margins at acquisition and at exit show no meaningful trends in the profitability of companies per unit of revenue. Rather, it’s clear PE GPs are supporting their companies’ growth aspirations as they successfully increase revenue and earnings faster than companies in public markets. Median EBITDA 3 and revenue compound annual growth rates (CAGRs) for the realized companies were more than 11%, nearly double the growth rates of the public companies. As we will discuss further, the focus on growth has driven the types and kinds of companies that private equity has pursued.
Tech Sector Clear Winner, Healthcare a Steady Second
Over the last two decades, we have seen significant increases in the amount of capital invested in private equity and meaningful shifts across sectors. Information technology (IT) and healthcare have been big winners in this reallocation, with each nearly doubling its percentage of cost from 2000 to 2021 (Figure 5). It is not just the proportion of capital flowing to those sectors that has grown, but absolute dollars have increased significantly as the cost of all investments in the US PE benchmark increased almost sevenfold from 2000 to 2021, while the market value experienced even more dramatic growth. The most notable loser has been communication services, a sector that represented 23% of PE investment in 2000 and only 6% in 2021. The sector’s makeup has changed over time, shifting from capital-intensive telecommunications projects to less capex-heavy entertainment, media, and related companies.
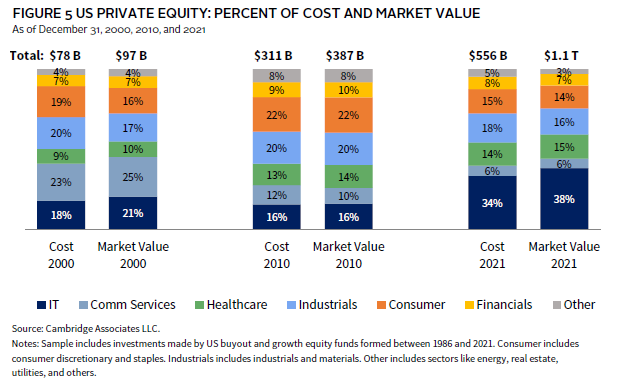
When looking at market value, the story is more extreme. At the end of 2000, the IT sector was 21% of our PE index, and at the end of 2021, exposure to IT had expanded to 38%, representing a more than 20% overweight versus the Russell 2500™ Index, a proxy for similarly sized public companies. The increased sector concentration resulted from the combination of the emergence of mega funds focused on technology and the sector’s strong performance. At the same time, healthcare exposure also grew, more fully reflecting its size and influence in the US economy, at 19.7% of GDP, as well as the increased activity in a sector historically focused on not-for-profit entities. Additionally, rising healthcare investment seems to be a move toward a more stable, non-cyclical sector with strong tailwinds, given US demographics and a move away from less stable, more cyclical industrial and consumer/retail businesses. Commitments to the formerly capital-intensive communications services segment are more likely to get funded out of real assets budgets than private equity these days.
Private Equity—A Glance at Operating Metrics by Sector
Further delving into our sector theme, when comparing operating metrics across sectors, IT commands the highest valuations and highest leverage while producing the highest revenue growth and operating at the highest margins (Figure 6). In comparison, healthcare appears to be “GARP”y (growth at a reasonable price) with better valuations, leverage levels, and EBITDA growth than IT, and better margins and revenue growth than the others. Consumer has struggled with the worst EBITDA growth and margins while transacting at higher valuations than the moderately growing industrial sector.
A closer look at return drivers for realized deals suggests some relevant takeaways as well. As a starting point, across all industries, EBITDA growth—resulting more from changes in revenue than margin—represents the primary driver for value creation. As shown in Figure 6, in three of the four key sectors, revenue growth outpaces earnings growth by 600 bps on the high side (IT) and a still notable 70 bps on the low side (healthcare), with only industrials showing earnings growing at a faster rate than revenue. Across all sectors, multiple expansion has been a second, meaningful contributor to value creation in this time period. We will discuss further in the risk section, but multiple expansion was certainly aided by the bull market and could be an area where companies struggle in a turbulent environment.

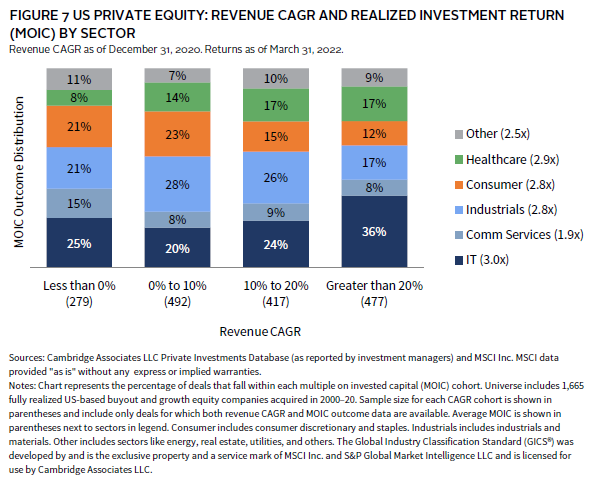
Doubling down on the growth driver, Figure 7 illustrates one reason private equity has increased its focus on IT and healthcare—the two sectors account for more than half of the strongest growers (those with 20% or higher revenue CAGRs), demonstrating better top-line growth than other sectors, such as communication services, consumer, industrials, and financials. IT and healthcare companies have earned the highest average returns (MOICs of 3.0x and 2.9x, respectively). The PE industry’s shift away from the consumer sector, explained in part by metrics highlighted in Figure 6, can also be explained by a median return of 2.2x, compared to a median of 2.8x for IT.
Top Line Growth Drove Superior Returns
Our sector analyses confirmed what previous research has indicated—growth has been a key driver of PE returns. To see how growth or the lack of it has impacted returns, we analyzed the relationship between revenue growth during PE ownership and returns for realized investments (Figure 8). Companies were grouped into one of four growth cohorts; on the low end, “negative growth,” i.e., revenue declined during the hold period, and on the high end, “strong growth,” representing growth rates of more than 20% compounded annually. “Modest growth” and “good growth” made up the middle-tier scenarios. Not surprisingly, strong growth and good growth both generated a high proportion of winners. In more than half the instances of strong growth, the investment returned 3.0x or more of invested capital. Conversely, declining revenue during the investment period resulted in the investor losing money 58% of the time.
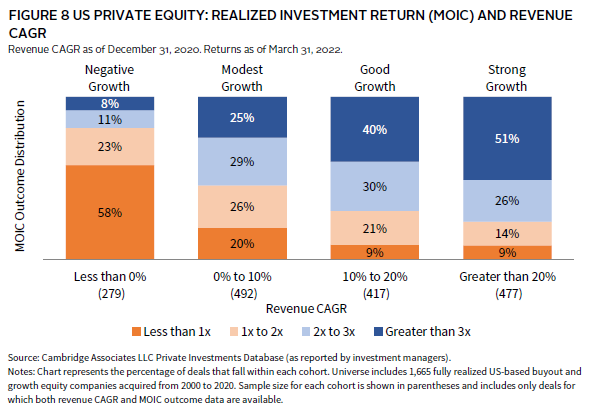
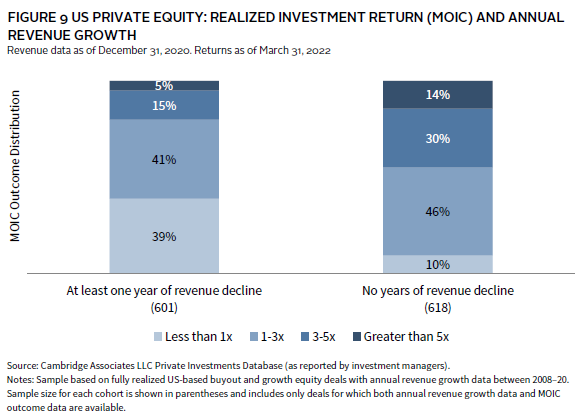
Remarkably nearly 40% of the companies experiencing at least one year of revenue decline generated a negative return during the hold period (Figure 9).
Other Return Factors
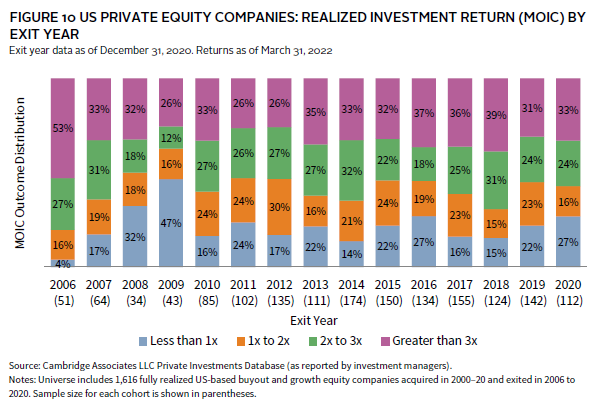
Clearly, a company’s ability to grow significantly has influenced return outcomes. Also proving to be a performance factor is the economic backdrop during ownership and, even more notably, at the time of exit, with forced sales during recessionary environments resulting in worse outcomes. From 2006 to 2020, the three recessionary years of 2008, 2009, and 2020 were the worst years for losses with 32%, 47%, and 27%, respectively, of exited deals losing money. In contrast, the percentage of deals exited at a loss across all non-recession years was 19%. As we move from a secular growth environment into choppier economic conditions, this vulnerability—due to higher leverage and finite holding periods for PE funds—warrants monitoring (Figure 10).
The Valuation-Growth Twofer
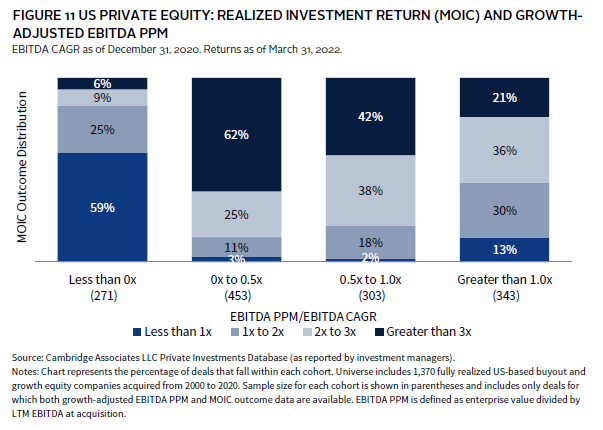
One could argue the paradigm that mattered coming out of the GFC was low valuation, while high growth seemed to be the only thing that mattered as we exited 2021. The question is, what will work best now? The answer seems to be that a combination approach based on growth-adjusted valuations presents the best way to navigate this conundrum of extremes. An analysis of growth-adjusted EBITDA PPM, which has a public market parallel in the price-earnings-to-growth (PEG) ratio suggests “paying up” for growth makes financial sense. Figure 11 highlights the success of investments where the acquisition valuation and ultimate EBITDA growth are in line, i.e., that the investors paid a reasonable price for growth. Those investments are captured in the middle columns in the chart. A prototypical deal from our sample was acquired at 13.1x EBITDA, subsequently grew EBITDA by 27.1% annually during ownership, and earned a nearly 4x multiple. However, as the price paid for growth increases, there is an observable decline in big winners (returns of 3x or higher of invested capital) and a rise in losers. The deals included in the left-hand column, where the growth-adjusted PPM is less than 0x, did not have any EBITDA growth, and as shown in Figure 8, related to revenue growth, generally performed the worst.
Does Entry Valuation Matter?
As previously discussed, from 2009 to 2020, private and public equity valuations increased steadily. In the United States, PE transaction multiples increased from an average of 7.8x EBITDA in 2009 to 14.5x in 2020. In public markets, EBITDA multiples increased similarly, though not quite to the same degree, as average valuations for the Russell 2500™ Index moved from 9.1x to 13.6x. In 2021, valuations climbed even higher.
Rising valuations have provided a tailwind to all equity investing, whether private or public. While this overall valuation increase has concerned some, analyses suggest that higher (or lower) valuations at entry did not correlate to worse (or better) returns. In fact, a regression analysis of absolute purchase price and ultimate return showed no relationship between the two, at -0.02.
Beyond the specific company and its general growth and risk profile, this increase in valuations is influenced by macro factors such as the general economic environment, interest rates, and historical and projected growth, which change over time.
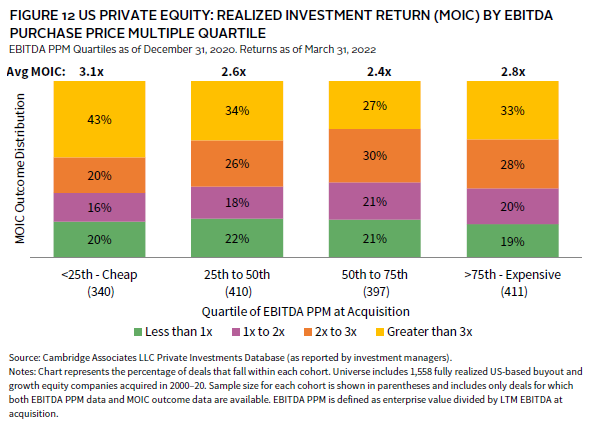
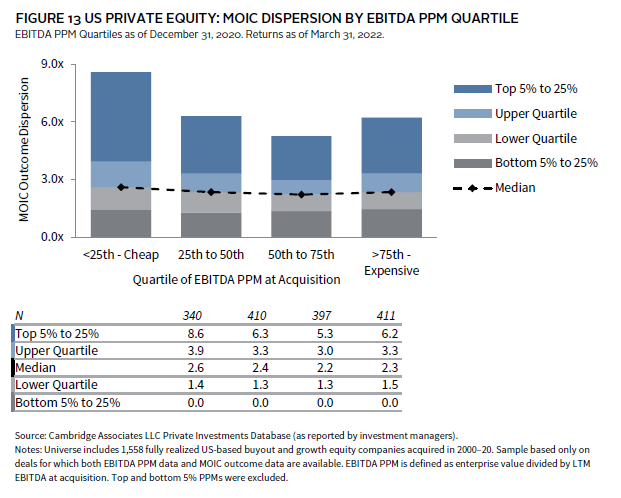
To adjust for the general increase in valuations, we evaluated companies based on a cohort analysis for each year, and then categorized deals across time as cheap (lowest 25% of valuations paid) to expensive (highest 25% of deals closed in the year), as well as the two quartiles in between (Figure 12). The evaluation based on this “relative cheapness” suggests that buying cheap can result in incrementally better returns. In our sample, the second most expensive quartile of companies generated the worst outcomes overall with a median MOIC of 2.2x and an average MOIC of 2.4x, a more moderate upside and a higher proportion of worse outcomes (Figure 13). Interestingly, the “expensive” companies delivered the second best average MOIC, 2.8x, with the lowest percentage of losing investments (19%), and the band of outcomes for those companies is tighter than for the “cheap” companies, suggesting there has been less risk in higher-valued companies. The cheapest companies performed best, delivering a median MOIC of 2.6x and an average MOIC of 3.1x. To some degree, these observations also align with those we make about company size, as small-cap companies are the biggest constituent of the “cheap” cohort and large-cap companies represent the most expensive.
Small Is Beautiful—It Can Drive Better Returns
As we look at the PE landscape and how it has shifted over the last ten years, the opportunity to earn outsized investment returns in the lower middle market has persisted. Why? The segment continues to have the greatest number of companies, be more difficult to access efficiently, and present more growth potential, whether due to operational improvement, product or geographic/market expansion, or increased market share/customer acquisitions.
The potential for strong performance in the small end of the size spectrum is demonstrated in Figure 14. Small companies can be acquired at lower valuations with less leverage, and they typically deliver better revenue and EBITDA growth. Further, that growth should enable a company to move into the higher-valued segments and thus achieve multiple expansion applied to higher earnings at the time of exit (for example, that could mean acquiring a business at 8.5x EBITDA and selling in the private or public markets at north of 10.0x EBITDA that has grown at an average of 10% per year).
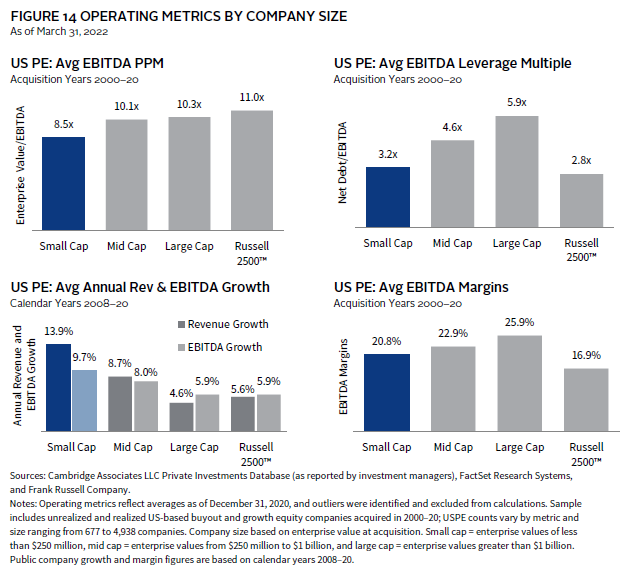
Revenue growth and company size are correlated. Almost three quarters of the strongest growers (i.e., those whose revenue growth was greater than 20%) were small-cap companies at acquisition (Figure 15).
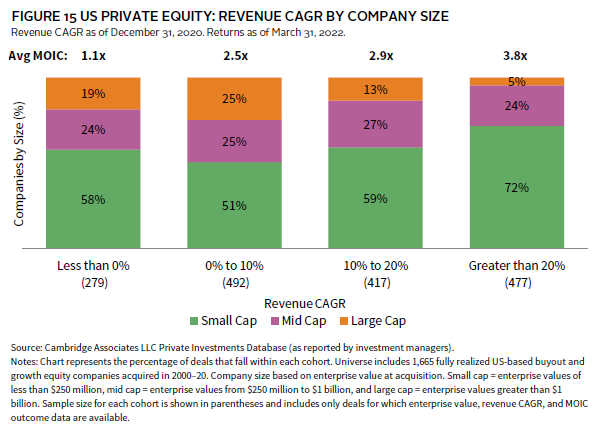
Analysis of performance by company size reveals a higher average MOIC of 2.8x for small- and mid-cap deals than for large-sized companies at 2.4x (Figure 16). This reflects the potential for outperformance. Focusing on MOIC dispersion by company size indicates that small companies have the largest percentage of “big” winners (i.e., investments that returned more than 5x invested capital) and the highest percentage of losses, particularly those that returned less than 0.5x invested capital (or less than 50 cents on the dollar).

Cautionary Tales…Long Holds, Leverage, and Relying on Multiple Expansion for Returns
Successful themes from the last decade may not persist in this next era. As we look ahead, potential challenges in private markets include the impact of valuations and leverage in a changing market environment, as well as impacts on costs and growth potential. Additionally, incentives and activity around the investment horizon for portfolio companies bear further discussion. The “Goldilocks” decade is behind us, and the impact of the COVID-19 era economy, where the Federal Reserve doubled down on stimulus, proved supportive of financial assets. However, the resulting repercussions in both the supply chain and labor market are further complicated by geopolitical issues and energy instability. These conditions create a more challenging and uncertain environment for investors and companies.
The switch from easy monetary policy to tightening has led to significant increases in the cost of borrowing, which has slowed PE activity as the industry takes in the revaluation of public markets. But PE investment in new companies is not the only aspect worth watching. Existing PE-owned companies need to be monitored to see how they respond to concerns about labor and input cost increases. Will we see negative impacts on margins? Or can companies continue to pass through price increases? In 2021, many companies seemed to adapt—but is it sustainable longer term?
Trends we are watching include the activity around 1) long held investment assets, whether through follow-on funds or continuation vehicles, 2) the changing dynamic in leveraged lending markets and related costs, and 3) public market corrections that seem to slowly be working their way into private market valuations.
Longer Holds
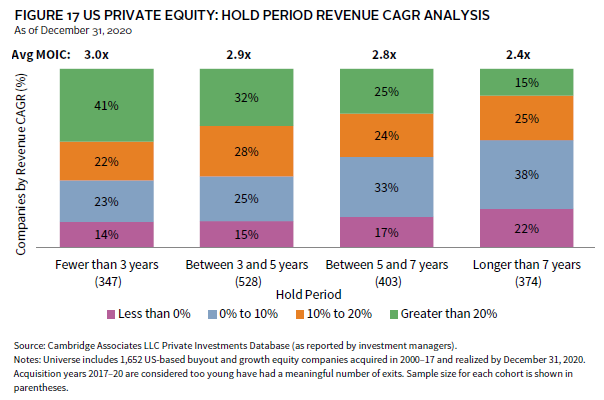
While the VC industry has enjoyed headline “wins” with long held investments that generated strong growth and returns, historically, private equity has had the opposite experience. PE investors have been quicker to ring the bell, and our analyses suggest that might be too early. PE companies that exited quickly tended to exhibit the fastest growth because the company is often well positioned, having built up its leadership team and built out its capabilities, to create the foundation for strong current and future growth.
PE managers then face the choice of either selling a strong business to a buyer willing to pay up for future growth or holding on and accepting the execution risk of maintaining growth or experiencing a slowdown. To the seller, the appeal of locking in a quick win and the fund’s IRR can drive these early exits. To the buyer (frequently another PE firm), these are attractive platforms with proven strategies and leadership, capable of performing under the more challenging ownership regime of a leveraged buyout capital structure. In this scenario, the larger firm can continue with the existing management team and strategy. And notwithstanding the sophistication of the seller, as we have observed, sponsor-to-sponsor transactions have often also delivered strong returns. However, the recent trend of continuation vehicles provides PE funds the opportunity to have their cake and eat it to, crystalizing a strong return on faster growers, while continuing to hold and manage those assets in separate funds to earn additional return and carry.
In today’s environment, exiting companies could be either difficult or untimely. We have already shown that selling during recessionary periods has been less fruitful (producing the highest percentage of investments earning a less than 1.0x MOIC) than during non-recessionary times. If PE managers are forced to hold onto portfolio companies, the results could be lower than expected returns.
In analyzing revenue growth by hold period (how long a PE fund owned a company) and the average returns for each hold period group, we found that PE companies sold quickly were often growing revenue at 20% or higher per year, and on average, the shortest “holds” earned a 3.0x MOIC (Figure 17). Conversely, the longest held companies represented by far the fewest number of strong growers and as a group, averaged a 2.4x return. What is not apparent in this chart is that within the long hold cohort, there are a nearly equal number of investments that posted a 3x or higher MOIC as there are investments that lost money.
Leverage Multiples…They Matter
Private equity uses leverage to fuel return on equity but must balance that objective with maintaining the ability to support a company’s growth and flexibility. Amid the recent low-rate environment, average leverage multiples for PE deals have been north of 4.5x EBITDA since 2015, approximating pre-GFC levels. Consistent with earlier commentary, our value creation analyses indicate that revenue growth and multiple expansion have been the two primary drivers of returns, while leverage has only played a moderate role in performance, but that is worth exploring further.
Looking at the outcomes for realized investments based on the change in leverage multiple from acquisition to exit, 4 nearly 50% of the companies whose leverage multiple contracted by two or more turns of EBITDA earned at least a 3x return (Figure 18). Of that same sample, only 9% of companies lost money. It is worth noting that in this cohort, those whose leverage multiple compressed significantly averaged the highest EBITDA growth and was the only group that decreased debt. On the flip side, nearly 60% of companies whose leverage multiples expanded by more than two turns (a group that generally increased debt and grew EBITDA the least) posted a less than 1x MOIC. Clearly, low growth with high leverage can be burdensome.
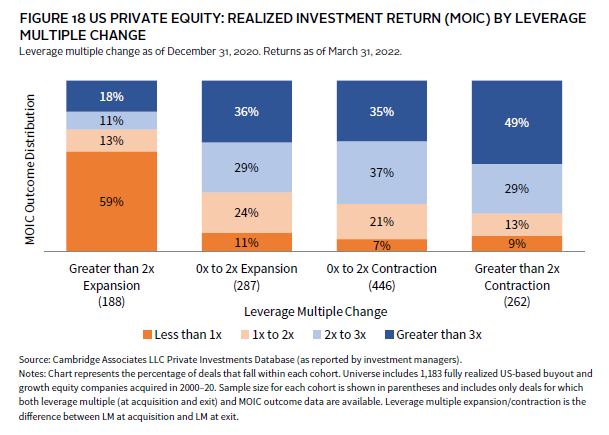
As we navigate an environment with significant inflation and cost increases, the existing high leverage levels (Figure 3) could prove challenging. Given that the debt is typically floating rate, rising interest rates will make every dollar of debt that much more expensive to carry. A concerning sequence could follow: earnings growth slows, interest expenses increase, profitability suffers, and the result is a higher likelihood of financial distress. The end game for more PE deals could parallel the post-GFC period where the easy money of the prior bull market led to expanding valuations and leverage levels, which were unsustainable in the recession, and resulted in increased PE losses.
Multiple Expansion
Multiple expansion has been a key driver of returns (Figure 19). More than half of the realized investments whose exit multiples exceeded their entry multiples by at least five turns of EBITDA, produced returns of at least 3x their invested capital and less than 10% of those companies lost money. On average, they earned a 3.7x multiple. On the other hand, nearly 30% of companies whose exit multiples were lower than their acquisition ones lost money, and that group posted an average MOIC of 2.2x.
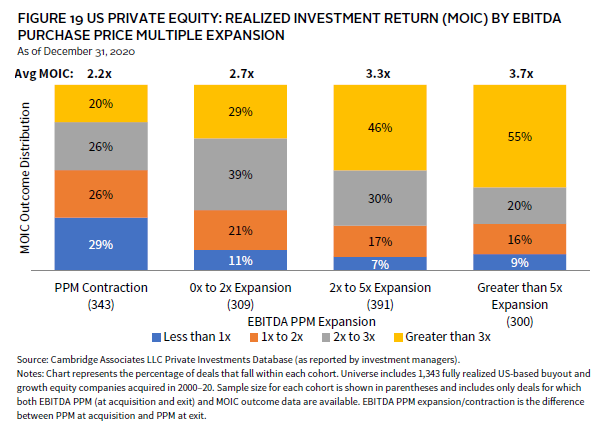
With faltering public markets and declining equity valuations, the multiple expansion lever could be (at least temporarily) challenging to maintain. Our analyses suggest that multiple expansion has been most prevalent for companies acquired when still small, and for certain sectors, notably IT. While small companies consistently trade at lower valuations than larger private peers and public companies, the tech sector’s shine has been dulled over the past year, so those investments might be held longer.
Conclusion
The US PE market has materially increased in size and sophistication over the last decade. Compared to the traditional leveraged buyouts common in the Private Equity 1.0 world, where the underlying business was managed to maximize profits, we have seen increased industry expertise and knowledge applied to the process of building better businesses with a focus on top-line growth first. PE-owned companies have increased their revenue faster and executed with better margins than those in the public markets. They have increasingly focused on sectors that provide high return on capital, like technology, and address stable and growing segments, like healthcare. The overall outcome: strong returns based on selling bigger and better businesses—as evidenced by revenue and earnings increases—and a willingness for subsequent buyers to pay more, from a valuation/PPM perspective, for the business at exit.
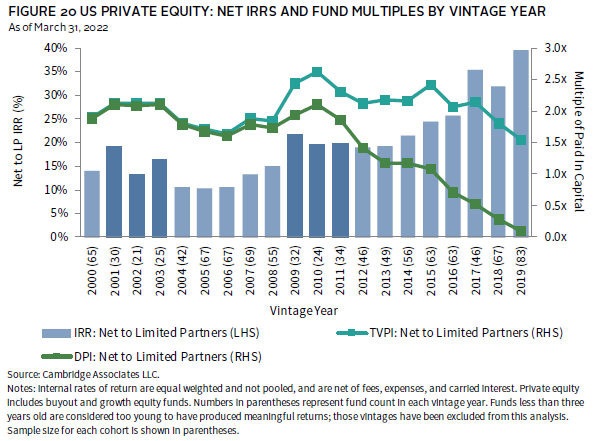
Over the next ten years, we expect the industry to continue to mature but also to face additional challenges due to increasing economic environment uncertainty, input cost challenges, rising leverage costs, and potential valuation multiples compression. The industry has experienced this before in past recessions and shown its resilience. In fact, private equity has generated some of its best returns in recessionary environments, with net distributions to paid in capital (DPI) multiples of at least 2x for funds that had their first cash flow in 2001–03 and 2009–11 (Figure 20).
We expect in its next iteration, private equity will continue to leverage data, such as the information and analyses in this report, to seek improvements in the businesses they own while incorporating an increased focus on operations and human capital. We also expect the industry to continue to adapt as an expanding set of levers provide sources of value creation, quite possibly benefitting investors and portfolio companies alike, including their employees and communities.
Notes on the Underlying Data
-
Cambridge Associates collects information from PE firms of all sizes with broad mandates, as well as specialized and sector-focused strategies. Operating metrics data are received directly from investment managers and are not independently verified.
-
As of December 31, 2020, the sample of private investments included approximately 5,700 US-based companies acquired by PE firms from 2000 through 2020 and is subject to change over time. The companies in the universe range in enterprise value from less than $1 million to about $100 billion.
-
The analyses herein are based only on US-based buyouts and growth equity investments. Some metric calculations differ slightly from those that appear in our annual operating metrics reports as those also include investments categorized as debt, venture capital or other types of transactions. Deal type categorizations have been made at the company level and reflect information provided by the private equity managers.
-
The set of companies included in individual analyses varies and depends on data availability. This is also due to the acquisition and disposition of companies during the period analyzed. We have based most of our analyses on medians but when we show averages, we use a statistical tool (an interquartile range) to screen for outliers in the PE and public universes.
-
All analyses that incorporate realized returns (multiples on invested capital) are based solely on fully realized investments. We have noted where unrealized and fully realized investments are included.
-
For comparisons between the total company universe and public markets, the Russell 2500™ Index was selected based on the market capitalization of the underlying stocks.
-
Sector classifications are based on the Global Industry Classification Standard (GICS). GICS was developed and is the exclusive property and a service mark of MSCI Inc. and S&P Global Market Intelligence LLC and is licensed for use by Cambridge Associates.
-
Any company with a negative metric for EBITDA, net debt, or revenue was excluded from analysis using that metric.
-
Sample sizes for each analysis reflect all transactions included in analyses. We eliminate “duplicate” transactions completed by the same firm across funds in a given year. For “club” or syndicated deals that involve two or more separate firms, there are two or more companies in our universe.
-
Past results are not an indication of future results, provide no guarantee for the future, and will not be constant over time.
Footnotes
- Private equity is defined as buyout and growth equity transactions only. Debt and late-stage venture deals were excluded.
- The Russell 2500™ performance is an average annual compound from January 1, 2000, to March 31, 2022.
- For all PE companies, not just realized, annual EBITDA growth from 2008 to 2020 averaged 8.3%, trailing average annual revenue growth by 2.1%. We believe the lower EBITDA growth reflects meaningful investment during part of the hold period, and notably, this earnings growth also bests public market companies average EBITDA growth rate by 240 basis points (bps) annually.
- This does not consider the actual change in leverage rather its relationship to EBITDA. For example, if absolute debt/leverage was maintained while EBITDA grew, the leverage multiple would have contracted.
Caryn Slotsky - Caryn Slotsky is a Managing Director for the Private Investment Strategy Research team at Cambridge Associates.
Keirsten Lawton, CFA - Keirsten Lawton is Co-Head of North American Private Equity Research and a Partner at Cambridge Associates.
Andrea Auerbach - Andrea Auerbach is the Global Head of Private Investments and a Partner at Cambridge Associates.
About Cambridge Associates
Cambridge Associates is a global investment firm with 50+ years of institutional investing experience. The firm aims to help pension plans, endowments & foundations, healthcare systems, and private clients achieve their investment goals and maximize their impact on the world. Cambridge Associates delivers a range of services, including outsourced CIO, non-discretionary portfolio management, staff extension and alternative asset class mandates. Contact us today.