US PE/VC Benchmark Commentary: Calendar Year 2021


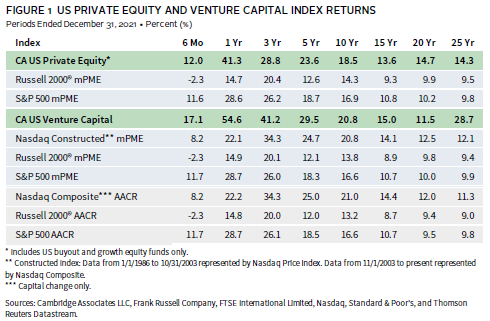
In 2021, the US private equity and venture capital (PE/VC) indexes posted their highest calendar year returns since 1999, potentially signaling a market peak and the end of over a decade of steady growth. For the year, the Cambridge Associates LLC US Private Equity Index® returned 41.3% and the Cambridge Associates LLC US Venture Capital Index® gained 54.6%. Pandemic-related tailwinds were overshadowed by negative macro factors in the second half of the year. Rising inflation and interest rates, as well as lingering supply chain issues, were all exacerbated by the Russian invasion of Ukraine in early 2022, which ultimately destabilized the global economy. While the private markets ended the year at historic highs, the downturn in public markets was a forward indicator of PE/VC returns, which fell in first quarter 2022. Figure 1 depicts this contrast by showing performance for the private asset classes and the public markets over the short and long term. (Cambridge Associates’ mPME calculation is a private-to-public comparison that seeks to replicate private investment performance under public market conditions.)
Calendar Year 2021 Highlights
- As of December 31, 2021, the PE benchmark beat the public indexes’ returns in all time periods listed in the table. The most significant outperformance over the last year was against the Russell 2000®; the small-cap companies that make up the index began to sell off in the fourth quarter, preceding a similar fall for the larger, more value-oriented companies in the S&P 500. The VC index posted double-digit returns and outperformed the public indexes in all time periods. After almost two years of strong pandemic-era growth, the tech-heavy NASDAQ Composite Index began to decline in third quarter 2021 with sharper declines in 2022. The VC benchmark, which benefited from a hot initial public offering (IPO) market and strong public IT companies, would follow suit.
- In the second half of 2021, the IPO market slowed significantly, and the public tech company valuations started correcting to the downside. VC managers exited some public companies in the second half and values fell for those that remained in portfolios. Consequently, the VC index’s exposure to public companies decreased significantly, from roughly 24% on June 30 to 15% on December 31 when measured by market value. The reduction in public company exposure was similar for the US PE index; they accounted for less than 9% at the end of the year after rising to above 11% at the end of the second quarter. Non-US companies were a meaningful component of both indexes on December 31, accounting for close to 15% for US PE and almost 20% for US VC.
- IT took top honors among the large sectors in the US PE index and financials returned the most for US venture capital.
US Private Equity Performance Insights
The tailwinds in financial markets that took hold during the pandemic grew stronger through most of 2021, making it a watershed year for private investing. Fast and furious fundraising, lofty valuations in tech-enabled businesses across sectors, and a broad reopening of the US economy created the perfect environment for strong returns, at least through the first half of the year. As inflation rose and became more permanent, so did the likelihood of aggressive interest rate hikes from the Federal Reserve, ultimately causing the public markets (mostly small-cap stocks represented by the Russell 2000®) to begin correcting at the end of the year. While cash flows and returns held steady in private equity, signs of a slowdown in growth warned investors of a potential market peak. With its return of over 41%, the US PE benchmark extended its streak of double-digit calendar year returns to 13 (2009–21). Over 79% of the index’s value resided in seven vintage years (2012, 2014–19), all of which posted annual returns of at least 36.7%.
According to Dealogic, 155 US PE–backed companies went public, either via an IPO or special purpose acquisition company (SPAC) in 2021, with a combined value of $73.9 billion. There were 14 IPOs worth at least $1.0 billion, half of which were technology companies. The remaining were split among healthcare, insurance, and SPACs, whose sector is determined when a company is acquired. The three largest IPOs were GlobalFoundries Inc. (a semiconductor manufacturer), Bumble Inc. (a dating app), and Shoals Technologies Group Inc. (a solar electrical balance of systems provider). By number of deals and value, the IPO market was much more active in 2021 than it was in 2020. In total, around 45% of the IPOs (by both count and value) were represented by IT and healthcare companies. Financials was also an active sector, mostly driven by SPACs. In line with public exits, PE-backed merger & acquisition (M&A) transactions in 2021 outnumbered those in 2020 by 441 deals (1,266 versus 825). Nearly 27% (or 336 deals) had publicly disclosed valuations, and based on the data available, the average transaction size among those deals was $1.5 billion, a significant increase from the previous year.
Vintage Years
As of December 2021, seven vintage years were meaningfully sized—representing at least 5% of the benchmark’s value—and, combined, accounted for more than 79% of the index’s value. First half returns were much stronger than those of the second half for all vintages, especially 2012, which experienced a 27% swing between the two time periods. Full-year returns were stellar across the board, ranging from 36.7% for 2014 funds to 58.0% for the 2019 vintage (Figure 2), a reflection of the high valuation environment. Notably, the 2020 vintage already accounted for 4.3% of the index and just missed the cutoff to be included in the chart. This is atypical for young vintages and can be explained by the massive levels of fundraising and accelerated pace of investment over the last two years. Lastly, the stark difference between first and second half returns in 2021 reflected the early stages of a broader correction in financial markets toward the end of the year and into 2022.
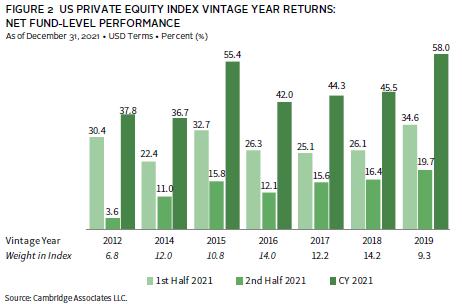
The top-performing vintage year (2019) was driven by a wide range of sectors; every meaningfully sized one returned over 50% (gross) during the year, including 164% in communication services. The second-best vintage year (2015) benefited from a significant investment in IT companies (about 36% of the vintage’s market value), which returned over 88% for the year.
While earning strong absolute returns, funds from 2012 and 2014 underperformed other vintages on a relative basis. Each vintage returned north of 36%; write-ups for both were widespread across sectors (though both were substantially driven by IT), but more muted than those in other years.
LP Cash Flows
In 2021, limited partner (LP) contributions and distributions hit their highest levels ever recorded since the inception of the Cambridge Associates LLC US Private Equity Index®. Distributions more than doubled from the previous year ($127 billion in 2020 to $257 billion in 2021), and the second half was a more active period than the first. Contributions increased by over 50% from 2020, which previously represented the most active year for capital calls (Figure 3). Distributions outpaced contributions throughout the year, marking the 11th year in a row for the index.
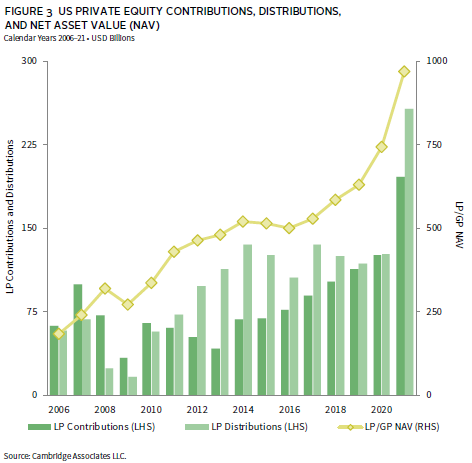
Three of the most recent vintage years (2018–20) accounted for over 71% ($140 billion) of the capital calls in 2021, each averaging between $40 billion and $50 billion. All other vintage years represented much smaller amounts of contributions, partially because they were dwarfed in size by funds raised between 2018 and 2020. By contrast, nine vintage years (2006–07, 2011–17) accounted for roughly 87% of distributions for the year; funds from 2014 to 2016 represented nearly 44%. All nine vintage years returned at least $10 billion, further emphasizing the overall health of the exit environment during 2021.
Sectors
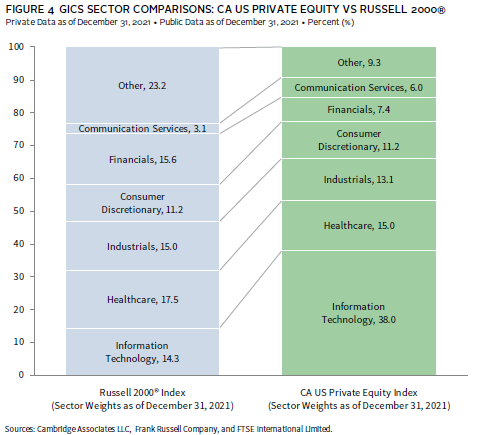
Figure 4 shows the Global Industry Classification Standard (GICS®) sector breakdown of the PE index and a public market counterpart, the Russell 2000® Index. The comparison provides context when evaluating the performance of the two indexes. The largest differences are in IT, where the PE index’s exposure is more than 2.5 times that of the Russell 2000® Index, and in financials, where the public index’s weight is more than 2.0 times larger than the private equity index. The chart also highlights a sizable PE overweight in communication services and a considerable underweight in real estate, which is reflected in the “other” sector bucket.
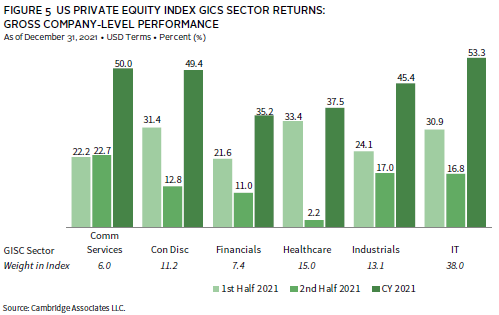
As of December 2021, IT maintained its dominance as the largest sector (38%), which is more than twice the next biggest, healthcare (15%). Calendar year returns for the six meaningfully sized sectors all exceeded 35%, ranging from 35.2% in financials to 53.3% in IT (Figure 5). Most vintage years enjoyed significant write-ups in their investments in IT companies; funds from 2009 to 2020 earned returns of between 28% and 135% for the year in the sector. Communication services posted a 50% return in 2021 as many continued their “at-home” lifestyles. Write-ups were also widespread for the sector, with the largest vintage years (2013–19) earning about 50% or higher. Notably, funds from 2019—which already accounted for more than 10% of the communications services’ market value—returned 164%. Even for financials, the worst-performing sector, returns were strong for most vintage years. Across all sectors, except communication services, first half returns were much higher than those earned in the last six months. Like the contrast exhibited in returns by vintage year, the macroeconomic factors in the second half of the year impacted all corners of the market, including sector performance.
In 2021, four sectors garnered about 78% of the capital invested by the managers in the PE index: IT (40%), healthcare and industrials (14% each), and consumer discretionary (10%). Since the inception of the index in 1986, those sectors have attracted about 66% of capital, with the difference largely attributable to IT.
US Venture Capital Performance Insights
The CA US venture capital index returned 54.6% in 2021, marking its second-best calendar year ever (1999 remains the highest) and easily outperforming the public markets. IT, financials, and communication services drove the strong return, buoyed by accelerated adoption of tech-enabled products and services during the pandemic. Fundraising momentum continued in 2021, eclipsing $128 billion, which represented $40 billion more than the capital raised in 2020, but was reached with roughly the same number of funds. Cash flows in and out of venture managers set records for all calendar years since the inception of the index, and the value of exits (via M&A, IPOs, and SPACs) increased 2.6 times from 2020.
According to the National Venture Capital Association and Pitchbook, the number of deals completed in 2021 increased 1.4 times (up to 1,612 from 1,123 in 2020), a considerable jump but less significant than when measured by value ($774 billion from $289 billion in 2020). Exits were also more plentiful in 2021, with the hot IPO market earlier in the year driving much of the change—there were 296 public listings in 2021 worth $682 billion, compared to 138 public listings worth $208 billion in 2020. The largest US VC-backed IPOs included crypto and fintech companies like Coinbase and Robinhood, and car transport and electric vehicle companies like DiDi and Rivian. SPACs also set records by count (556) and value ($135 billion), with most being filed in the first quarter. There were 1,007 venture-backed M&A transactions worth $79 billion, a significant jump in number, but a smaller rise in value when compared with 2020. The same was true for sales to financial buyers (PE buyouts), which numbered 309 (a 1.3 times increase from 2020) and were worth $13.7 billion, up from $12.5 billion.
Vintage Years
As of December 31, 2021, the nine meaningfully sized vintages represented about 78% of the venture index’s value. Annual returns ranged from 26.2% (2010) to 77.6% (2016), and first half performance was stronger than that of the second half for all vintages. The most recent vintages (2016 on), including the young funds from 2020, returned almost 67% on average (Figure 6).

IT companies were primarily responsible for the high return of the best-performing vintage, 2016; companies in this sector accounted for nearly 54% of the write-ups during the year. IT accounted for 48% of the 2016 vintage by market value and returned almost 119% during the year, although most of that value was unrealized at the end of the year. The same was true for the other vintage years—IT drove strong returns during 2021, but very little of the value was realized. Valuations for technology companies in the public markets began correcting in third quarter 2021 and continued into 2022. This could have a meaningful impact on the unrealized IT valuations within the VC benchmark. The worst-performing vintage (2010) was also driven up by investments in IT, but healthcare—its second largest sector exposure behind IT—returned just 4.9% for the year. After a year and a half of enthusiasm in biotech and life sciences, the industry experienced a major sell-off in the second half of the year as the pandemic and the capital injected for vaccine and therapy research subsided.
LP Cash Flows
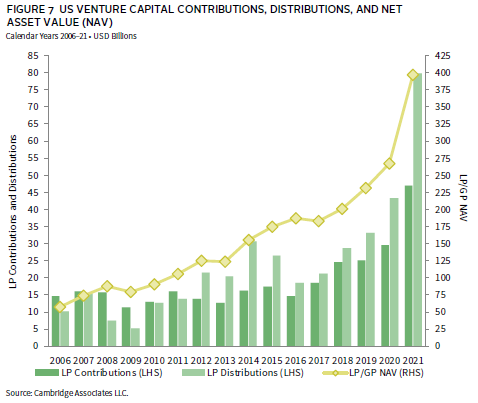
As previously mentioned, the investment pace accelerated and the exit environment remained strong in 2021 after momentum began building in the second half of the previous year. LP contributions and distributions set records based on dollar value. In 2021, capital calls reached more than $47 billion and almost $80 billion was returned to LPs, marking the tenth consecutive year that distributions outpaced contributions (Figure 7).
Nearly all capital calls during the year were made by funds formed from 2017 to 2021 ($44.6 billion), which is expected as they are in their prime investment periods. The 2019 and 2020 vintages alone accounted for more than $27 billion, or almost 58% of all contributions for the year. Distributions, however, were much more widespread, with 12 vintages (2006–08 and 2010–18) each returning more than $2.6 billion to investors. The best-performing vintage for the year (2016) distributed more than $7 billion, or nearly 9% of total distributions.
Sectors
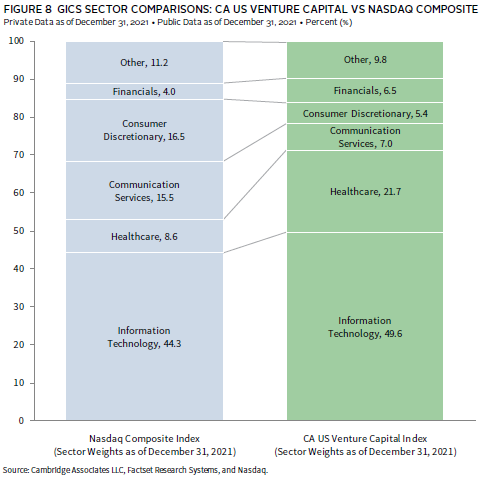
Figure 8 shows the GICS sector breakdown of the VC index and a public market counterpart, the Nasdaq Composite Index. The breakdown provides context when comparing the performance of the two indexes. The chart highlights the venture index’s meaningful overweight in healthcare and its considerable underweights in communication services and consumer discretionary. The gap in exposures to IT between the public and private indexes has narrowed slightly since 2018, from 7.5% to slightly more than 5% at the end of 2021. This is at least in part a result of the outsized performance of public tech stocks during the pandemic.
US venture managers have increased their investments in healthcare companies over the last five years. During that time, IT and healthcare (combined to account for more than 71% of the index) have performed well, resulting in a growing overweight to the two sectors when measured by market value. In general, the US VC index has always been considerably more concentrated than US private equity as it relates to sector exposure. The remaining three meaningfully weighted sectors (communication services, consumer discretionary, and financials) represented between 5% and 7% of the total index. Combined, the five large sectors accounted for 90% of the index’s value at the close of 2021 (Figure 9), and industrials represented an additional 4%. Capital invested during the year was allocated roughly along the same lines as exposure by market value, with about 72% of it going into healthcare and IT businesses and around 18% going into communication services, consumer discretionary, and financials.
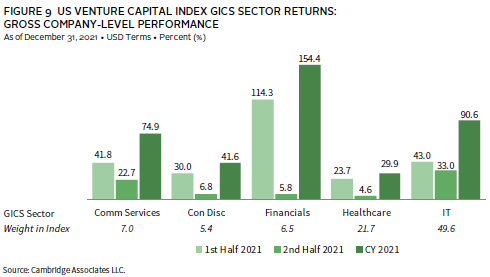
All key sectors earned strong returns during the year, but financials, IT, and communication services (in rank order) performed much better than the rest, earning 154%, 91%, and 75%, respectively. Prompted by the pandemic, shifts in consumer behavior drove growth for companies in the three sectors. Many people used technology to navigate a virtual work environment, consumed entertainment at home, and shopped online, creating a growing demand for tech-enabled products and services. Write-ups in financials were widespread among vintages, with six returning above 100%, including funds started in 2011 that earned a staggering 740% for the year. Fintech and crypto companies, some of which filed for an IPO and/or experienced significant run-ups in the public markets, helped drive the return. Write-ups for the worst-performing sectors, consumer discretionary and healthcare, were more muted or mixed across vintage years.
Figure Notes
US Private Equity and Venture Capital Index Returns
Private indexes are pooled horizon internal rates of return, net of fees, expenses, and carried interest. Returns are annualized, with the exception of returns less than one year, which are cumulative. Because the US private equity and venture capital indexes are capitalization weighted, the largest vintage years mainly drive the indexes’ performance.
Public index returns are shown as both time-weighted returns (average annual compound returns) and dollar-weighted returns (mPME). The CA Modified Public Market Equivalent replicates private investment performance under public market conditions. The public index’s shares are purchased and sold according to the private fund cash flow schedule, with distributions calculated in the same proportion as the private fund, and mPME net asset value is a function of mPME cash flows and public index returns.
Vintage Year Returns
Vintage year fund-level returns are net of fees, expenses, and carried interest.Sector ReturnsIndustry-specific, gross company-level returns are before fees, expenses, and carried interest.
GICS® Sector Comparisons
The Global Industry Classification Standard (GICS®) was developed by and is the exclusive property and a service mark of MSCI Inc. and S&P Global Market Intelligence LLC and is licensed for use by Cambridge Associates LLC. The public index exposures are as of December 31, 2020, and represent the index’s sector breakdown after the GICS® reclassification that went into effect after close of business (ET) September 28, 2018. Cambridge Associates LLC implemented the GICS® reclassification for private companies with the release of September 30, 2018, benchmark data. “Other” includes sectors that make up less than 5% of the CA benchmark.
About the Cambridge Associates LLC Indexes
Cambridge Associates derives its US private equity benchmark from the financial information contained in its proprietary database of private equity funds. As of December 31, 2021, the database included 1,387 US buyouts and growth equity funds formed from 1986 to 2021, with a LP/GP value of $1,303 billion. Ten years ago, as of December 31, 2010, the index included 757 funds whose LP/GP value was $427 billion.
Cambridge Associates derives its US venture capital benchmark from the financial information contained in its proprietary database of venture capital funds. As of December 31, 2021, the database consisted of 2,203 US venture capital funds formed from 1981 to 2021, with a LP/GP value of $586 billion. Ten years ago, as of December 31, 2010, the index included 1,323 funds whose LP/GP value was $106 billion.
The pooled returns represent the net end-to-end rates of return calculated on the aggregate of all cash flows and market values as reported to Cambridge Associates by the funds’ general partners in their quarterly and annual audited financial reports. These returns are net of management fees, expenses, and performance fees that take the form of a carried interest.
About the Public Indexes
The Nasdaq Composite Index is a broad-based index that measures all securities (over 3,000) listed on the Nasdaq Stock Market. The Nasdaq Composite is calculated under a market capitalization–weighted methodology.
The Russell 2000® Index includes the smallest 2,000 companies of the Russell 3000® Index (which is composed of the largest 3,000 companies by market capitalization).The Standard & Poor’s 500 Composite Stock Price Index is a capitalization-weighted index of 500 stocks intended to be a representative sample of leading companies in leading industries within the US economy. Stocks in the index are chosen for market size, liquidity, and industry group representation.
Caryn Slotsky - Caryn Slotsky is a Managing Director for the Private Investment Strategy Research team at Cambridge Associates.
About Cambridge Associates
Cambridge Associates is a global investment firm with 50+ years of institutional investing experience. The firm aims to help pension plans, endowments & foundations, healthcare systems, and private clients achieve their investment goals and maximize their impact on the world. Cambridge Associates delivers a range of services, including outsourced CIO, non-discretionary portfolio management, staff extension and alternative asset class mandates. Contact us today.