A New Arrow in the Quiver: Investment-Level Benchmarks for Private Investment Performance Measurement

Private equity’s double-digit long-term returns have served as a siren song for investors over the years, and Cambridge Associates’ research and investment experience show that a thoughtfully constructed portfolio of private investments has indeed served investors well. 1 Yet investors have always found private equity manager selection and performance measurement challenging. Sophisticated investors know that return dispersion is immense in private equity (see sidebar below): there is no such thing as “index hugging,” and manager talent, execution, strategy, geography, and macroeconomic factors all come into play when a fund is underway.
To help interpret private equity fund performance, Cambridge Associates has long strived to focus limited partners (LPs) and general partners (GPs) alike on “net to LP” fund-level returns—returns after all fees, expenses, and carried interest are deducted. In service of this goal, we have been publishing net to LP medians and quartile breakpoints for key metrics like internal rate of return (IRR), total value to paid-in capital (TVPI), and distributions to paid-in capital (DPI) for decades. More recently, we have added public market equivalent (PME) metrics to our clients’ performance measurement quivers. 2
Over time, and as more investors allocate capital to private equity, the market has evolved to become increasingly sophisticated and competitive. As a result, we have observed an expansion of investment scope and a profusion of specialized sub-strategies; for example, the growth of co-investing and direct investing; sector-focused strategies; and managers expanding into adjacent geographies, sectors, and/or asset classes that may be new to them and their investors. In this context, fund-level net to LP benchmarks, while still necessary, are not always sufficient to the task.
Enter investment-level benchmarking: aggregated pools of investments organized by year of investment, sector, geography, and so on. Such analysis offers investors new insights into performance because it is not constrained by fund-level factors like a fund’s vintage year or primary investment focus. This paper introduces Cambridge Associates’ Investment-Level Benchmarks and shares examples of the types of perspectives they can offer subscribers.
Private Equity Fund Return Dispersion: Do You Prefer More Upside or Less Downside?
Given the potential upside in private equity, few investors allocate capital to earn median or “index” returns—they aim for above-median returns or, more commonly, top quartile returns. The figure below shows the dispersion of fund-level returns across several private equity strategies; while the median IRR in the figure tends to center around 10% (after fees and expenses) across all strategies for vintage years 1986–2014, the upside and risk of loss of capital varies considerably by strategy.
Dispersion of Fund-Level Returns Across Private Equity Strategies
As of Second Quarter 2016 • Vintage Years 1986–2014
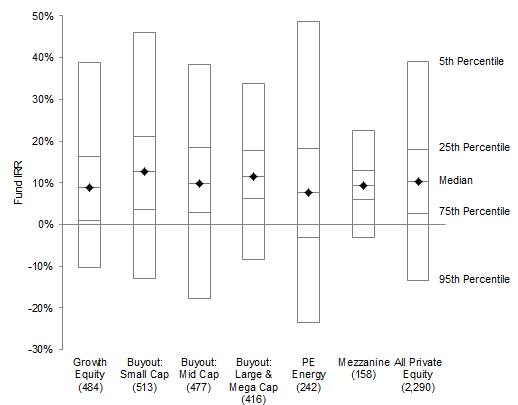
Source: Cambridge Associates LLC.
Notes: Private indexes are pooled IRRs since inception and net of fees, expenses, and carried interest. Number of funds included in groupings shown under label.
Investment-Level Benchmarking: “Net,” Meet “Gross”
Our private equity manager due diligence, research, and this paper leverage the Cambridge Associates Private Investment Database, focusing on the performance of over 1,700 private equity funds 3 raised since 1986 and, in particular, the characteristics and performance of their more than 27,000 portfolio investments (our methodology is described in more detail below). While our traditional analysis and benchmarks are “net,” as discussed earlier, our investment-level dataset captures the “gross” returns—before any fees, expenses, or carried interest are deducted—of each of these underlying private equity investments. Grouping data at the investment-level rather than the fund-level allows for new types of analysis. For example, while over 70% of the private equity funds in our dataset are classified as multi-sector funds, the investment-level data allows us to pool together every consumer sector investment regardless of the type of fund (multi-sector or consumer specialist) that made the investment, providing for a larger dataset and richer understanding of that specific sector’s performance.
In our view, gross investment-level benchmarks are a valuable arrow in any investor’s performance measurement quiver. Investors can use these benchmarks to dig deeper and perform additional analytics on investments within managers’ traditional commingled funds, and to add perspective to new sectors, strategies, or geographies. In addition, investment-level benchmarks are well suited to assess the performance of co-investments and direct investments.
Methodology
The dataset used in this paper is a subset of the Cambridge Associates Private Investment Database and includes 1,703 private equity funds spanning vintage years 1986–2014 for which we have key metrics on their underlying portfolio companies. These data are the basis for this paper, and include identifying information such as each investment’s year of investment, GICS* sector, and company location, as well as quarterly performance statistics such as contributions, distributions, and net asset values. This sample of investments includes 27,315 investment positions (20,644 unique investment names as some investment names have more than one fund invested, creating multiple positions) representing over $1.6 trillion of invested capital. All fund-level and investment-level data in this paper are as of December 31, 2015, unless noted otherwise. Vintage year is defined as the year of the fund’s legal inception.
* The Global Industry Classification Standard (GICS) was developed by and is the exclusive property and a service mark of MSCI Inc. and Standard & Poor’s, a division of The McGraw-Hill Companies, Inc. and is licensed for use by Cambridge Associates.
Investment-Level Views Enable Deeper Diligence and Evaluation of New Strategies
Analysis by Year of Investment. Private equity funds are typically classified by vintage year, with vintage defined as either the year of the fund’s legal inception or the year in which LP capital is first called (for either fees or investment purposes). The vintage year concept is one way to group funds that invest over a similar time horizon into a peer group, with similar time constraints (e.g., a five-year investment period, a ten-year fund life), and in a similar investment environment. The theory being that a fund that outperforms its vintage peers made superior investment decisions along one or more dimensions during that vintage’s time horizon.
The year of investment approach peels away the vintage year wrapper and examines performance of an underlying investment against all other investments made in a particular calendar year. Accordingly, an investment made in calendar year 2003 could be from a newly minted vintage 2003 fund or a vintage 1999 fund in the last year of its five-year investment period. Using this construct allows investors to measure underlying investment performance during the years a fund actively invested, regardless of its vintage year classification. The vintage year and the year of investment approach are both useful, but they address different performance issues. Vintage year is useful in assessing performance at the fund level, while year of investment is a more useful concept at the investment level or, as discussed later, in understanding the risk/return dynamics of particular geographies, strategies, or sectors “in general.”
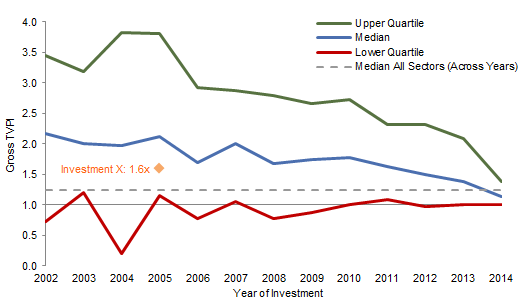
Figure 1 illustrates the median gross IRR and upper and lower quartile breakpoints for all private equity funds, organized by the year the investment was made. On the top chart, the dashed line, representing a gross IRR of 7.9%, is the median of the entire pool of investments made by these funds, regardless of year of investment. The second chart takes a closer look at the same data, focusing on the 2002–07 period. In addition to demonstrating the deterioration of returns generated by an overheated private equity market pre–global financial crisis, the data allow an investor to compare the gross return of a particular investment made during 2002–07 with the returns of all investments made over this same period by all private equity funds in our sample, regardless of vintage.
Figure 1. Private Equity Investment-Level Returns: Gross IRR Quartiles
As of Fourth Quarter 2015
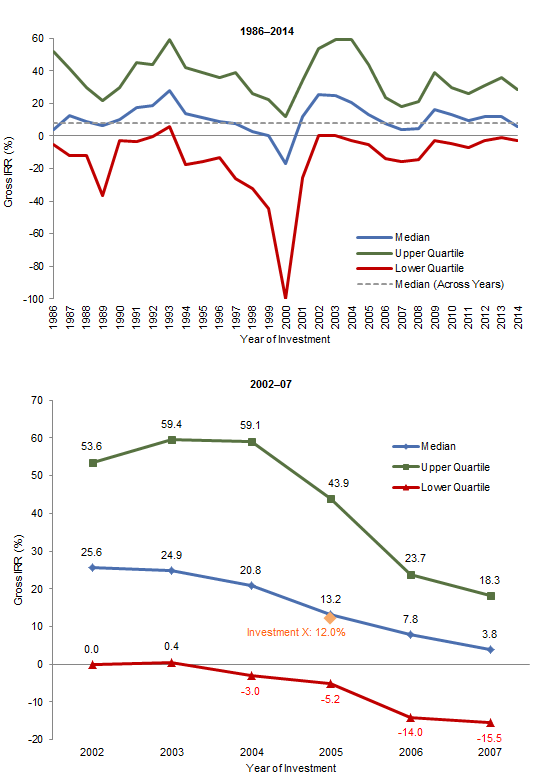
Source: Cambridge Associates LLC.
Notes: Includes the performance of investments made by buyout, growth equity, mezzanine, and private equity energy funds. Gross IRRs are before fees, expenses, and carried interest.
For example: Investment X, a portfolio company investment made in 2005 with a gross IRR of 12.0% and a gross TVPI of 1.6x, is more or less tracking the median of all private equity investments made in 2005 on an IRR basis (13.2%), but is far from being in the top quartile of investments made in 2005 (43.9%). Of course, what looks like average performance at such a high-level view may well be explained by other factors—such as the riskiness of the investment (is it a mezzanine investment or a small-cap buyout investment?), geographic factors, or the sector of the investment—but having identified potentially mediocre performance, the investor is encouraged to dig deeper.
Analysis by Strategy and Geography. The richness of the investment information in our database allows investors to look at additional dimensions. Whether benchmarking specific portfolio companies against investments in similar strategies, geographies, and/or sectors, or trying to understand the return potential in new markets, gross investment-level benchmarks provide investors another source of information. Returning to the dispersion of returns in private equity, Figure 2 compares dispersion across pools of investments from different buyout strategies. All three strategies demonstrate median gross IRRs of around 10%; however, the upside potential for an investor in a small-cap buyout strategy (35.0%+ for a top quartile investment) is superior to that of a large- or mega-cap strategy (30.2%+). Yet, some investors may be quite comfortable with trading off that extra potential upside for the superior downside protection of larger buyout investments (a bottom quartile breakpoint of -7.7% versus -14.3% for small-cap buyouts).
Figure 2. Private Equity Investment-Level Returns: Buyout Gross IRRs by Investment Size
As of Fourth Quarter 2015
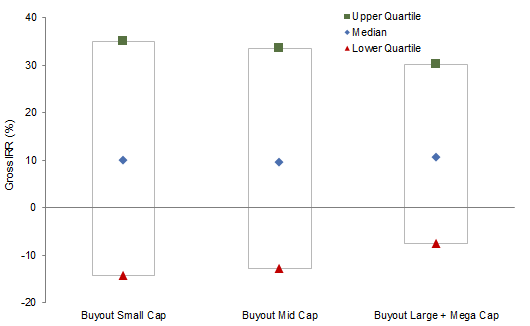
Source: Cambridge Associates LLC.
Notes: Includes the performance of investments made by buyout funds. Gross IRRs are before fees, expenses, and carried interest.
Turning to returns by geography, Figure 3 illustrates the median gross returns of private equity investments across four broad geographic groupings: the United States, developed European countries, other developed markets, and emerging markets. Where and when a fund invests can have considerable impact on returns: the dispersion of median investment-level returns across both geography and calendar years varies greatly. Continuing with our previous example, if Investment X is located in the United States or an emerging market, its return is similar to the medians of those regions for investments made in 2005; however, its 12% IRR underperformed relative to the median gross IRR of investments made in developed Europe in 2005 (19.6%). Of course, these analyses are in US dollars and so, for any non-dollar investments, performance in the investor’s local currency and currency fluctuations relative to the dollar must be considered. Investors can use investment-level insights like these to inform their asset allocation or geographic diversification decisions.
Figure 3. Private Equity Investment-Level Returns: Median Gross IRR by Geographic Region
As of Fourth Quarter 2015
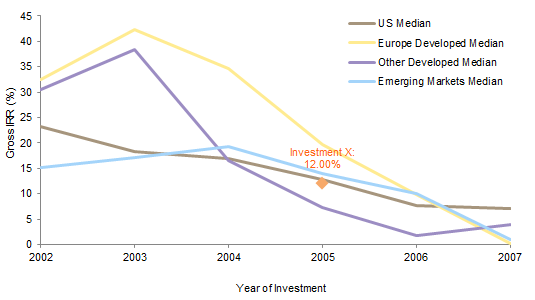
Source: Cambridge Associates LLC.
Notes: Includes the performance of investments made by buyout, growth equity, mezzanine, and private equity energy funds. Gross IRRs are before fees, expenses, and carried interest. “Other developed” includes developed Asia/Pacific, Canada, and developed Middle East.
Analysis by Sector. Another dimension that can influence returns is the sector of specific investments. Investors and GPs alike know that returns can be driven by overall sector dynamics, as well as the competitiveness of the underlying portfolio company, and that investments in certain sectors (much like strategies and geographies) do not all have the same return potential. 4 Figure 4 organizes our sample of investments by industry sector and shows the dispersion of gross TVPI. We have limited the vintage years included in this analysis to 2002–14 to exclude the disproportionate impact of the dot-com bust on the technology sector. Figure 5 focuses on investments in the health care sector, illustrating gross TVPI medians and quartiles by year of investment from 2002 to 2014. Consistent with health care’s relatively high-return profile (as seen in Figure 4), over this period median gross health care multiples have bested the median gross multiples of investments across all sectors in 12 out of 13 years, and the average outperformance has been 0.51 turns. If Investment X were a company in the health care space, how would its performance stack up? In this case, Investment X’s return is below the median health care TVPI for each investment year between 2002 and 2011, and often considerably below the median. Compared to other health care investments made in the same year of investment (2005), Investment X’s IRR is 0.5 turns below the median (2.1x versus 1.6x).
Figure 4. Private Equity Investment-Level Returns: Gross TVPI by Sector
As of Fourth Quarter 2015

Source: Cambridge Associates LLC.
Notes: Includes the performance of investments made by vintage year 2002–14 buyout, growth equity, mezzanine, and private equity energy funds. Gross TVPI multiples are before fees, expenses, and carried interest. “Consumer” includes both consumer discretionary and consumer staples sectors. “Technology” includes both information technology and telecommunication services sectors.
Figure 5. Private Equity Investment-Level Returns: Gross TVPI of Health Care Compared to Median Gross TVPI of All Sectors
As of Fourth Quarter 2015
Source: Cambridge Associates LLC.
Notes: Includes the performance of investments made by buyout, growth equity, mezzanine, and private equity energy funds. Gross TVPI multiples are before fees, expenses, and carried interest.
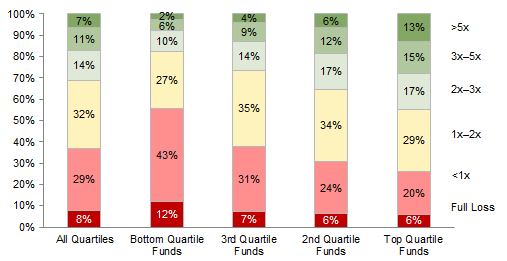
Analysis by Fund Quartile. The next dimension we explore is to organize private equity investments by the quartile ranking of their funds. This analysis provides insights into the differences in portfolio composition between higher- and lower-performing funds. As a baseline, the median gross TVPI of all private equity investments in our sample is 1.25x. Figure 6 illustrates the importance of strong investment selection and post-investment value add: 28% of the investments from top quartile private equity funds delivered over 3.0x gross TVPI while 26% of investments returned less than 1.0x. Compare this to the performance profile of investments from bottom quartile funds in which only 8% of investments returned over 3.0x and 55% registered at least some loss of investor capital. Twice as many investments from bottom quartile funds (12%) were completely written off as compared to investments from top quartile funds (6%).
Figure 6. Private Equity Investment-Level Returns: Gross TVPI by Funds’ Performance Quartile
As of Fourth Quarter 2015
Source: Cambridge Associates LLC.
Notes: Includes the performance of investments made by buyout, growth equity, mezzanine, and private equity energy funds. Gross TVPI multiples are before fees, expenses, and carried interest.
For Those Riding the Co-investment (or Direct Investment) Wave
Investment-level benchmarks can also be a useful means to assess the performance of co-investments and direct investments. As more investors look to private investments to drive their returns, GPs and LPs alike are increasingly incorporating co-investments and direct investments into their overall strategies. 5 These structures are growing in popularity in part due to their lower fee structures. Regardless of a fund’s performance, one almost sure-fire way for investors to improve their portfolio’s return potential is to reduce the “fee drag.”
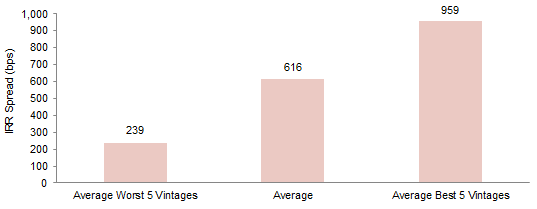
Figure 7 highlights the effect of fees on LP returns: fund-level fees cost private equity investors 616 basis points (bps) (on average), or about 0.2x MOIC over the life of a fund. Of course, the effect of carried interest can increase the fee drag significantly in better-performing funds and stronger vintage years. For example, for the five best-performing private equity vintages across 1986–2010, the average net to LP returns are a healthy 26.1% IRR and, as a result, the average gross-to-net spread is a hefty 959 bps per year. Expensive for sure, but a price most investors are quite happy to pay for such robust net returns.
Figure 7. Spread Between Gross and Net Returns for Private Equity Funds
As of Fourth Quarter 2015
Source: Cambridge Associates LLC.
Notes: Includes the performance of investments made by vintage year 1986–2010 buyout, growth equity, mezzanine, and private equity energy funds. Vintage years more recent than 2010 excluded as their performance is still developing. Only funds with investment-level data in the CA dataset were used for this comparison. Gross returns are before fees, expenses, and carried interest. Net returns are after fees, expenses, and carried interest.
As co- and direct investments become a larger part of investor portfolios, benchmarking them has become an increasingly frequent topic of conversation. Because the structures of these investments—by their very design—are not subject to the standard “2 and 20” fund manager compensation structure, any fund-level net to LP private benchmark is an apple to a co-investment’s orange. Gross investment-level benchmarks are a great option in these increasingly common situations.
Conclusion
Investor interest in private equity, driven by historical long-term returns that have been strong relative to the public market alternatives, shows no signs of abating. A variety of specialized sub-strategies are emerging as private equity investors and fund managers expand in multiple directions, searching for new sources of differentiation and new ways to earn compelling returns in the future. The growth of these sub-strategies, like co-investments and direct investments, sector-focused strategies, and managers expanding into adjacent or completely new geographies, sectors and/or asset classes, has made performance measurement and assessment even more difficult than usual. In this context, relying solely on fund-level net to LP benchmarks to evaluate the performance of private equity investments may no longer be prudent. Investment-level analytics offer investors a new arrow for their quivers and can provide valuable perspectives on the performance of private investments.
Footnotes
- Please see David Shukis and David Thurston, “The 15% Frontier,” Cambridge Associates Research Report, July 2016. This research found that endowments and foundations that allocated 15% or more of their capital to private investments outperformed their peers over five-, ten-, 15- and 20-year time horizons and outperformed the public market (on a public market equivalent or PME basis) in most years as well. The public index used in the PME analysis was the Russell 3000®.
- Cambridge Associates’ modified public market equivalent (mPME) methodology replicates private investment performance under public market conditions and allows for an appropriate comparison of private and public market returns. The mPME analysis evaluates what return would have been earned had the dollars invested in private investments been invested in the public market index instead. For more on our metric, please see Jill Shaw et al., “A Framework for Benchmarking Private Investments,” Cambridge Associates Research Report, 2014. Clients subscribing to Cambridge Associates’ Optica Benchmarks online application have the ability to perform custom PME analytics using mPME as well as Kaplan & Schoar PME (K&S PME) and Direct Alpha methodologies. Cambridge Associates’ quarterly private benchmark reports include mPME analysis as well.
- In this paper the term “private equity” refers to growth equity, buyout, mezzanine, and private equity energy funds (“private equity funds”) and the portfolio company investments underlying these funds (“private equity investments”); venture capital funds and their investments are excluded.
- Please see Josh Zweig et al., “Declaring a Major: Sector-Focused Private Investment Funds,” Cambridge Associates Research Note, September 2014. This research demonstrates that sector-focused fund managers have been able to combine two things—their ability to understand (and sometimes shape) the dynamics in their chosen sector and their capabilities to create value in their investments—to deliver superior returns relative to generalist funds. In our research, investments made by sector-focused specialists outperformed investments made by generalist funds in terms of gross IRR (23.2% vs 17.5%) and gross MOIC (2.2x vs 1.9x). The period of analysis was from 2001–10 and the sectors analyzed were consumer, financial services, health care, and technology.
- Please see Andrea Auerbach, “Making Waves: The Cresting Co-investment Opportunity,” Cambridge Associates Research Report, 2015. While the size of the co-investment market is difficult to quantify precisely, we estimate that it accounts for upward of 5% of overall private investment activity. The popularity of co-investment is driven by increased GP offerings as well as investors’ desire to put more money to work, reduce their fee burden, and have more direct control over how their money is invested.
Andrea Auerbach - Andrea Auerbach is the Global Head of Private Investments and a Partner at Cambridge Associates.
About Cambridge Associates
Cambridge Associates is a global investment firm with 50+ years of institutional investing experience. The firm aims to help pension plans, endowments & foundations, healthcare systems, and private clients achieve their investment goals and maximize their impact on the world. Cambridge Associates delivers a range of services, including outsourced CIO, non-discretionary portfolio management, staff extension and alternative asset class mandates. Contact us today.