Private Energy: Deserving a Place

The potential for strong performance and use as a diversifier give private energy investments merit as part of portfolios
- On an absolute basis, private energy funds have performed well over the past 30 years, with a mean internal rate of return of 12.7%. Such funds have also beaten public index counterparts, with a mean value add of nearly 500 basis points.
- Examining unsmoothed performance data (to better account for private investments’ infrequent pricing) suggests private energy investments have delivered diversification benefits and an attractive risk/return profile.
- Among the risks of investing in private energy, the recent high levels of fundraising and increase in dry powder are worth considering. So, too, is the potential for a greater-than-anticipated disruption in traditional energy markets from advancements in alternative energy, though we judge that such a risk is not great enough today to mean investors should avoid the sector.
Do traditional private equity energy investments still deserve a place in portfolios? Fresh questions about the industry sprang out of the recent energy commodity downturn when a few high-profile funds were forced to take significant write-downs on portfolio assets, succumbing to the difficult market environment. These funds notwithstanding, technological advancement has helped alternative energy sources to be increasingly cost competitive with fossil fuels, raising concerns about the utility of locking up capital with traditional private energy managers.
But, in examining our 30 years of data spanning different market cycles, the average private energy fund’s performance has been stellar, both in absolute terms and relative to public market equivalents. Further, the industry’s performance pattern has been different from that of broad equities, liquid real asset options, and other private investment strategies, indicating private energy has provided diversification benefits. Although investors do need to be mindful of the longer-term transition in energy markets, that mindfulness should not preclude new investments in top-quality managers. Private energy may still deserve a place in portfolios.
The Landscape
Nearly 325 private energy–related funds have been raised since 1986, according to our data, cutting across a wide array of strategies. The majority of funds were raised to target underlying exposure to either upstream assets or assets across the energy value chain, with the remainder focusing primarily on oilfield services or midstream infrastructure assets. Most of these strategies are US focused, though funds with global or global ex US mandates have represented a higher share—if still a minority—of total funds since the financial crisis.
Most private energy managers—particularly larger, more established ones—provide third-party management teams with equity lines of credit to source and acquire assets. This private equity approach depends on a general partner’s ability to identify highly capable management teams and stands in contrast to the private energy managers that directly source and acquire underlying assets either on their own or in tandem with operating partners. This direct operating approach requires a more detailed knowledge of petroleum geology and extraction.
The amount of capital raised by private energy funds has trended up over the long term, with 2017 looking like a banner year for the industry as a number of large brand-name funds return to market (Figure 1). This follows two years of declines, which came as energy commodity prices slumped to multi-year lows. In aggregate, the industry has raised in excess of $200 billion across the five-year period ended 2016, a large sum even as the market capitalization of all public energy companies is near $4 trillion.
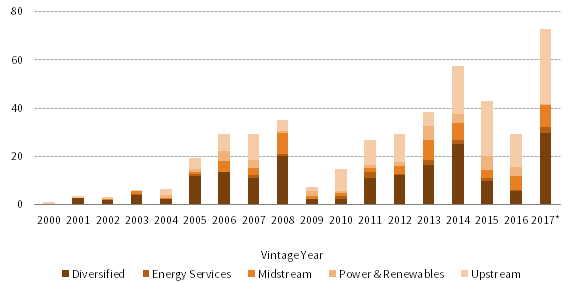
FIGURE 1 PRIVATE ENERGY FUNDRAISING BY SUBSECTOR
As of March 31, 2017 • US Dollar (billions)
Source: Cambridge Associates LLC.
Notes: Data through 2016 represent sum of fundraising targets for all funds with a given vintage year and are reported by Cambridge Associates as of March 31, 2017. Cambridge Associates’ data are supplemented by manager reported data and information from manager meetings as necessary.
* Fundraising for 2017 represents a forecast for the full year based on expected or reported fundraising targets for funds that are either open or expected to open in 2017, and is subject to change.
The uptrend in capital raised followed investor appetite. As compared to ten years ago, real asset allocations increased by a percentage point across our universe of US endowments and foundations, to 9.9% of total portfolio holdings on average. Within this real asset allocation, more than 25% on average is in private energy funds (Figure 2), representing 2.8% of the average total portfolio, nearly tripling over the last decade. Despite the increase, endowments and foundations on average are underweight real assets relative to target.
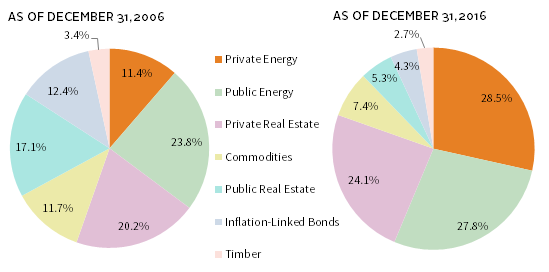
FIGURE 2 COMPOSITION OF MEAN REAL ASSET ALLOCATION
Source: Endowment and foundation data as reported to Cambridge Associates LLC.
Note: Analysis includes 234 institutions that provided data for both time periods.
The increase in fundraising and investor appetite has coincided with a rise in the industry’s level of committed but undrawn capital or, as it often referred to, dry powder. We estimate the amount of dry powder rose by approximately 20% in 2016 to $106 billion, as general partners grappled with wide bid-ask spreads on assets that resulted from the energy commodity downturn. The high level of dry powder and fertile fundraising environment may have negative implications for asset entry pricing, expected returns, and risk.
Performance Record
Private energy funds have generated an average net internal rate of return (IRR) of 12.7% and a net total value to paid-in capital (TVPI) multiple of 1.8, when looking at funds from the beginning of our data in vintage years 1986 through 2010, the last vintage we consider seasoned. Across subsectors, upstream and midstream private equity have tended to have the best IRRs. Relative to equity investments in public energy companies, private energy funds have outperformed on average, often by a substantial margin, as indicated by high levels of value add versus public market returns as calculated on a Cambridge Associates modified public market equivalent (mPME) basis (Figure 3). 1
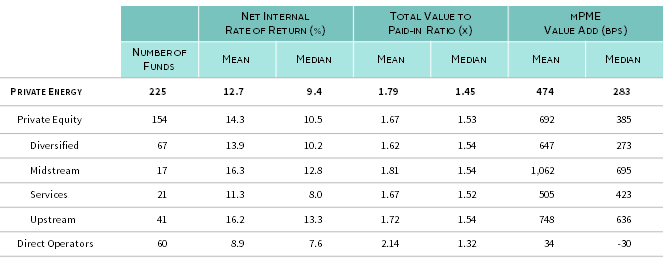
FIGURE 3 Private Energy Performance Metrics
As of March 31, 2017 • Vintage Years 1986 to 2010
Source: Cambridge Associates LLC.
Notes: Fund-level returns are equal weighted and net of fees, expenses, and carried interest. The benchmark used for the modified public market equivalent analysis is the Datastream World Oil & Gas Index. Subsector breakouts for funds focused on power and royalty interests are not shown, given the low number of funds.
Individual investment-level data confirms the performance gap. With a universe of nearly 2,000 data points, as each fund tends to make 10 to 20 investments, private energy has delivered an average gross multiple on invested capital of 1.9. Converting returns for public energy investments into a comparable multiple shows average multiples for equities, crude oil futures, and commodity futures have been materially lower—on this measure, commodity futures actually lost money on average. The difference is due partly to the larger range of outcomes in private energy—fully 25% of the data returned multiples in excess of 2.4 (Figure 4).
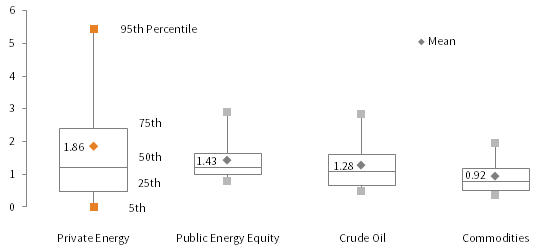
FIGURE 4 PRIVATE ENERGY DEAL MULTIPLES RELATIVE TO PUBLIC BENCHMARKS
As of March 31, 2017
Sources: Cambridge Associates LLC, Standard & Poor’s, and Thomson Reuters Datastream.
Notes: Data for private energy reflect deal level multiples on invested capital for all realized or partially realized private energy deals in our database. Investment-level data are gross of fees, expenses, and carried interest. Each private deal has a start date and end date. To calculate multiples for public real assets, a cumulative return of the public asset was calculated for a time horizon matching each private deal’s holding period. Returns for public real assets represented by the Datastream World Oil & Gas Total Return Index (“Public Energy Equity”), NYMEX Crude Oil front-month prices (“Crude Oil”), and the S&P GSCI™ Total Return Index (“Commodities”).
One of the biggest drivers of private energy performance is, perhaps unsurprisingly, crude oil performance. In comparing pooled returns of all our energy-related private funds to crude oil returns, we find a positive explanatory relationship. In fact, assuming a linear relationship in our data, a 1 percentage point (ppt) increase in oil prices over a three-year window is expected to translate into a roughly 0.65 ppt increase in private energy returns (and a 1 ppt decrease in oil prices, a 0.65 ppt decrease in private energy returns). In periods when oil performance has been negative, private energy performance has generally been positive (Figure 5). 2
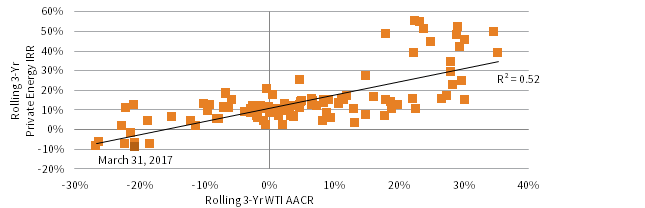
FIGURE 5 PRIVATE ENERGY PERFORMANCE RELATIVE TO CRUDE OIL PERFORMANCE
First Quarter 1990 – First Quarter 2017
Sources: Cambridge Associates LLC and Thomson Reuters Datastream.
Notes: Performance based on funds included in the CA Energy Upstream & Royalties and Private Equity Energy Index, excluding alternative and mining funds. Private energy performance represents pooled horizon internal rate of return (IRR) calculations, net of fees, expenses, and carried interest for the 324 funds of vintage years 1986 to 2016. WTI represents three-year average annual compound returns (AACRs) for front-month NYMEX crude oil prices for the period first quarter 1990 to first quarter 2017.
A factor often suggested as having a negative impact on performance is fund size. Because larger funds need to deploy more capital, the intuition is they may be less able to operate in inefficient sections of the market, precisely the place where more promising deals may exist. Interestingly, in looking across performance metrics and within vintage year ranges, our data show no clear trend in the size of private energy funds and performance. Even controlling for the largest funds in the 2005 to 2010 vintages—funds that collectively performed relatively poorly—little explanatory value is added to linear regression models. Still, investors would be wise to be discerning when considering commitments to excessively large funds, particularly as fund size has grown to new levels since 2010.
Portfolio Diversifier
Standard correlation measurements between quarterly private investment returns and those of many public benchmarks can be quite low, suggesting the return patterns are very different and that substantial diversification potential exists. However, these measurements are biased low, as the infrequent pricing of private investments understates the similarity in risks. To better understand private investments’ diversification potential, we analyze our data using two other methods: estimating unsmoothed quarterly returns for private investments, and examining return patterns over longer time horizons.
Under both of these approaches, our data indicate private energy offers diversification potential versus public and private equities and other real asset categories (Figure 6). Using estimated unsmoothed quarterly returns, correlations between private energy and other assets are generally low, particularly measurements against REITs and private real estate. Even after lengthening the time used to measure returns to three years—an approach that typically raises correlations across assets—correlations involving private energy remain appealing. In fact, it better diversified global equity allocations than any other investment in this analysis, save commodity futures.
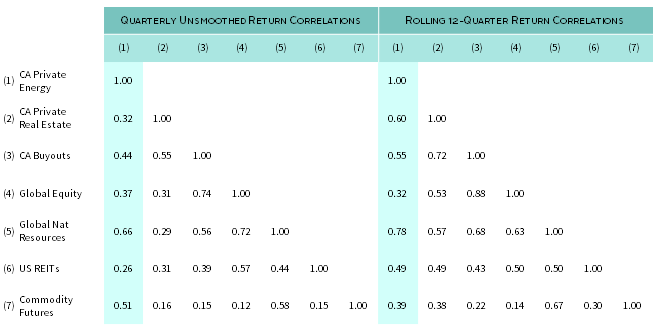
FIGURE 6 CORRELATION MATRIX
First Quarter 1990 – First Quarter 2017
Sources: Cambridge Associates LLC, FTSE International Limited, MSCI Inc., and Standard & Poor’s. MSCI data provided “as is” without any express or implied warranties.
Notes: Private investment unsmoothed returns calculated using a first order autoregressive filter. Rolling 12-quarter return correlations use traditional (smoothed) private investment pooled net internal rates of return, which are compared to modified public market equivalent internal rates of return. Returns for public real assets represented by the MSCI World/MSCI All Country World Constructed Total Return Index (“Global Equity”), Datastream World Natural Resources/MSCI World Natural Resources Constructed Total Return Index (“Global Nat Resources”), FTSE® NAREIT All Equity REITs Total Return Index (“US REITs”), and the S&P GSCI™ Total Return Index (“Commodities”).
In addition to its diversification potential, private energy’s risk/return trade-off has been historically compelling relative to other investments. Like correlations, standard deviation—a widely used, though imperfect measure of risk—is difficult to measure for private investments, again given these investments’ infrequent pricing. Using our estimated unsmoothed returns, private investment standard deviation measurements increase, with private energy moving closer to the public energy sector–heavy global resources benchmark, as might be expected. Notably, only buyout funds had a more attractive long-term risk/return profile than private energy, among our sample group (Figure 7).
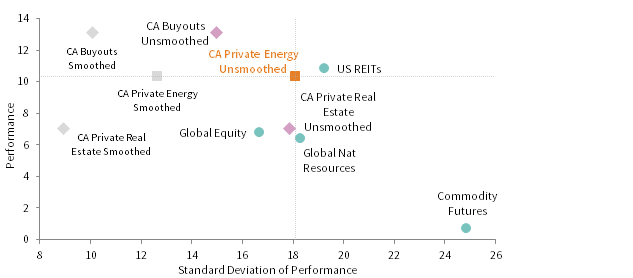
FIGURE 7 RISK/RETURN TRADE-OFF OF PRIVATE ENERGY VS SELECT INVESTMENTS
March 31, 1990 – March 31, 2017 • Percent (%)
Sources: Cambridge Associates LLC, FTSE International Limited, MSCI Inc., and Standard & Poor’s. MSCI data provided “as is” without any express or implied warranties.
Notes: Standard deviation represents annualized values based on unsmoothed returns. Unsmoothed returns calculated using a first order autoregressive filter. Private investment performance represents the horizon net internal rate of return of pooled funds across the exhibit period. Performance for public benchmarks are average annual compound rates. Returns for public real assets represented by the MSCI World/MSCI All Country World Constructed Total Return Index (“Global Equity”), Constructed Datastream World Natural Resources/MSCI World Natural Resources Total Return Index (“Global Nat Resources”), FTSE® NAREIT All Equity REITs Total Return Index (“US REITs”), and the S&P GSCI™ Total Return Index (“Commodities”).
Of course, risk dynamics for all assets do change through time (Figure 8). In fact, in the late 1990s/early-2000s, the five-year standard deviation of private energy approached commodity futures’ high level, as depicted in Figure 7. Measurements have more recently been muted relative to history, perhaps a result of managers holding prices firm for longer than usual as they struggled with the difficult oil price environment. In any case, the time-varying nature of its standard deviation underscores the fact the characteristics of private energy, like those of all asset classes, can change.
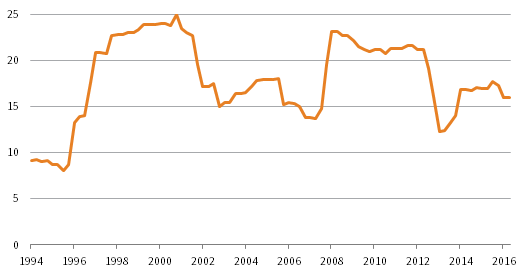
FIGURE 8 TIME-VARYING RISK IN PRIVATE ENERGY UNSMOOTHED RETURNS
March 31, 1990 – March 31, 2017 • Percent (%) • Rolling 5-Yr Standard Deviations
Source: Cambridge Associates LLC.
Notes: Standard deviation are annualized values based on unsmoothed returns. Unsmoothed returns calculated using a first order autoregressive filter.
Traditional versus Alternative
In assessing the private energy opportunity today, one key risk is the potential for a greater-than-anticipated disruption in traditional energy markets from advancements in alternative technologies. Such a scenario would almost certainly impact market values for hydrocarbon-linked assets, challenging performance for traditional private energy funds. While most major energy forecasting agencies do not expect fossil fuel production to dwindle in the next couple decades (in fact, most base case scenarios call for expansion) investors need to be mindful of the current long-term transition occurring in energy markets. 3
The US government’s Energy Information Administration (EIA) estimates that from 2016 through 2040 (the last year of its forecast), global crude oil and natural gas consumption will grow by close to 17% and 43%, respectively. The high level of growth, which is similar to other growth forecasts, is expected to be driven by large growth in energy demand across the developing world. The EIA argues that this demand is unlikely to be met by growth in renewables, even as these energy sources are expected to grow by 75% over the same time period (Figure 9).
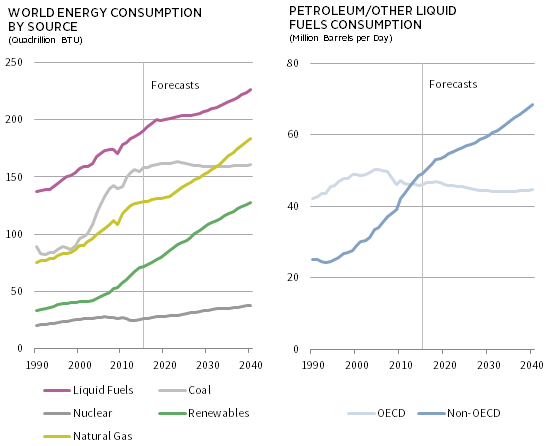
FIGURE 9 TRENDS IN GLOBAL ENERGY CONSUMPTION
1990–2040
Source: US Energy Information Administration.
Note: Vertical gray lines represent projections beginning in 2015. Energy consumption forecasts were published September 14, 2017.
A challenging aspect in understanding this forecast is pairing it with the fact that costs for renewable energy have collapsed in recent years. A recent report from asset manager Lazard examined the cost competitiveness of alternative energy and estimated that the levelized cost of utility-scale solar photovoltaic energy alone has plummeted by 85% since 2009, making it cost competitive with conventional generation technologies in some circumstances. 4 But, as the Lazard report highlights, meeting a given region’s continuous energy demands requires a diverse and balanced mix of energy, something that the intermittent energy produced by solar and wind cannot yet accomplish.
To be sure, these forecasts are likely to differ from how global energy needs evolve in the next decades. Perhaps a greater-than-anticipated disruption in energy markets will occur. However, the best way to position portfolios isn’t to avoid the industry altogether, given its long-term track record of solid performance. It’s to understand the portfolio’s underlying energy exposure, ensure that risks are prudently diversified, and entrust capital only to capable managers. In the end, investors need to be comfortable with how their risk is allocated.
Conclusion
The energy commodity downturn raised new questions about the security of some energy investments and exacerbated older concerns about the rise of alternative energy. But these concerns stand against 30 years of private energy performance data that point to a compelling risk/return trade-off for the average fund and long-term energy forecasts that still see growth in fossil fuel production for at least the next couple of decades. While these forecasts—like all forecasts—are subject to error, opting to avoid traditional private energy investments at this point in time may come at a cost. In our view, being mindful of the transition in alternative energy does not mean traditional private energy no longer has a place in portfolios.
Index Disclosures
Cambridge Associates LLC Energy Upstream & Royalties and Private Equity Energy Index
The index is a horizon calculation based on data compiled from 351 energy-related funds (including 88 energy upstream & royalties, 191 US private equity energy, and 72 ex US private equity energy funds), including fully liquidated partnerships, formed between 1986 and 2016. Private indexes are pooled horizon internal rate of return (IRR) calculations, net of fees, expenses, and carried interest.
Datastream World Natural Resources/MSCI World Natural Resources Constructed Total Return Index
The Datastream World Natural Resources Index consists of an 80%/20% blend of the Datastream World Oil & Gas Index and the Datastream Mining Index, respectively. Data reflect the Datatstream World Natural Resources Index from January 1986 to December 1998 and the MSCI World Natural Resources Index from January 1999 to the present.
Datastream World Mining Index
The Datastream World Mining Index is part of Thomson Reuters Datastream Global Equity Indexes dataset. It is composed of any equities within the Datastream World Index that are classified within the mining industry based on the Industry Classification Benchmark (ICB) classification system.
Datastream World Oil & Gas Index
The Datastream World Oil & Gas Index is part of Thomson Reuters Datastream Global Equity Indexes dataset. It is composed of any equities within the Datastream World Index that are classified within the oil & gas industry based on the ICB classification system.
FTSE® NAREIT All Equity REITs Total Return Index
The FTSE NAREIT All Equity REITs Index consists of all REITs that currently trade on the New York Stock Exchange, the NASDAQ National Market System, and the American Stock Exchange. Equity REITs include all tax-qualified REITs with more than 50% of total assets in qualifying real estate assets other than mortgages secured by real property.
MSCI All Country World Index
The MSCI ACWI Index is a free float–adjusted, market capitalization–weighted index designed to measure the equity market performance of developed and emerging markets. As of September 2017, the MSCI ACWI consists of 47 country indexes comprising 23 developed and 24 emerging markets country indexes. The developed markets country indexes included are: Australia, Austria, Belgium, Canada, Denmark, Finland, France, Germany, Hong Kong, Ireland, Israel, Italy, Japan, the Netherlands, New Zealand, Norway, Pakistan, Portugal, Singapore, Spain, Sweden, Switzerland, the United Kingdom, and the United States. The emerging markets country indexes included are: Brazil, Chile, China, Colombia, Czech Republic, Egypt, Greece, Hungary, India, Indonesia, Korea, Malaysia, Mexico, Peru, the Philippines, Poland, Qatar, Russia, South Africa, Taiwan, Thailand, Turkey, and United Arab Emirates.
MSCI World Index
The MSCI World Index is a free float–adjusted, market capitalization–weighted index designed to measure the equity market performance of developed markets. As of September 2017, it consists of 23 developed markets country indexes: Australia, Austria, Belgium, Canada, Denmark, Finland, France, Germany, Hong Kong, Ireland, Israel, Italy, Japan, the Netherlands, New Zealand, Norway, Portugal, Singapore, Spain, Sweden, Switzerland, the United Kingdom, and the United States.
MSCI World Natural Resources Index
The MSCI World Natural Resource Index is composed of the following components of the MSCI World Index: the energy sector, the metals & mining industry, and the paper & forest products industry. This index is a custom index calculated by MSCI.
MSCI World/MSCI All Country World Constructed Total Return Index
Total returns from this constructed index reflect the MSCI World Index gross total return from January 1986 to December 1987 and the MSCI All Country World Index gross total return from January 1988 to the present.
S&P GSCI™ Total Return Index
The S&P GSCI™ Index measures commodity market performance over time. It is calculated primarily on a world production–weighted basis and comprises the principal physical commodities that are the subject of active, liquid futures markets. There is no limit on the number of contracts that may be included in the S&P GSCI™; any contract that satisfies the eligibility criteria and the other conditions specified in its methodology are included.
Footnotes
- Under the CA mPME methodology, the public index’s share are purchased and sold according to the private fund cash flow schedule, with distributions calculated in the same proportion as the private fund, and mPME net asset value is a function of mPME cash flows and public index returns. The mPME analysis evaluates what return would have been earned had the dollars invested in private investments been invested in the public market instead.
- For more on this, please see Gregory Brown et al., “Oil Price Movements and Risks of Energy Investments,” The Journal of Alternative Investments, vol 19, no 4 (Spring 2017): 24–38.
- Please see International Energy Agency, “World Energy Outlook 2016,” November 2016 and US Energy Information Administration, “International Energy Outlook 2017,” September 2017. In addition, major producers also forecast growth; see Statoil ASA, “Energy Perspectives 2017,” June 2017; BP p.l.c., “BP Energy Outlook: 2017 Edition,” January 2017; and Exxon Mobil Corporation, “2017 Outlook for Energy: A View to 2040,” January 2017.
- Please see Lazard, “Lazard’s Levelized Cost of Energy—Version 10.0,” December 2016.
Kevin Rosenbaum, CFA, CAIA - Kevin Rosenbaum is Head of Global Capital Markets Research and Investment Communications at Cambridge Associates.
About Cambridge Associates
Cambridge Associates is a global investment firm with 50+ years of institutional investing experience. The firm aims to help pension plans, endowments & foundations, healthcare systems, and private clients achieve their investment goals and maximize their impact on the world. Cambridge Associates delivers a range of services, including outsourced CIO, non-discretionary portfolio management, staff extension and alternative asset class mandates. Contact us today.